
Abstract
Background
A recent attempt to improve the diagnostic value of adjusted calcium addressed a primary care-specific adjusted calcium equation, but validated the new equation for Roche Cobas, BCG and NM-BAPTA methods only. In this study, we aim to validate a population-specific equation for other methods and platforms.
Method
We collected retrospective patient data-sets from 15 hospital laboratories using a range of commercially available analytical platforms and methods for calcium and albumin measurements. Raw data-sets were collected and filtered according to Payne’s criteria, and separate adjusted calcium equations were derived for hospitalized and primary care patients.
Results
Mean albumin and calcium results were significantly higher in primary care populations (P < 0.0001). The prevalence of hypocalcaemia using adjusted calcium ranged between 6% and 44% for inpatient data-sets and was higher in users of BCG methods. The application of community-specific adjustment equation to primary care data-sets reduced the prevalence of hypocalcaemia (mean 1.7%, range 0.8–3.7%).
Conclusion
We demonstrated that the use of a community-specific calcium adjustment equation to a primary care population reduces both the percentage and the variation of hypocalcaemia between different laboratories.
Keywords
Introduction
Approximately 45% of total serum calcium is protein bound, with 10% bound to small anions and 45% in the biologically active ionized form. About 90% of the protein-bound calcium is bound to albumin, with the remaining 10% bound to a variety of globulins. Routine measurement procedures measure total calcium, which includes the bound fractions, but it is widely accepted that the measurement of total serum calcium concentration is an unreliable marker of the physiologically important ionized calcium fraction in serum. The binding of calcium to albumin is affected by abnormalities in albumin concentration and other factors, which can result in imbalance between the bound and the free fraction of calcium.1,2 In order to compensate for these effects, calcium concentrations are adjusted for albumin concentration using regression equations. In the mid-1970s, the first few widely used calcium adjustment equations emerged.3–5 For the construction of a calcium adjustment equation, inpatient data were generally used to calculate the regression of total calcium on albumin and the most common equation was: Adjusted calcium = Total calcium–0.02 (Albumin [g/L]–40) mmol/L. The regression coefficient of 0.02 is used to calculate the expected change in calcium for each gram change in albumin concentration away from the baseline of 40 g/L.
The diagnostic value of a calcium adjustment equations has always been a subject to criticism. 6 While calcium adjustment equations continued to be used in clinical practice, researchers explored reasons for the poor performance and attempted to improve the diagnostic utility of these equations.7,8 A very recent study showed that adjusted calcium was less accurate than total calcium in assigning calcium status in renal failure patients. 9
The use of population-specific adjustment equations may provide another method, by which the diagnostic value of adjusted calcium can be improved. 10 The move from the use of a general regression equation to regression equation specific for a particular patient population is not necessarily a new practice. Due to the variation in regression equations obtained from various albumin and calcium methods across different analytical platforms, the adjusted calcium equation may be deemed analytical platform and method specific. 11 In the UK, best practice guidelines recommend that laboratories derive an equation specific for their analytical platform and methods of calcium and albumin measurement. 12 An adjusted calcium equation derived for over 18 years old proved to be invalid for use in newborn and paediatric populations. 13 A previous publication has showed that there is a scope for improving calcium reporting in hospitalized patients by using an age-specific equation for patients over 60 years old. 14
This study aims to derive and validate community-specific equations for a number of commercially available analytical platforms and different albumin and calcium methods. The impact on calcium classification status (prevalence of hypocalcaemia or hypercalcaemia) is used to compare the effect of different adjustment equations. Historically, a newly derived calcium equation was best validated against ionized calcium. 15 Statistical validation, i.e. comparing the z values at 95% confidence interval for the intercepts or regression factors from different equations was previously used.11,13 In this study, for the first time, the impact on the calcium classification status will be used as indirect validation method.
Materials and method
Retrospective and anonymized biochemical data for calcium equation derivation were collected for four commonly used analytical platforms in the UK: Roche Cobas (Roche Diagnostics Ltd, West Sussex, UK), Siemens Advia (Siemens Healthcare Diagnostics, Surry, UK), Abbott Architect (Abbott Diagnostics, Kent, UK) and Beckman Olympus or DXI (Beckman Coulter Ltd, High Wycombe, UK). An invitation was sent to a group of selected UK laboratories employing one of the analytical platforms of interest. Participant laboratories were asked to collect data for calcium and albumin from their laboratory information system (LIMS) according to a circulated protocol. The protocol specified the following:
Collection of data from primary and secondary care settings Retrospective data collection for a period of two to three months to allow the availability of at least 1000 data points per equation. Exclusion of conditions which might affect calcium haemostasis as defined by Payne’s criteria, i.e. exclusion of data from patients attending endocrinology, haematology, nephrology and oncology or patients on total parenteral nutrition.
11
Both primary and secondary care data extractions included the following parameters: age (>18 years), gender, hospital number, calcium, albumin, alkaline phosphatase (ALP), alanine aminotransferase (ALT), potassium, creatinine and urea. Participating laboratories provided the name of the analytical platform, albumin and calcium methods, analytical performance data and test reference intervals.
Equation derivation
All data were filtered to exclude patients < 18 years, and then further filtered according to Payne’s biochemical criteria, in which patients with ALT > 40 IU/L, ALP > Upper Reference Limit, creatinine > 200 µmol/L, urea > 15 mmol/L and potassium outside the reference interval were excluded. Only one set of results per patient was included.
Adjustment equations were derived for each laboratory according to the method of Payne. 11 The slope and intercept were obtained from the linear regression of total serum calcium on albumin. The mean total calcium concentration in the population was also calculated using a normal plot histogram. The values for the intercept, slope and mean total calcium were entered into equation (1) (Appendix 1) for each laboratory and each population.
Data analysis
Participating laboratories were grouped by analytical platform and referred to by the name of the analytical platform followed by a number (Table 1). Calcium adjustment equations were applied to each laboratory population, and the performance of an equation was defined by its impact on the prevalence of hypocalcaemia and hypercalcaemia. The performance of each equation was compared across laboratories, analytical platforms and methods.
Analytical platforms, calcium and albumin methods for all participating laboratories.
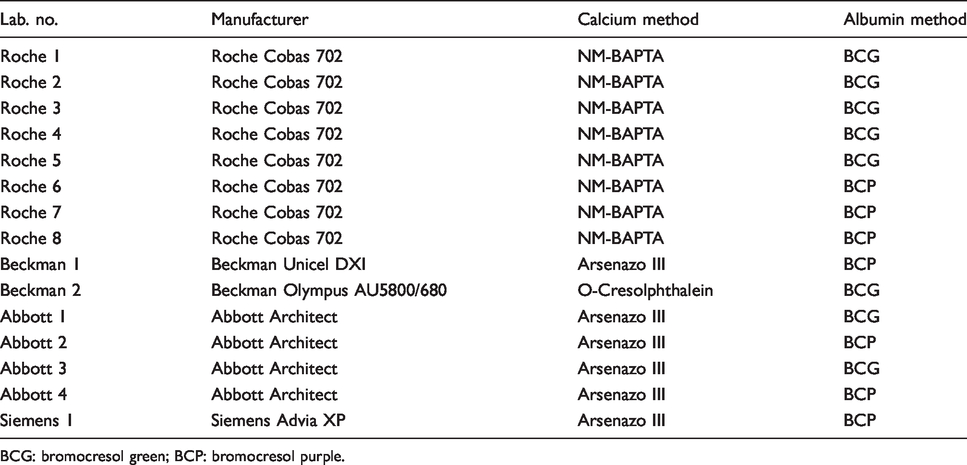
BCG: bromocresol green; BCP: bromocresol purple.
All participating laboratories performed within acceptable limits in the UK National External Quality Assurance Schemes (NEQAS). Imprecision (CV %) for total calcium was maintained below < 2% and for albumin < 3% (NEQAS acceptable precision performance limits are <2.5% for total calcium and <4%).
Statistical analysis
Simple linear regression was used for the equation derivation (Appendix 1). The Z test was used to test the statistical significance between albumin and calcium means from the inpatient and community populations. Adjusted calcium equations obtained from different analytical platforms were compared by calculating the percentage of hypo/hypercalcaemia patients identified with each equation. The statistical analysis was undertaken using Analyse-it add-in package (version 2.10) for Microsoft Excel (www.analyse-it.com).
Results
Data were received from 15 laboratories; for ‘Abbott 4’, only primary care data could be used. Two equations were produced for each participating laboratory, one for the inpatient setting (‘inpatient equation’) and another one for primary care setting (‘community equation’). The participating laboratories, analytical platform used and methods for albumin and calcium are shown (Table 1). Population demographic information for the data-sets supplied by participating laboratories is given (Table 2).
Characteristics of patient populations from each participating laboratory.
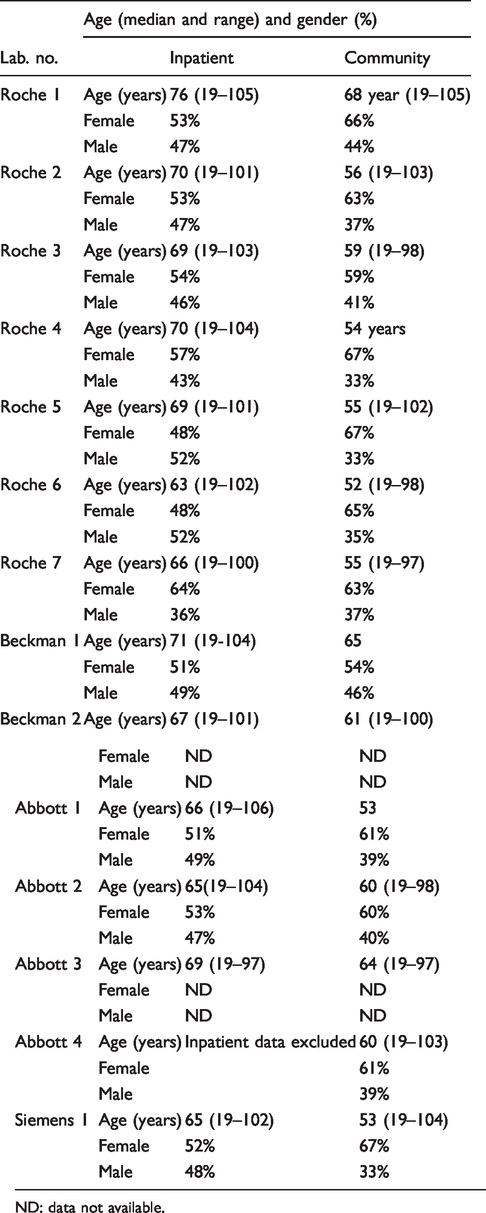
ND: data not available.
Calcium adjusted equations
The adjusted calcium equation format for hospitalized and community patients is
Adjusted calcium = Total calcium–Regression Coefficient × (Albumin-Constant)
Regression Coefficients and the Constant values for both hospitalized and community patient equations categorized by platform are given in Table 3.
Inpatient and community equations for all participating laboratories, grouped by analytical platforms.
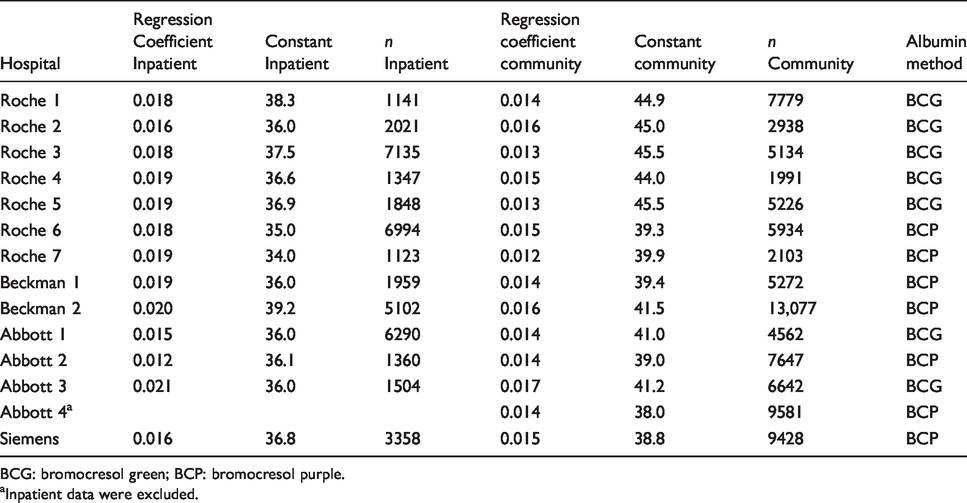
BCG: bromocresol green; BCP: bromocresol purple.
aInpatient data were excluded.
The mean calcium and albumin concentrations were higher for the primary care patients compared with hospitalized patients irrespective of albumin method (Table 4).
Mean albumin and calcium concentrations for hospitalized and community patients.
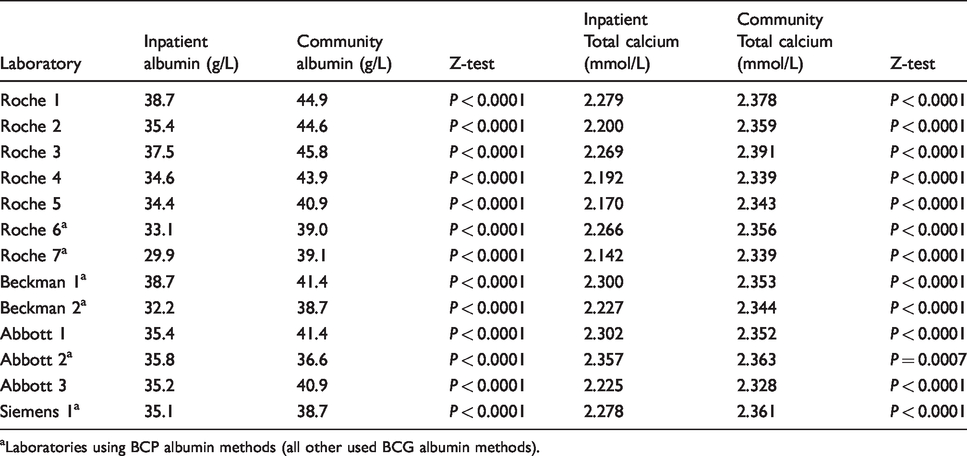
aLaboratories using BCP albumin methods (all other used BCG albumin methods).
The impact of calcium adjustment on the prevalence of hypo/hypercalcaemia in hospitalized patients
The Pathology Harmony reference interval (2.2–2.6 mmol/L) was used to define the limits for hypo/hypercalcaemia. 16 Figures 1 and 2 show the impact of the derived equations on the prevalence of hypocalcaemia and hypercalcaemia in hospitalized patients.
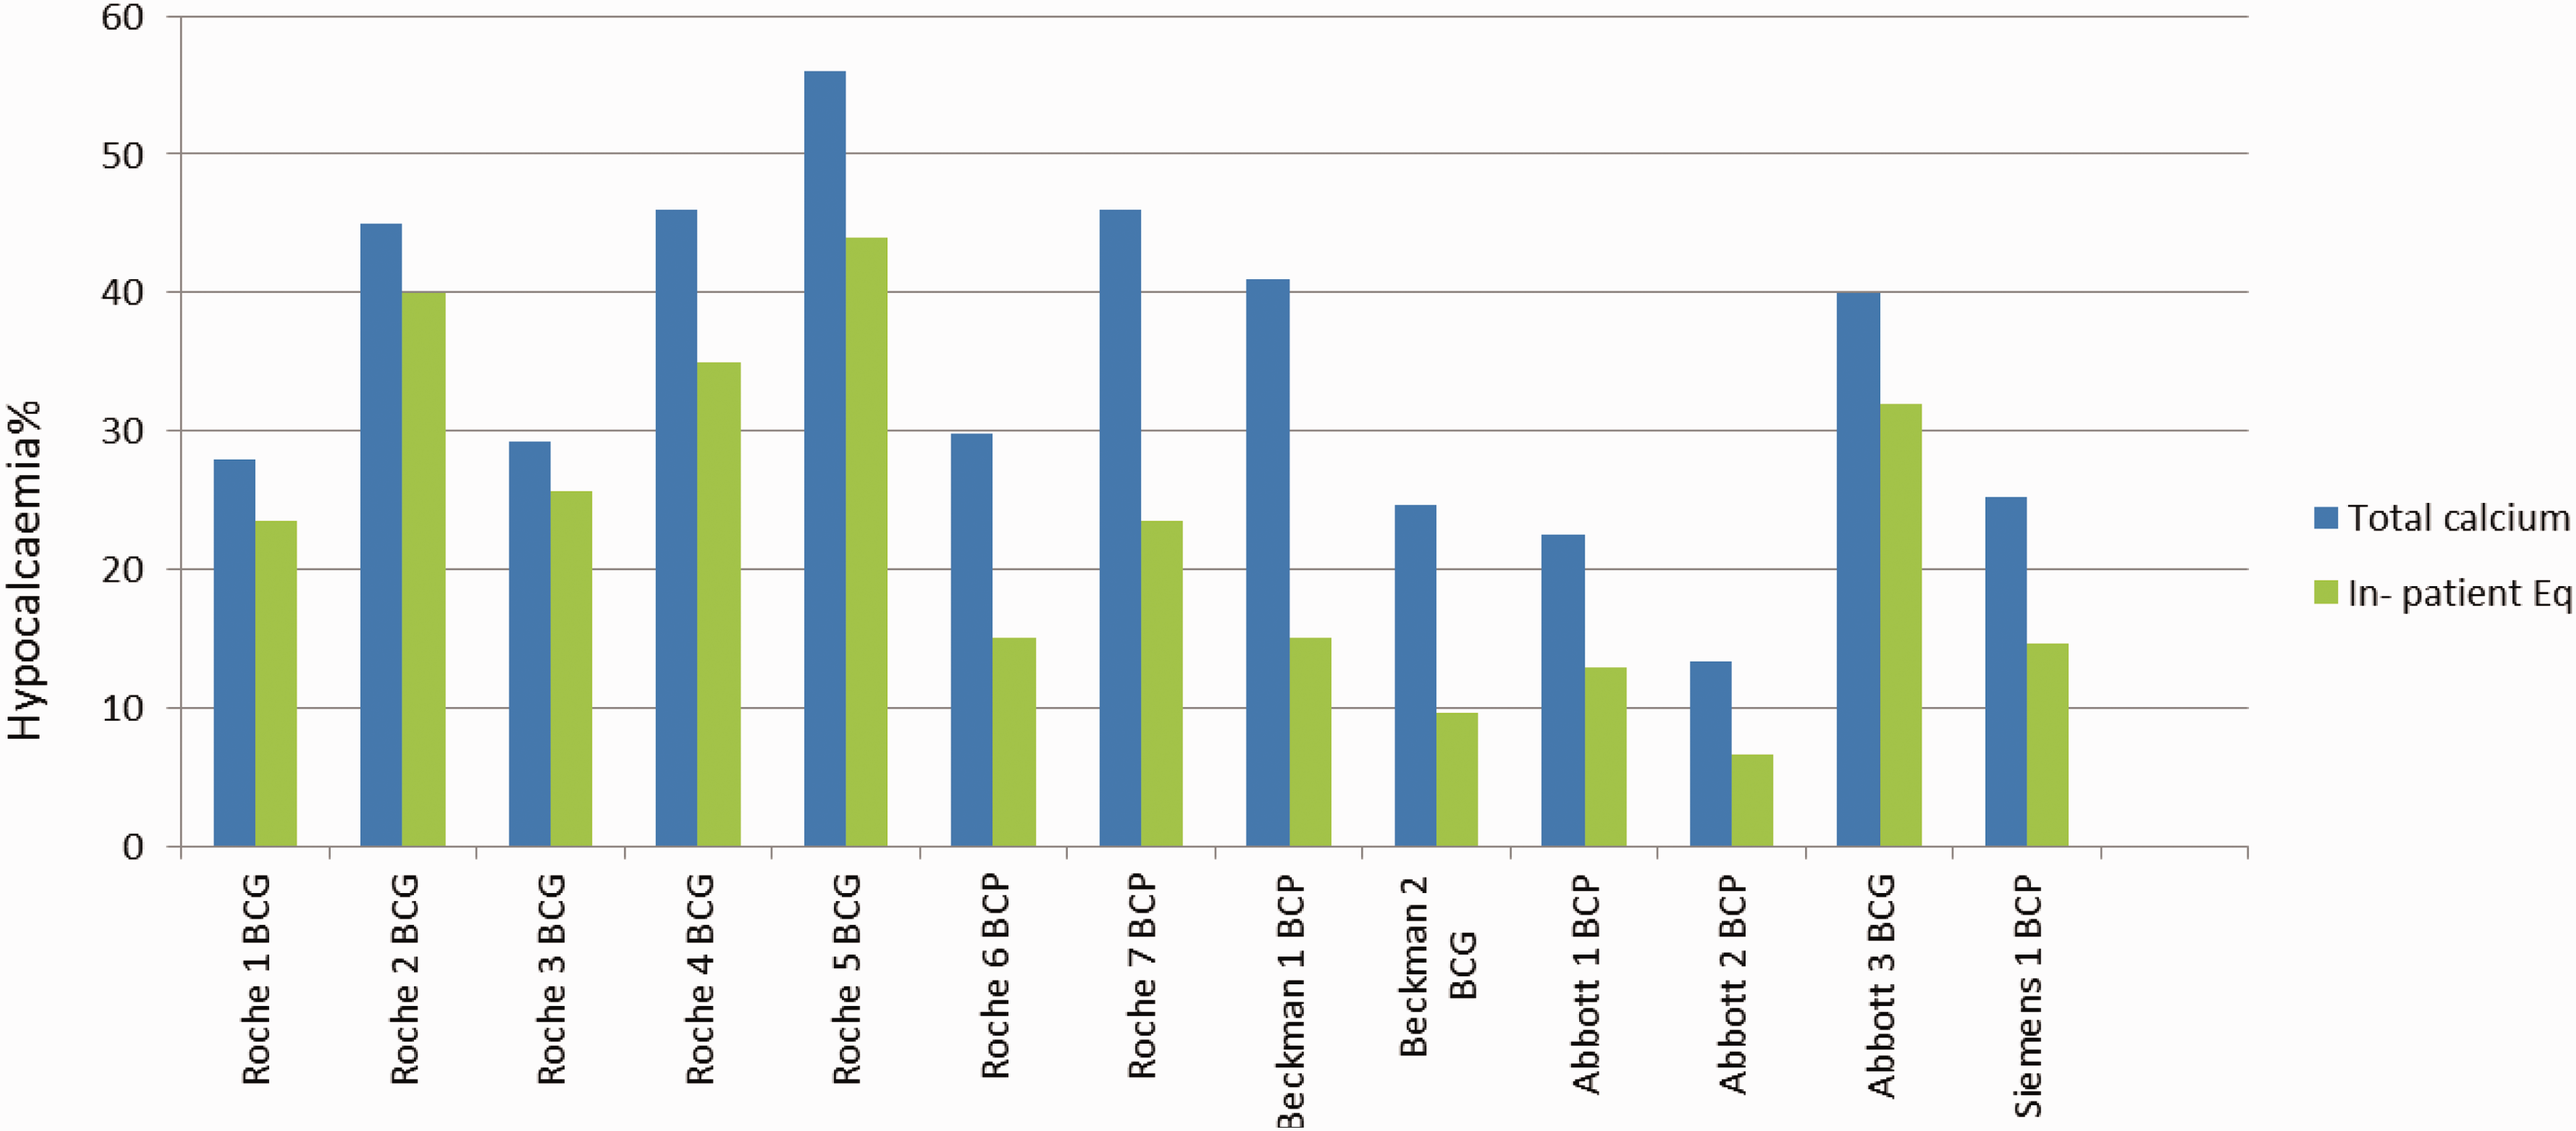
The impact of different analytical platforms and albumin methods on the prevalence of hypocalcaemia in hospitalized patients.
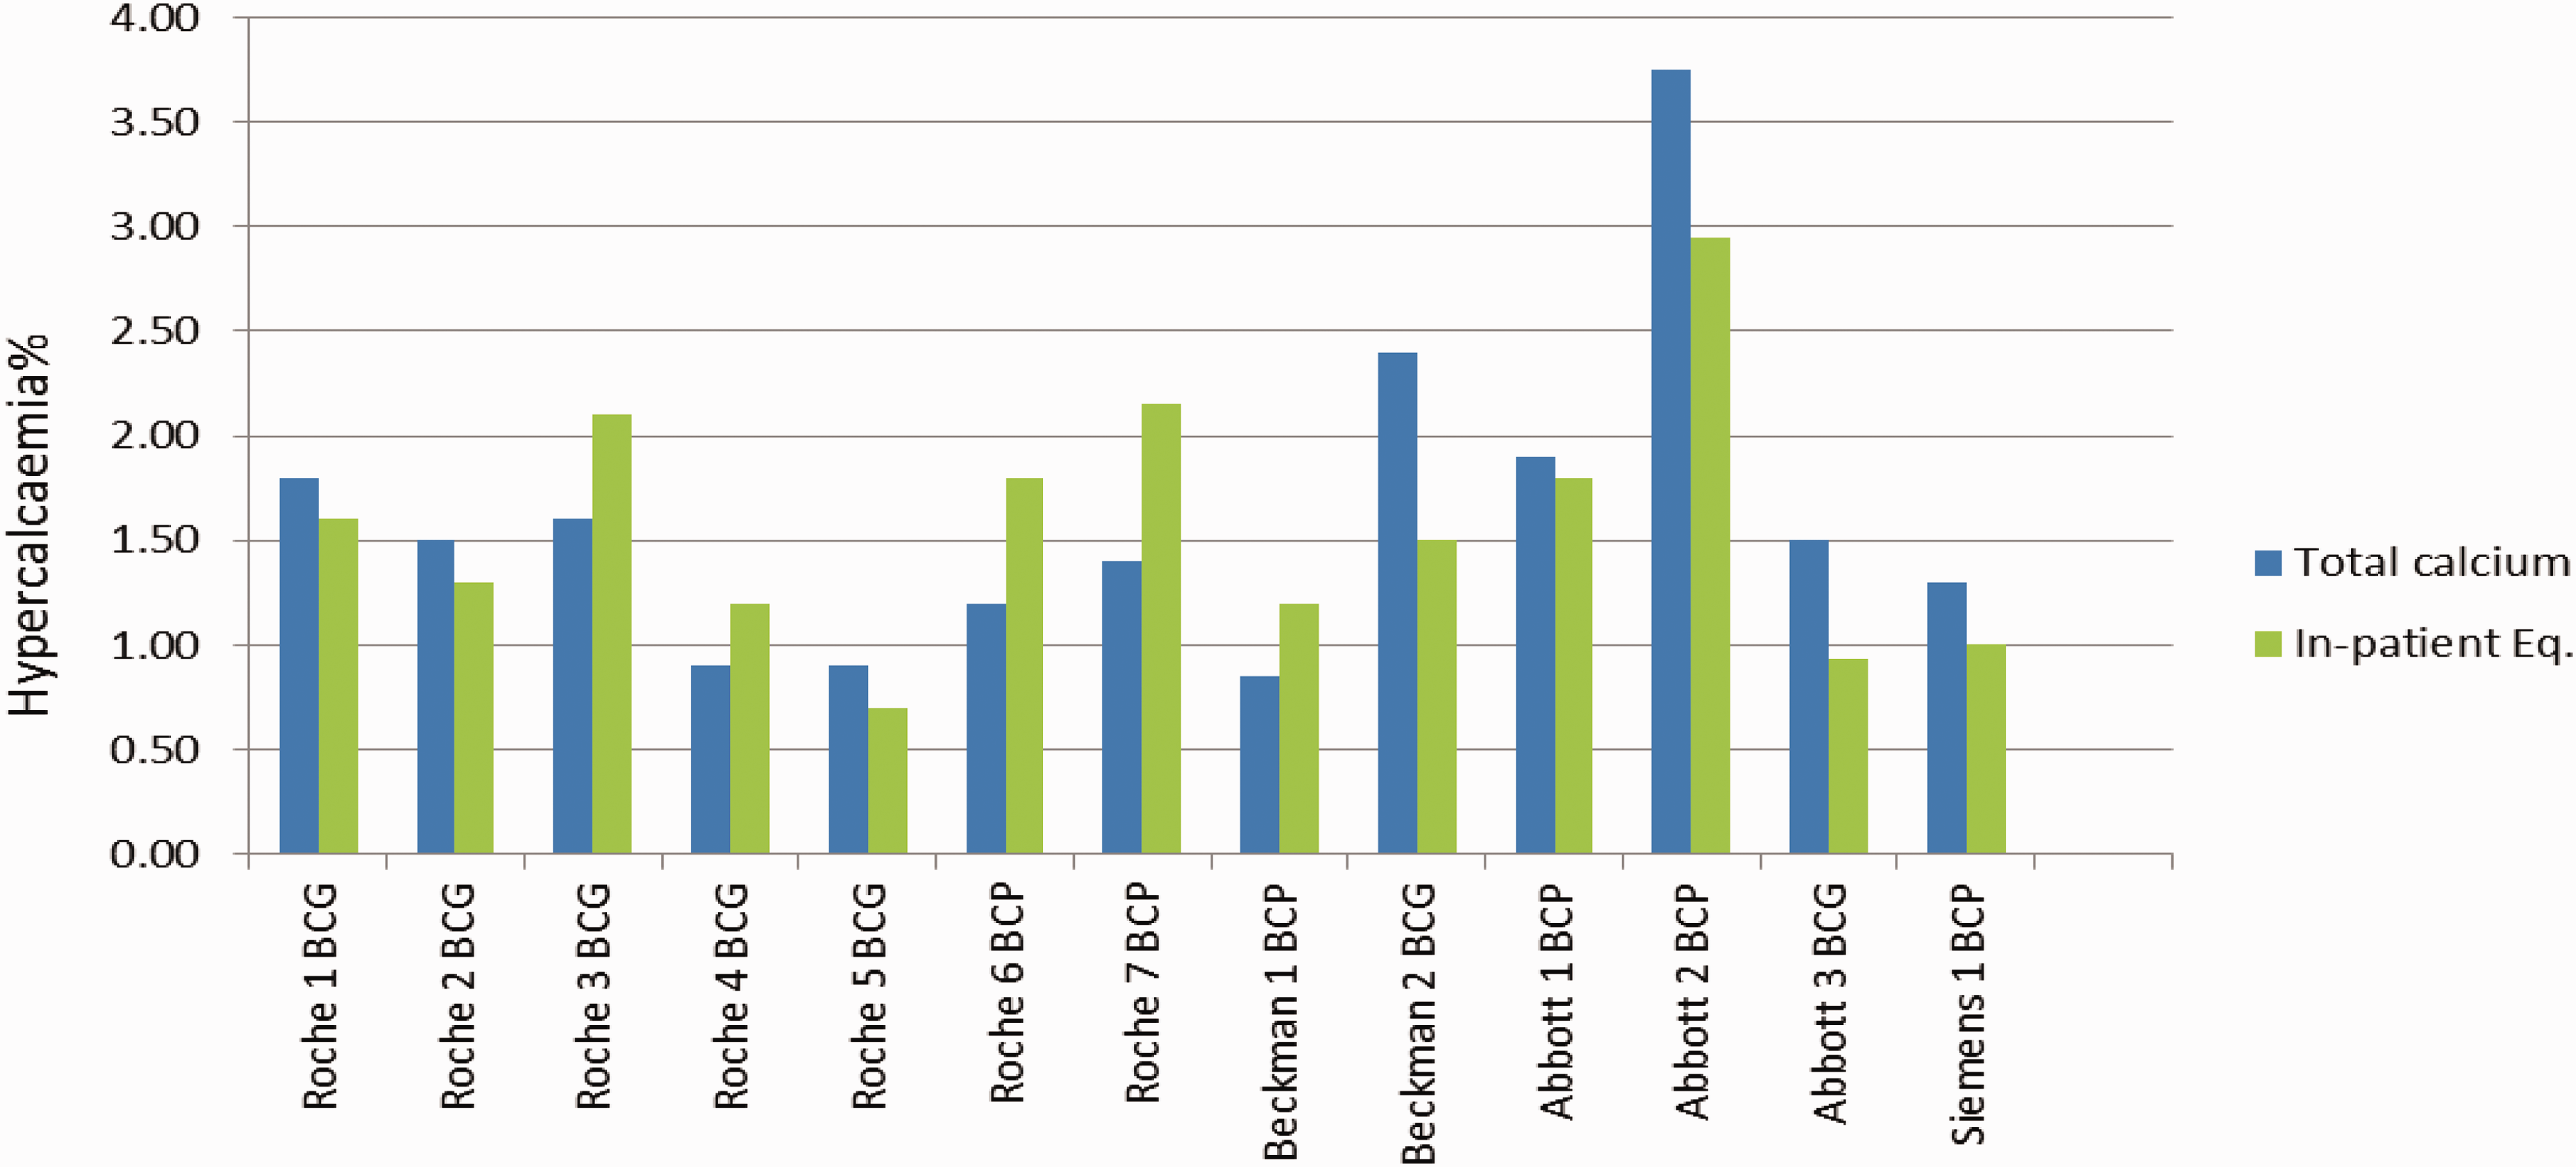
The impact of different analytical platforms and albumin methods on the prevalence of hypercalcaemia in hospitalized patients.
The prevalence of hypocalcaemia defined on the basis of total calcium results ranged from 22.5 to 55.0% among participating hospitals. Using adjusted calcium, the prevalence of hypocalcaemia reduced to 6.6–44.0%. Following calcium adjustment, a higher prevalence of hypocalcaemia was found among BCG albumin method users compared with BCP method users (Figure 1).
The percentage reduction in the prevalence of hypocalcaemia using the calcium adjustment equation compared with using total calcium for different albumin methods and analytical platforms is shown (Table 5). Table 4 shows that the adjusting power of equations (which is defined as the percentage of patients whose calcium status, i.e. hypo-/normo-/hypercalcaemia changed following adjustment) was weaker (with the exception of Beckman platform) for equations derived for BCG albumin methods than for BCP methods. Equations derived from Roche, Abbott BCG albumin method reduced the hypocalcaemia classification on average by 19% (range 8.1–21.8%) compared with using total calcium. In contrast, equations derived using BCP albumin methods reduced hypocalcaemia classification by an average of 50%, irrespective of the analytical platform.
The reduction in the percentage of hypocalcaemic patients in primary care population, using a community-adjusted calcium equation as compared with total calcium.
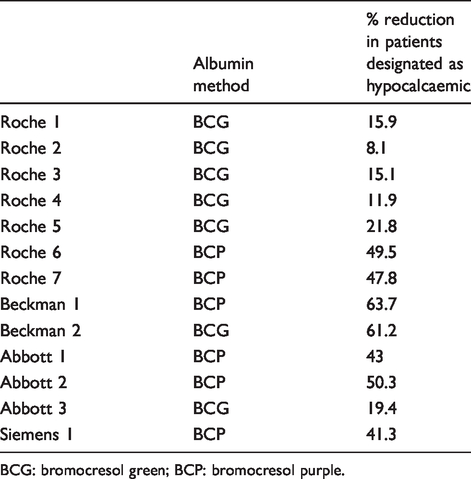
BCG: bromocresol green; BCP: bromocresol purple.
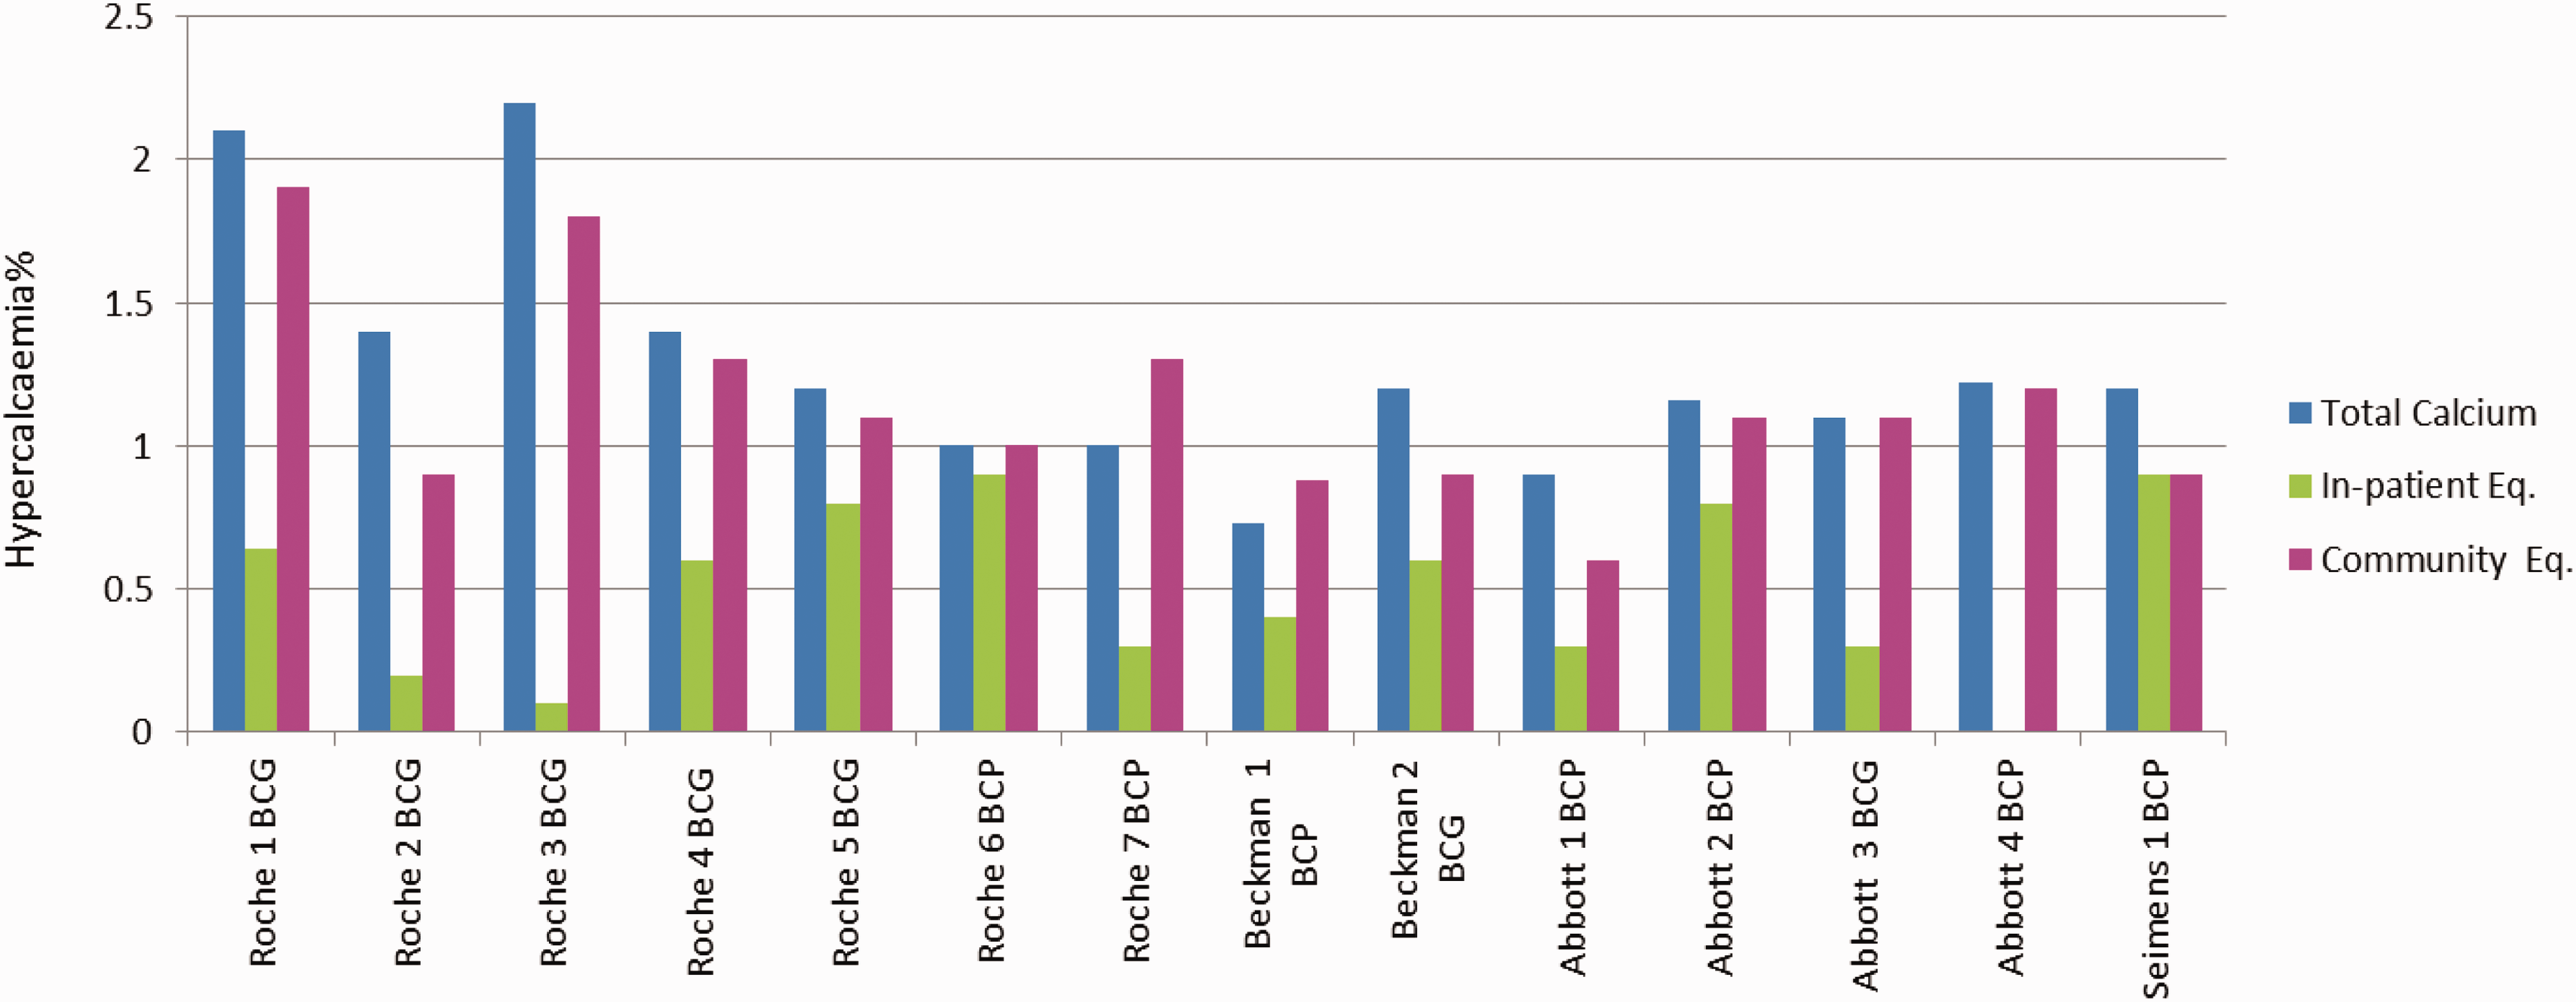
The prevalence of hypercalcaemia among the participating hospital populations appeared to be less variable than hypocalcaemia. The inpatient equations, irrespective of analytical platform or albumin method used, yielded average prevalence of 1.3% (range from 0.9 to 2.9%) (Figure 2).
The impact of calcium adjustment on the prevalence of hypo/hypercalcaemia in community setting
The prevalence of hypocalcaemia in primary care data was compared in three scenarios (Figure 3): hypocalcaemia classification using total calcium, hypocalcaemia classification using adjusted calcium (the inpatient equation) and hypocalcaemia classification using adjusted calcium (community equation). Using total calcium to define hypocalcaemia, the prevalence of hypocalcaemia in the community population ranged from 2.0 to 9.6% across all the participating laboratories. With the exception of two laboratories (Siemens1 BCP and Abbott 2 BCP), adjustment of calcium using inpatient equations resulted in an increase in the prevalence of hypocalcaemia in the primary care data-set (Figure 3).
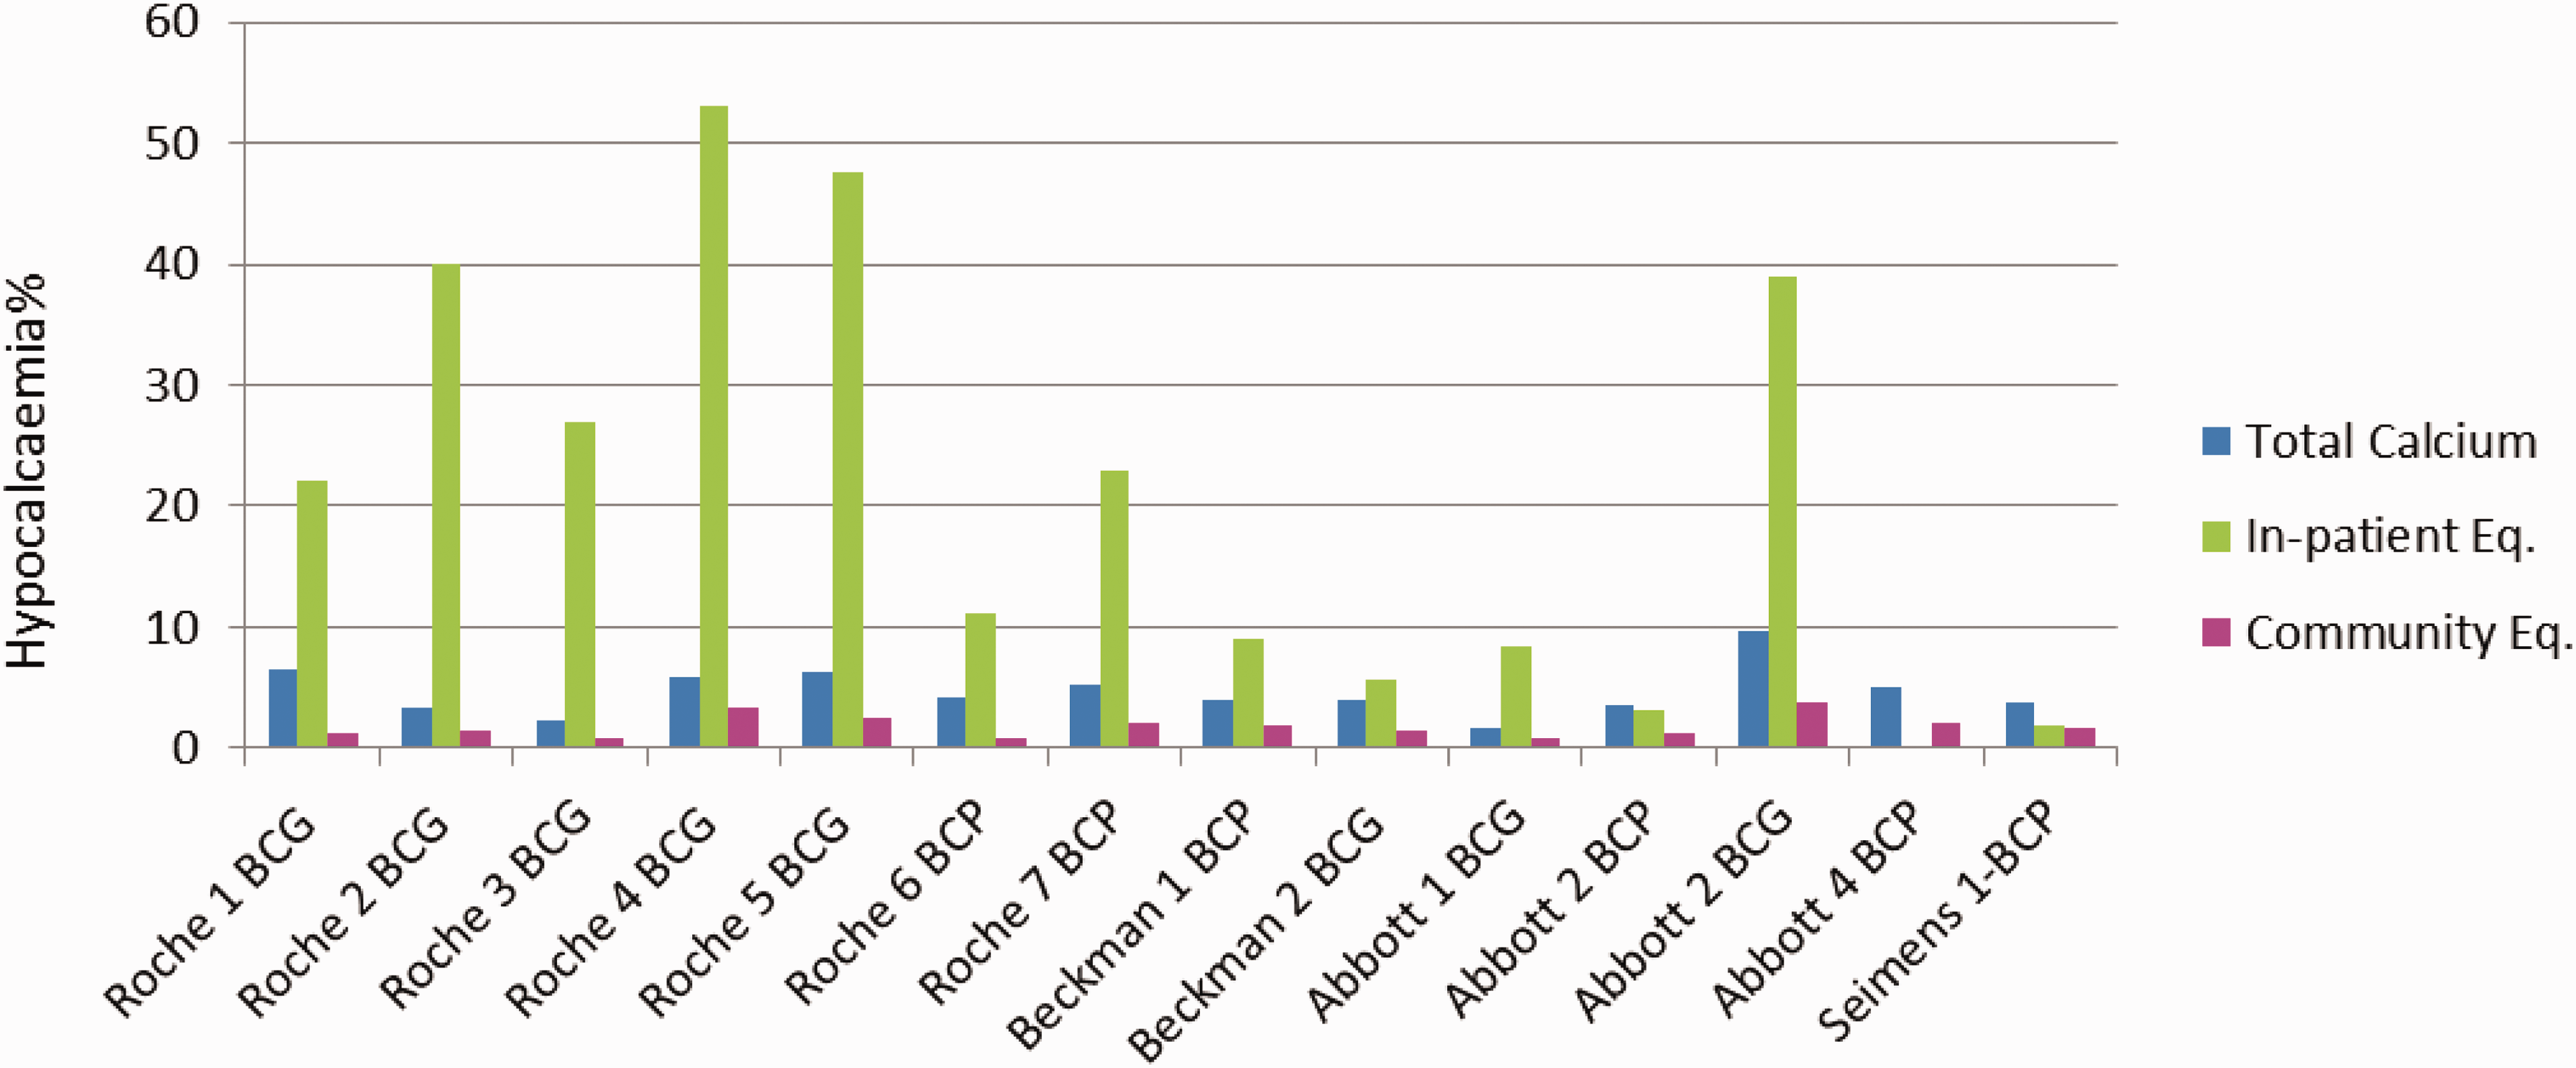
A comparison of the impact of inpatient and community equations on the prevalence of hypocalcaemia in the community population.
The performance of adjustment equations derived using inpatient data varied significantly between participating laboratories with hypocalcaemia prevalence ranging from 1.8% to 53%. This large variation was albumin method dependent. For instance, the prevalence of hypocalcaemia for BCG albumin method users, irrespective of analytical platform, ranged from 5.4 to 53%. BCP albumin method users had a lower prevalence of hypocalcaemia (range 1.3 to 9.0%) across all analytical platforms for the adjustment equation derived from inpatient data. In contrast to these findings, the application of a community adjustment equation derived from primary care data to the same data-set showed reduced hypocalcaemia prevalence for all participating laboratories with a mean of 1.7% (0.8%–3.7%). Conversely, adjustment using an inpatient equation tended to underestimate hypercalcaemia in the community patients in comparison to the adjustment equations derived using a community equation (Figure 4).
A comparison of inpatient and community equations on the prevalence of hypercalcaemia in the community population.
Discussion
In the current study, we derived community-specific adjusted calcium equations for a number of different analytical platforms and methods using retrospective data from 15 UK laboratories. The impact of using inpatient and community adjustment equations on the prevalence of hypo/hypercalcaemia for all participating laboratories was compared.
Calcium disorders are frequently encountered in primary care as well as in secondary care; however, limited data are available on the prevalence of hypocalcaemia and hypercalcaemia in these two settings. The prevalence of hypocalcaemia defined by adjusted calcium has previously been reported as 3%, 18% and 27.7% in hospitalized patients and up to 85% in intensive care patients.17–19
In this study, the prevalence of hypocalcaemia in hospitalized patients showed a bimodal distribution across different laboratories based on the albumin method used. The prevalence of hypocalcaemia among BCG albumin method users varied from 23.5 to 44%, while BCP method users showed a lower prevalence of 4.6–15%. This is consistent with a higher mean albumin for BCG methods compared with BCP methods irrespective of analytical platform (Table 3). Systematic differences between BCG and BCP albumin methods have long been recognized. 20 BCG measurement of albumin is subject to interference from α-globulins, haptoglobin and immunoglobulins, resulting in overestimation of albumin concentrations in disease processes that elevate these globulin concentrations in serum.21,22 The difference in albumin concentrations resulting from the use of BCG and BCP methods has previously been reported to be of clinical significance. 23 Clase et al. compared the performance of BCG and BCP methods and demonstrated differences, with significantly higher BCG albumin results compared with BCP in renal and non-renal patients. 6 It has been reported that a newer version of BCP methods agrees more with the reference method and as such is increasingly now being favoured over BCG methods. 24 There are still important limitations to the BCP method, as it has been shown to underestimate albumin in haemodialysis patients. 25 Another study has reported that the differences in BCG and BCP methods accounted for significant differences in the classification of adjusted calcium results in haemodialysis patients. 26 Labriola et al. assessed the impact of albumin assays on the achievement of K/DOQI target for calcium; they established that use of BCG albumin increased the prevalence of hypocalcaemia and reduced the prevalence of hypercalcaemia compared with the use of BCP albumin.23,26 Our study confirms the results of previous publications and shows that the use of either BCG or BCP assays has a major impact on albumin-adjusted calcium equation performance and thus impacts on the classification of the calcaemic status of patients.
In the inpatient data-set, we observed a large variation in the prevalence of hypocalcaemia (4.6–44%) as defined by adjusted calcium. All the participating laboratories supported NHS acute hospitals and an identical protocol was applied in each for data collection to derive the adjustment equation. This means that the large difference in hypocalcaemia prevalence is unlikely to be related to variation in equation derivation. The large variations in total calcium concentrations suggest that these differences in hypocalcaemia prevalence may be due to variation in patient mix and demographics. There is evidence that prevalence in calcium status changes even over time in the same hospital. 18 Although participating laboratories all reported acceptable performance in external quality assurance schemes, the impact of analytical bias cannot be excluded. Literature evidence showed problematic traceability for albumin in particular and to lesser extent for calcium.27,28
Few studies have reported on the prevalence of hypocalcaemia in ambulant patients and even within these studies, the prevalence varied significantly based on the population demographics. For example, a study that assessed the prevalence of hypocalcaemia in patients attending various clinics in a Nigerian university hospital reported a prevalence of 11.53%, 29 whereas hypocalcaemia in children attending outpatient clinics in Yemen was reported to be 58%. 30 Another study reported a hypocalcaemia prevalence of 29% in patients receiving anticonvulsant therapy. 31 In a healthy population, however, Philipson et al. reported a much lower prevalence of hypocalcaemia of 0.6%. 32 In agreement with the above studies, our data showed a high prevalence of hypocalcaemia and large variation in the prevalence of hypocalcaemia between participating laboratories. The variation in hypocalcaemia prevalence in primary care data-sets between laboratories is unlikely to be explained by population differences alone. This is because the hypocalcaemia prevalence in the primary care populations based on total calcium was much lower (1.3%–9%) than the hypocalcaemia prevalence as defined by adjusted calcium. These results suggest that the main reason for the increase in the prevalence and the large variation of hypocalcaemia was the application of a conventional Payne’s inpatient adjustment equations to primary care populations. The variation in prevalence of hypocalcaemia between different laboratory primary care data-sets was also similar to the variation seen in hospitalized patients in the data from different laboratories. Our results suggest that this variation was platform independent but albumin method dependent and showed a bimodal distribution of hypocalcaemia. Almost all BCG and BCP albumin methods (with the exception of two BCP users) yielded equations, which significantly overestimated the prevalence of hypocalcaemia compared with using total calcium to estimate the prevalence of hypocalcaemia. This finding raised important concerns about the validity of using adjustment equations derived from inpatients and applied to a primary care population. However, in the absence of ionized calcium data, the true prevalence of hypo and hypercalcaemia in these data is not known. A previous study 10 has also demonstrated that the use of an inpatient-derived adjustment equation overestimated hypocalcaemia in both healthy volunteers and in primary care patients. Indeed, in this study, the application of community adjustment equations to primary care populations significantly reduced the magnitude and between laboratory variations in the presence of hypocalcaemia (reduced from 1.3–53% to 0.8–3.7%). This suggests that calcium adjustment equations specific to primary care population have the potential to harmonize the reporting of adjusted calcium in the primary care setting by different laboratories. Our study supports the hypothesis that it is possible to improve the performance of adjusted calcium by the use of population-specific adjustment equations. It also confirms that the reduction in the prevalence of hypocalcaemia in primary care upon the application of community equations is not platform dependent. 10
The reason for the increased prevalence of hypocalcaemia in the primary care population upon the application of a conventional inpatient equation is most likely attributed to a higher mean albumin concentration in this population. In this study, with no exceptions, it was found that the mean albumin in primary care patients was higher than the baseline albumin in inpatient equations (Tables 3 and 4). An equation derived from an inpatient population with a lower mean albumin would tend to shift adjusted calcium results downwards when applied to a population with higher mean albumin concentration.
In agreement with the previous study, 10 we found that calcium and albumin means are higher for ambulant patients than for hospitalized patients, which implies that these are different populations and would benefit from derivation of separate equations for each population.
Other than adjusted calcium equations and demographics, the variation in prevalence of hypocalcaemia can also be attributed to the use of different reference intervals, different platforms and methods33,34 or/and analytical performance. 35 In this study, the variation that stems from derivation of adjusted calcium equations was removed by the use of a standardized protocol. But variation that stems from the reference interval or analytical performance has not been evaluated here. Nevertheless, the observed variation in the prevalence of hypocalcaemia is rather large to be explained by the reference interval alone. The majority of BCG method users in this study were Roche Cobas users. A BCG method from Abbott Architect, but not from Beckman Olympus, showed a similar performance to BCG from the Roche Cobas platform. One of the limitations of this study was that the number of non-Roche BCG users is very small (two other users); therefore, a conclusion cannot be reached about the BCG performance using other analytical platforms.
The original statistical methods of calcium equation derivation were all based on linear regression. 3 Linear regression was used to calculate the regression coefficients in this study. Payne, however, argued that the use of Deming regression is a more statistically robust approach, especially where there is imprecision in both variables. 36 Different regression models may yield subtle differences in adjustment equations, and this is an area for further work. A major limitation of this study was the absence of a gold standard test (ionized calcium) to assess calcium status. Therefore, a multicentre study recruiting a reference population from a primary care setting with common samples analysed on a variety of different analytical platforms would be required to validate the conclusions of this study.
In conclusion, this study shows that the use of community-specific equations reduced both the percentage and the variation of hypocalcaemia between different laboratories and has the potential to harmonize adjusted calcium reporting in primary care setting.
Footnotes
Declaration of conflicting interests
The author(s) declared no potential conflicts of interest with respect to the research, authorship, and/or publication of this article.
Funding
The author(s) received no financial support for the research, authorship, and/or publication of this article.
Ethical approval
None applicable.
Guarantor
NJ.
Contributorship
NJ planned, analysed the data and drafted the paper. All authors collected and provided raw data. All authors read and agreed the final version of the article.
Appendix 1. Adjusted calcium derivation equation.
Using analyses-it perform Deming regression or linear regression (x variable albumin and y variable Ca). This analysis gives an intercept or non-protein-bound calcium and slope. See example below
Perform continuous summary descriptive on measured calcium data. This analysis gives the mean calcium for this population of data. Subtracting the intercept the non- protein bound calcium from mean Ca gives the average protein –bound calcium.
Enter intercept slope and mean Ca values into this equation:
From above analysis we find that:
Calcium mean = 2.279 mmol/L
Intercept = 1.5950
Slope = 0.01769 this figure rounded to (0.0177)
Place these values in equation 1: Adjusted calcium abbreviated as; Adj Ca Total calcium abbreviated as; T.Ca Albumen abbreviated as; Alb
Divide both sides of the equation by 0.0177 and re-arrange.
Re-arrange to give the final adjustment equation.