
Abstract
Aim
The generation of accurate, comparable results from traceable measurement procedures is a primary goal in harmonization efforts. In this study, the analytical performance of routine methods for calcium and albumin measurement is assessed to define the impact of the analytical bias of calcium and albumin on adjusted calcium equation performance and on reference intervals.
Method
In collaboration with the Wales External Quality Assurance Scheme, six months’ worth of anonymized data that cover a concentration range of clinical interest were collected. The data were grouped by analytical platforms/methods.
Results
Albumin BCG methods are positively biased (8%) to BCP methods. The overall bias for BCP methods ranges from 5.1 to –4.3% and the overall bias for BCG methods is from 2 to –6.7%. Bias for both methods is higher than the allowable minimal bias for albumin. Calcium concentrations for Roche Cobas CPC and NM-BAPTA, Beckman Arsenazo III, Abbott Architect Arsenazo III were within bias of 1.5 to –1%. However, Siemens calcium methods CPC and Arsenazo III appear to suffer from concentration-dependent bias ranging from +3 to –6%, which exceeds even the minimal allowable limits for calcium (1.3%). Adjusted calcium shows significant bias of 11%. Even with the exclusion of Siemens Advia, the scatter of adjusted calcium results exceeds that for total calcium.
Conclusion
This study shows wider than acceptable analytical variation for albumin and calcium. This variation may contribute to overall adjusted calcium equations variation and invalidate the application of a harmonized reference interval for calcium and albumin.
Background
The generation of accurate and comparable biochemical results from different measurement procedures is a primary goal of Laboratory Medicine. Calcium and albumin measurements have wide clinical applications ranging from diagnosis, monitoring and as prognostic markers in renal disease and myeloma. Calcium and albumin may be measured on a number of analytical platforms. Each platform has its own analytical performance characteristics. These characteristics are determined at the design stage. Method specificity and precision are important markers of analytical performance, as they directly impact on the clinical performance of biochemical tests. Several studies have attempted to define what constitutes a clinically acceptable level of analytical performance for individual biochemical tests. 1 For assays with metrological traceability, achieving transferability of test results and harmonizing reference intervals requires knowledge of analytical bias and allowable tolerance limit. For harmonizing reference intervals, the bias should be < 0.25√ (CVI 2 + CVG 2 ), where CVI is within individual biological variation and CVG is between individual biological variation. 2
In this paper, the analytical performance of various methods for calcium and albumin measurement is assessed to define the impact of the analytical bias of calcium and albumin on adjusted calcium equation performance and on reference intervals. Bias estimation was assessed using data from the Wales External Quality Assurance Scheme (Weqas) for calcium and albumin.
Material and methods
The data-set was provided by Weqas. Data were derived from six distributions from the Weqas Serum Chemistry Programme for the period from December 2017 to May 2018. In the Weqas Serum Chemistry Programme, 24 samples are analysed for each general chemistry test in the course of a six-month period, four liquid samples per distribution. Sample are analysed, and results are returned to Weqas for data analysis. A six months’ worth of data were collected with the aim to cover a concentration range of clinical interest for both albumin and calcium. The data were initially grouped by analytical platforms/method.
This set of data was then analysed to identify the degree of bias in routine albumin and calcium methods used by Weqas participants. The analytical platforms of the manufacturers with analogous technology were grouped in a single category, e.g. Abbott included all Architect models (Ci 6000, Ci8200, Ci 4000). Beckman analytical platforms included all AU instruments (AU2700/AU5400/AU5800). Roche analytical platforms included all Cobas instruments (Cobas 6000/8000) and a single group for Siemens Advia instruments. All calcium methods included in this study were colorimetric, and all albumin methods were dye binding. Desirable bias was calculated for total calcium, adjusted calcium and albumin using the following equation 0.25√ (CVI 2 + CVG 2 ). Data for CVI and CVG were obtained from the European Federation of Laboratory Medicine (EFLM) website for biological variation database https://biologicalvariation.eu/ with additional information from https://www.westgard.com/biodatabase1.htm. 3
Results
The analytical platforms, calcium and albumin methods investigated in this study are presented in Tables 1 and 2.
Analytical platforms for calcium measurement methods of Weqas participants.
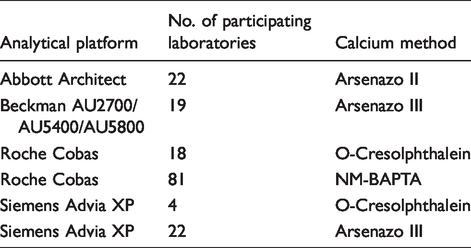
Analytical platforms for albumin measurement methods of Weqas participants.
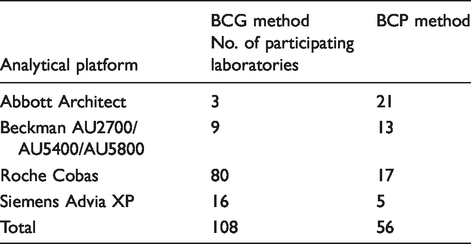
Total calcium measurements from participating laboratories were compared with a calcium reference method (Atomic Absorption reference method assayed in a Joint Committee on Traceability in Laboratory Medicine [JCTML] reference network laboratory). Due to the unavailability of reference methods for serum albumin and adjusted calcium, these results were compared with all methods mean (AMM). AMM values for the BCG albumin method were derived from 108 laboratories. BCP albumin is available from the same manufacturers as BCG but was used by only 56 laboratories. Adjusted calcium AMM was derived from a total of 166 participating laboratories. The concentrations for total calcium ranged from 1.2 to 2.9 mmol/L and for albumin ranged from 25 to 49 g/L.
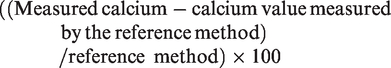
Bias for albumin and adjusted calcium was calculated as

Bias for calcium was calculated as
Data on albumin BCG and BCP methods are presented in Figure 1. Data on bias for total and adjusted calcium are presented in Figures 2 and 3, respectively. Performance of methods/platforms was assessed against the bias performance specification derived from biological variation 3 and categorized into desirable, optimum and minimum performance. 2 Desirable performance was defined by CVA < 0.50CVI, optimum performance was defined by CVA < 0.25CVI and minimum performance was defined by CVA < 0.75CVI, respectively.
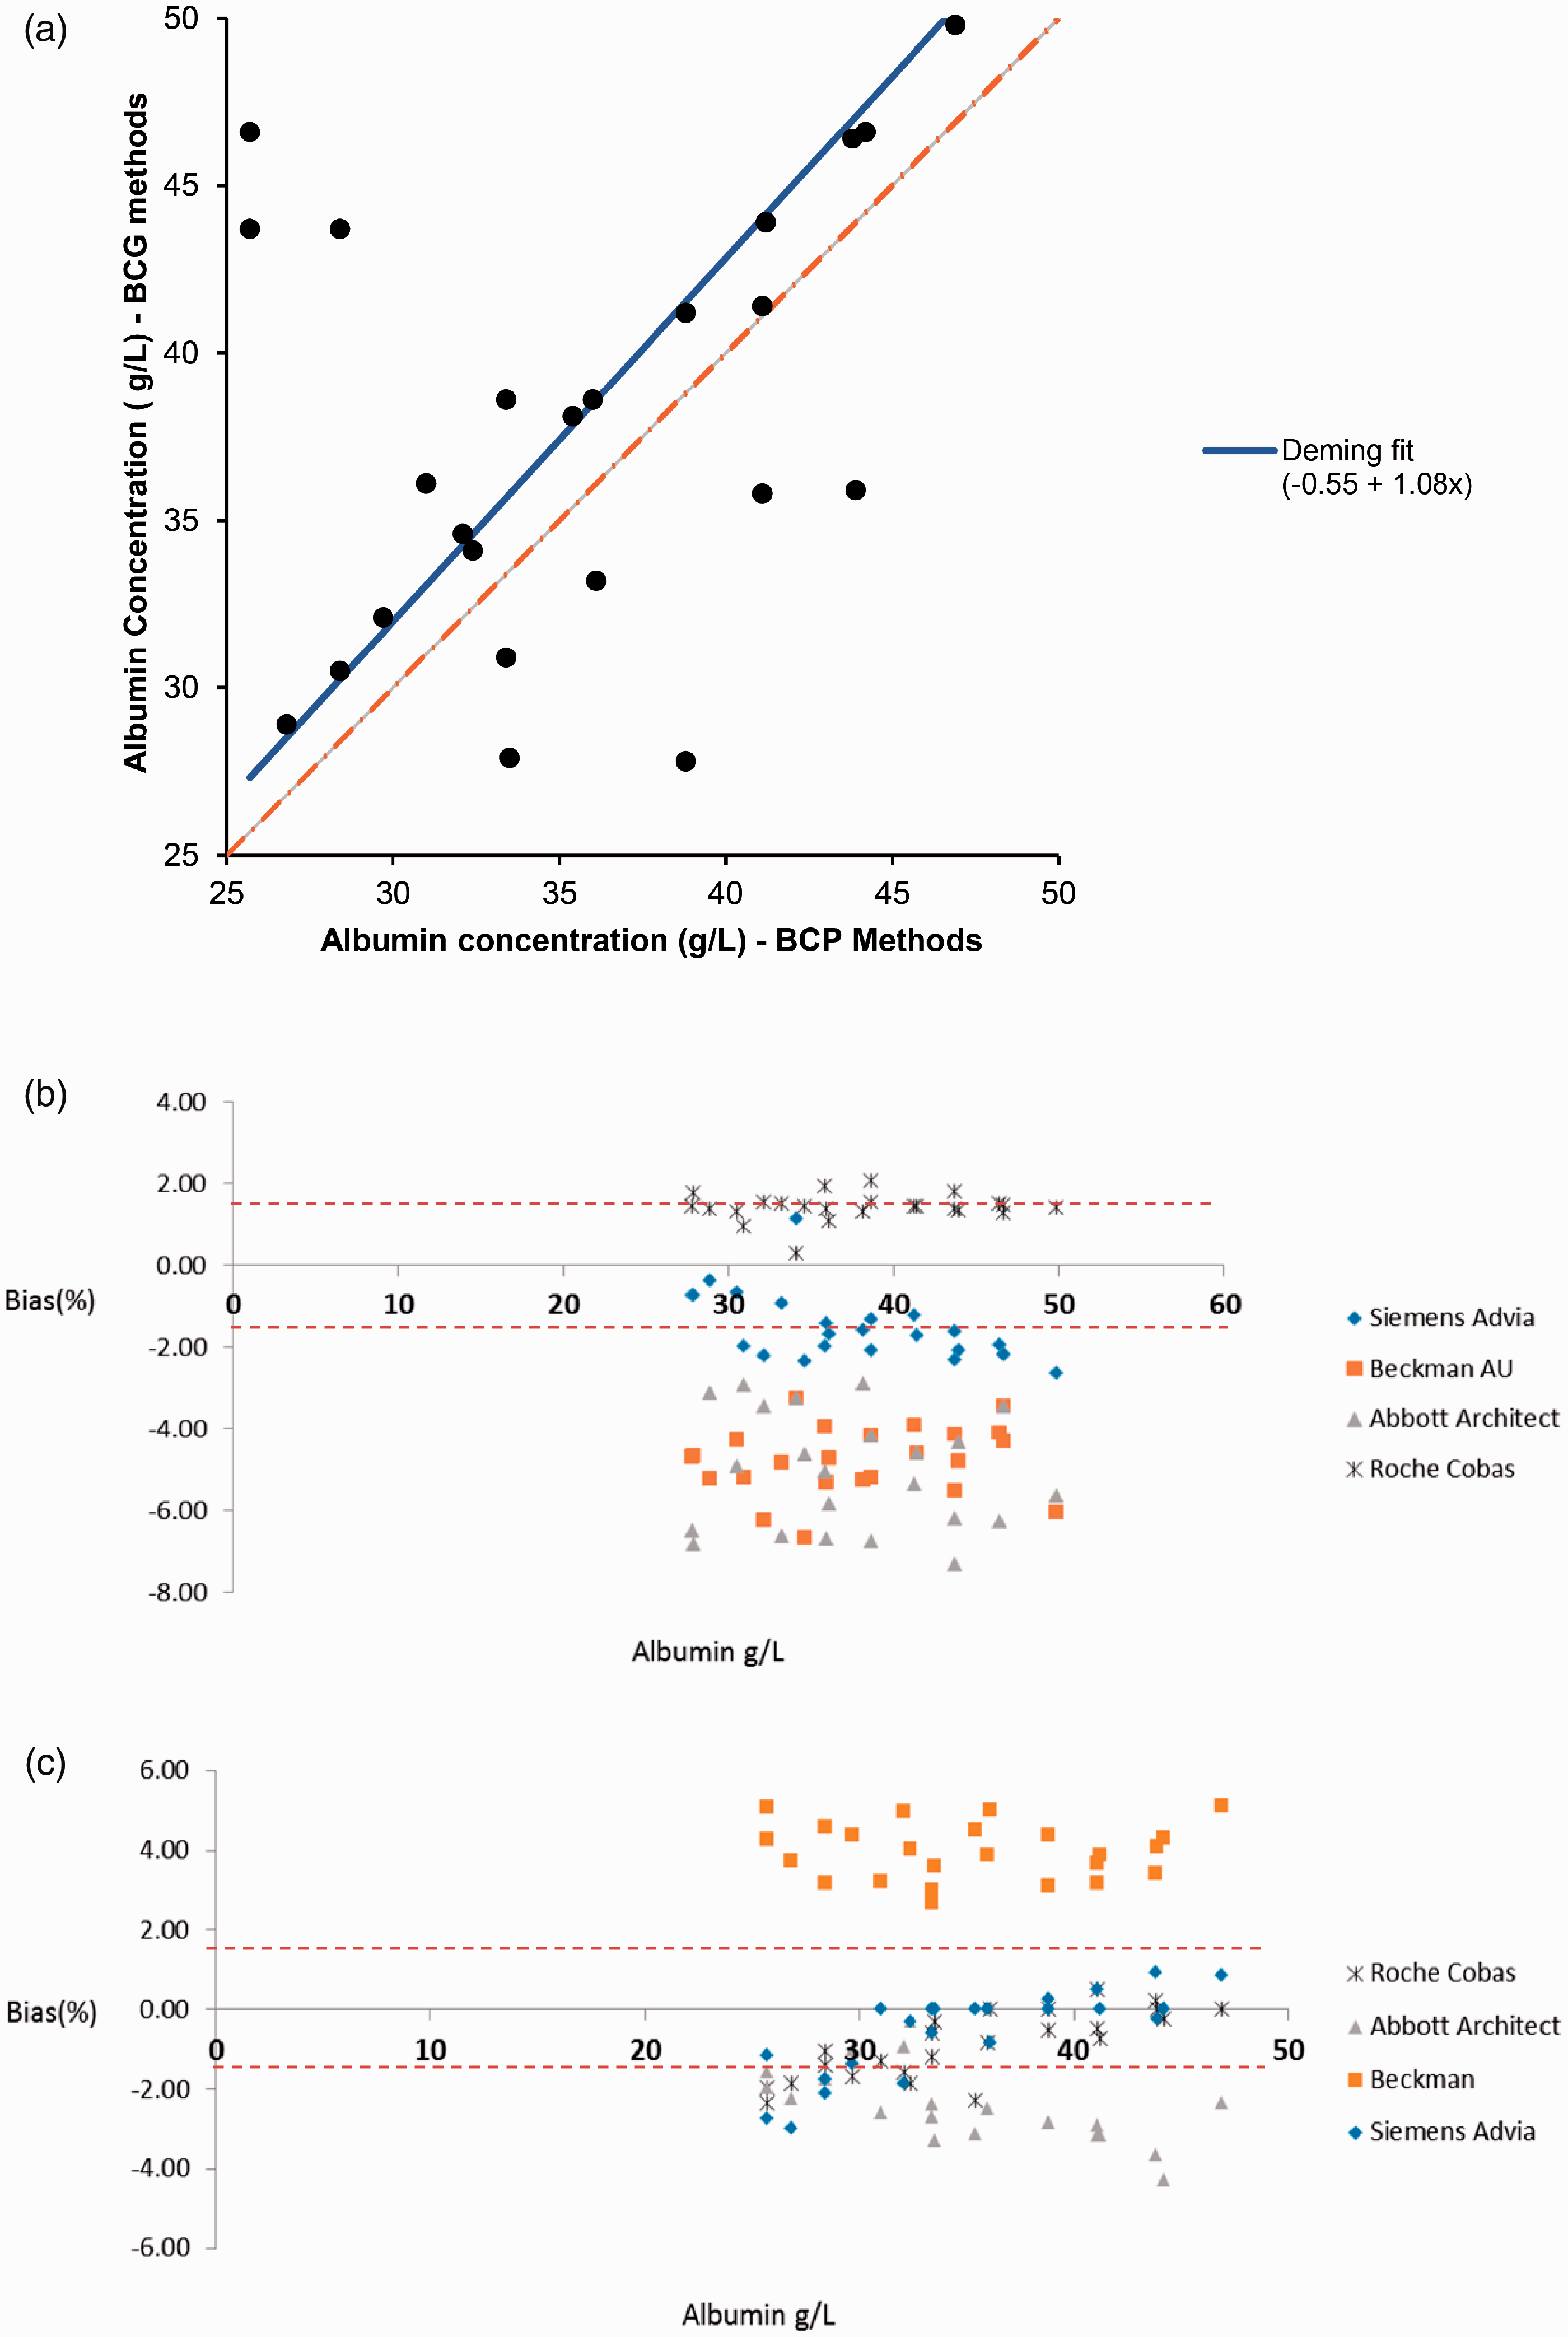
Albumin scatter plot using data from Weqas for the four serum pools distributed (a) A scatter plot comparing albumin concentration for BCG methods versus BCP methods. Linear regression line (solid line) revealed a higher albumin concentration for BCG methods than BCP (y= 1.08x–0.55), (b) a sub-plot comparing all BCG methods. (c) A sub-plot comparing all BCP methods. The red dashed lines represent the limit of desirable bias of 1.4%.
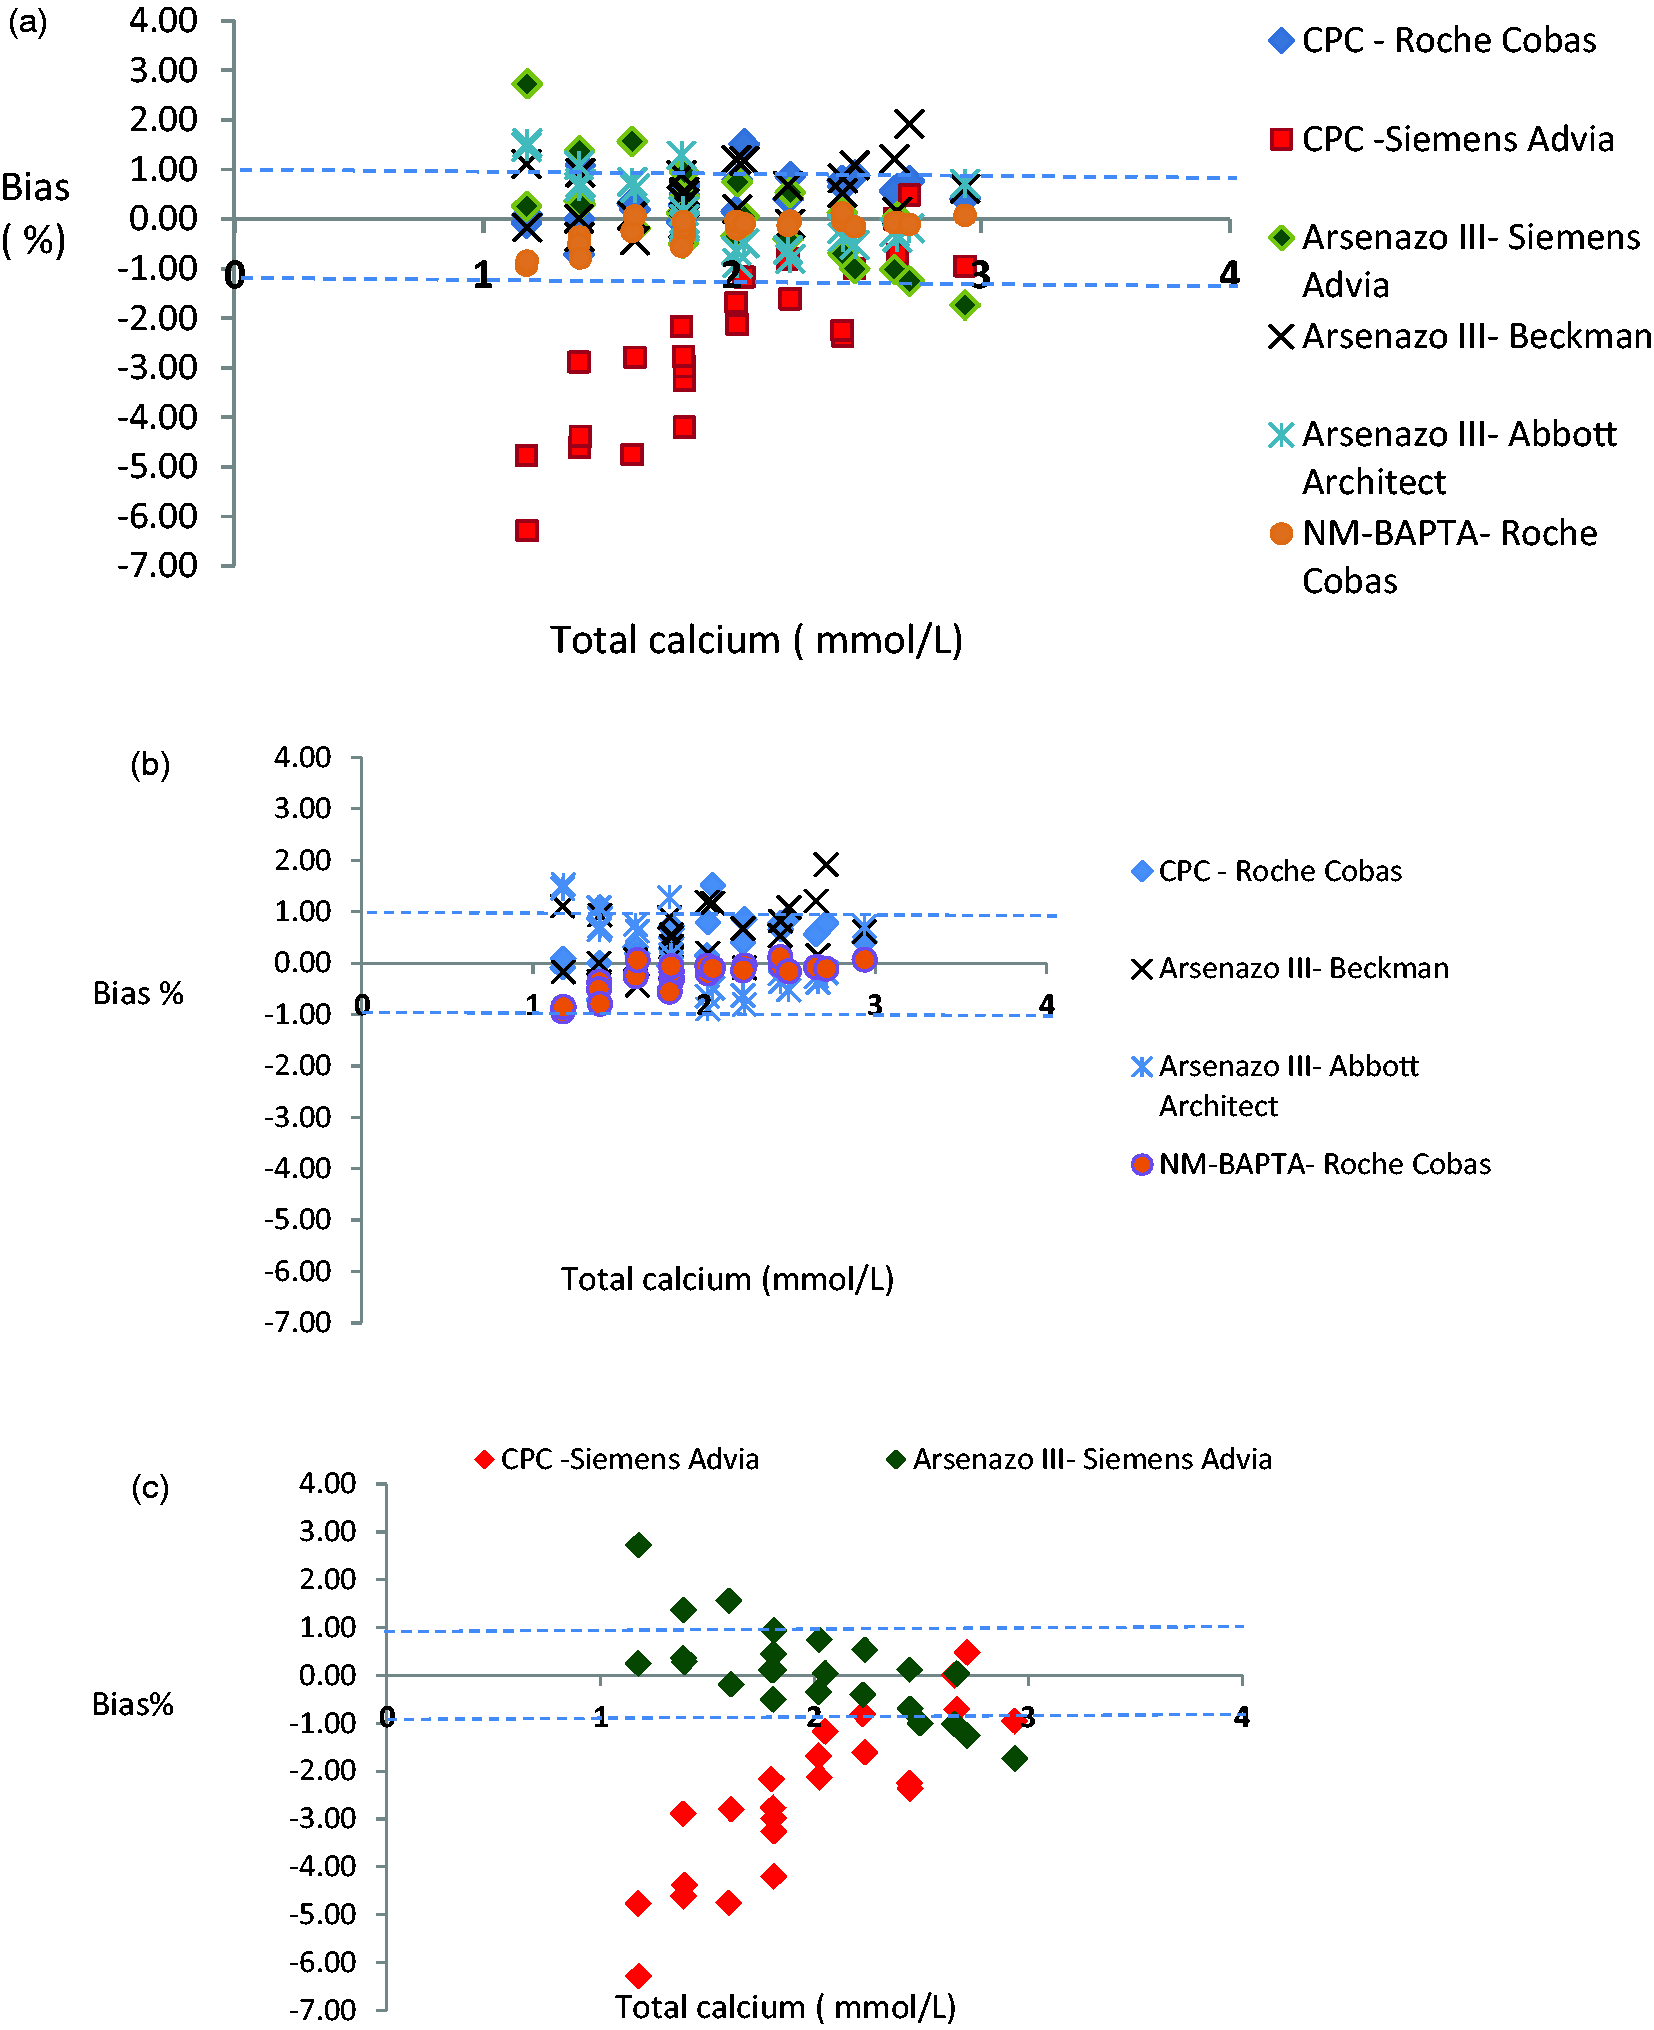
Total calcium bias plot using data from Weqas for the four serum pools distributed. (a) Total calcium bias from all participated analytical platforms and methods. (b) A sub-plot comparing the Abbott, Roche and Beckmann calcium methods and (c) a subplot comparing the two Siemens Advia calcium methods. The dashed line represents the limit for bias of ≈1% (Westgard website).
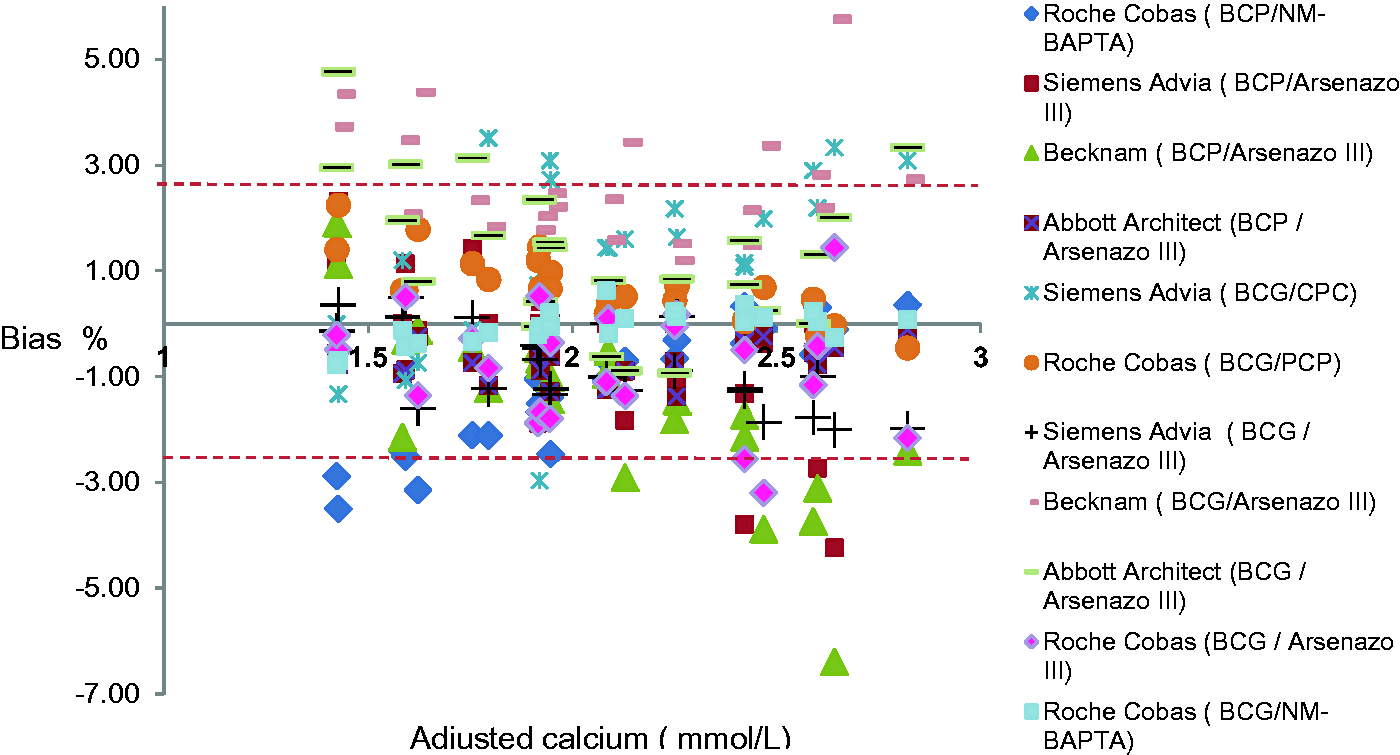
Bias plots of the adjusted calcium results obtained using Weqas data for the four serum pools distributed. The red dashed line represents the limit for bias (2.6%, Westgards Website).
A scatter plot comparing albumin BCG to BCP methods is presented in Figure 1(a). For albumin BCG methods (Figure 1(b)), all analytical platforms with the exception of Roche Cobas are negatively biased to the AMM with a bias range from –0.3% to –6.7%, which exceeds the desirable bias of 1.4% and the minimal allowable bias for albumin of 2.1%. Roche Cobas BCG method has a positive bias of 2% which is within the minimal allowable bias from biological variation. Beckman BCP method is also positively biased compared with the other BCP methods from the different analytical platforms, with a bias range from 2.7 to 5.1%. The other analytical platforms showed a concentration-dependent negative bias to the mean (range from 1 to –4.3%). The overall bias for BCP ranged from 5.1 to –4.3%, and the overall bias for BCG methods ranged from 2 to –6.7%, respectively.
The comparability of calcium concentration within the reference range was acceptable for Roche Cobas CPC and NM-BAPTA, Beckman Arsenazo III, Abbott Architect Arsenazo III, with overall bias ranges from 1.5 to –1% (Figure 2(a) and (b)) (limits from biological variation for desirable allowable bias is ≈ 1% and minimal allowable bias is 1.3%). However, Siemens calcium methods CPC and Arsenazo III appear to suffer from concentration-dependent bias, and this bias significantly worsens at the lower end of the reference limits of both assays. At calcium concentration of 2 mmol/L or below, however, the bias ranges from +3 to –6%, which exceeds even the minimal allowable limits (Figure 2(c)).
Adjusted calcium shows significant total bias of 11% (range from +5 to –6%) (Figure 3). Even with the exclusion of the Siemens Advia, the scatter of adjusted calcium results exceeds that for total calcium (Figure 2).
Discussion
The analytical performance specifications for biochemical tests was first published in 1999 and updated in 2015.1,4 The best scientific approaches follow a hierarchical order with specifications based on the impact of analytical performance on clinical outcome as the preferred model followed by those based on biological variation data and a lower order model based on the state of the art when the clinical and biological performance specifications are not available. 4 As there are no published data on the impact of analytical performance of albumin and calcium assays on clinical outcomes, the present study used analytical specifications derived from biological variation. Calcium and albumin have narrow biological variation limits; therefore, to compare various analytical platforms, a wider performance specification i.e. the minimal limits were used to define the acceptable analytical performance in this study. 2 However, for the sake of harmonization of reference interval, the desirable bias was used as the acceptable limits. 5 The desirable bias limit for albumin is 1.4%, for total calcium approximately 1% and for adjusted calcium 2.6%. The minimal bias and total error for total calcium are 1.3% and 3.6%, respectively, and for albumin are 2.1% and 6.1%, respectively. 3
In this study, the performance of all analytical platforms for calcium was acceptable except for the Siemens assays which demonstrated significant concentration-dependent bias. Apart from the Siemens data, our results compare well with a previous Norwegian study that used a fresh-frozen single donation to assess the standardization status for common analytical platforms. 6 This disparity regarding to Siemens assay performance may be related to the use of a target value calculated from AMM. It is known that this type of target value is influenced by the number of users in each platform and is less accurate than that a target value obtained from a reference method. 6 Freshly frozen ‘off the clot’ human commutable serum samples were used in both studies; however, the current study also used a dilution and ultrafiltration process to provide extended samples in the hypo and hypercalcaemic range. This may have highlighted the concentration-dependent bias. The study by Jansen et al. 7 showed a large interlaboratory variation of calcium across various analytical platforms despite the use of proven commutable samples. A very recent multinational study confirmed the findings of Jansen and reported an even wider total calcium error of up to 6.5% across a large number of different analytical platforms. 8 In view of these findings and despite total calcium assays having a well-established metrological traceability system, the authors call for an urgent optimization of routine calcium assays. The findings reported here support the need for further standardization of calcium assays to minimize bias.
The current study shows that BCG-based albumin methods can be up to 8% (or 2 g/L) positively biased compared with the BCP-based albumin methods. For BCG albumin assays, the difference between the 108 methods under review ranged from –6.7% to +2%, which is higher than the allowable desirable or even allowable minimal bias for albumin. The absolute difference among BCP albumin-based assays is similar to that seen with the BCG (which is +5.1% to –4.3%). While our data showed that Roche Cobas BCG and Beckman BCP had a positive bias of < 2% and 4%, respectively, we believe this may be misleading, as we used a target value calculated from the mean of all BCG methods to calculate the bias for albumin methods. The majority of this group were Roche Cobas users, which amount to 75% (80/108) of the total participating laboratories. Therefore, higher results from Roche Cobas BCG shifted the overall mean of all the methods, which made the rest of the analytical platforms appear negatively biased. This highlights the impact of platform numbers on the use of AMM. The same was not true for the Beckman BCP method, because there was an almost even distribution among method users.
An Australian study presented an identical BCG method bias of 2 g/L to the one reported here. 9 In support of our data, another recent study by Bachmann et al. showed that the Roche BCG method had larger mean biases when compared with BCP methods and that none of the BCG methods met the minimum analytical performance defined by the biological variation. 10 Albumin overestimation by BCG methods was found to be of clinical significance in several clinical studies.11,12
The unsatisfactory performance of albumin methods is not surprising, because unlike calcium, the reference system for albumin measurement is problematic. Although a nephelometric-based method (BCR-470) and ERM-DA470k/IFCC materials were accepted by the JCTLM as a reference measurement system for albumin, 13 albumin standardization and traceability transfer were found to require further optimization. 14 A number of issues related to albumin standardization have been identified that contributed to overall unsatisfactory albumin performance. The stock of albumin reference material (BCR-470) was exhausted by 2008, and manufacturers are expected to establish traceability to ERM-DA470k/IFCC reference material. However, some manufacturers still refer to BCR-470 reference material for establishing traceability of routine albumin assays (Roche Cobas ALB2 Gen 2 BCG, P 2/4), which makes ensuring albumin method traceability a difficult task. Even with the direct traceability to ERM-DA470k/IFCC reference material, it was found that the reference value transfer was associated with high uncertainty. 14 Reports also showed that all routine albumin assays inherently suffer from large imprecision.6,14 Poor selectivity of some albumin assays such as BCG methods adds a random variation to an already uncertain metrological system and imprecise field assays. 15 All these factors contributed to the imprecise and inaccurate methods that fail to satisfy the analytical specification needed for clinical applications. Our findings regarding albumin methods are in keeping with a large Australian study which involved circulating commutable EQA samples to participating laboratories. 16 Koerbin et al. undertook this study on behalf of the reference interval committee for the Australian Association of Clinical Chemistry (AACC). 17 On the basis of this study, the AACC has not proposed a harmonized reference interval for albumin and has recommended that laboratories should consider the use of the BCP albumin method for their routine use. 16 Furthermore, the modified BCP albumin assay, which is superior even to the current BCP albumin method, has been released but is not yet widely used. 18
With regard to the adjusted calcium equation, harmonization of total calcium methods would certainly reduce the degree of variation. Analytical variation in adjusted calcium from this study exceeds that from total calcium which reflects a further source of variation (Figure 3). This large bias is likely to represent the contribution due to the combined uncertainties of the total calcium, albumin and the large variation in the adjusted calcium equations used. In this study, the method-specific biases contributed to a variability in adjusted calcium of 0.31 mmol/L (2.47–2.79 mmol/L) for a given single serum pool. This difference is clinically unacceptable, and efforts should be focused to remove this variation.
The Weqas data demonstrated considerable variation in the way UK laboratories derive and apply adjusted calcium equations. This is due in part to a proportion of laboratories using an equation from the literature rather than using an in-house-derived equation. 19 Thus, harmonization of calcium equation derivation may contribute to minimizing variation within adjusted calcium results but is unlikely to be sufficient on its own. 20 It is clear that analytical variation in both serum calcium and serum albumin are critical in determining the regression equation.
Variability in performance characteristics of albumin and calcium assays will contribute directly to variability in regression equations. 21 Calcium method precision has significantly improved over the last three decades; however, some further work needs to be done to improve method bias, with notably most of the albumin assays failing to meet the minimum acceptable performance criteria. 15 Further optimization of the albumin methods with improved standardization of the calcium assay, along with the adoption of a more robust harmonized system to calculate the regression equations are needed to reduce the variability in adjusted calcium results.
In conclusion, in this small study, the analytical performance of albumin and calcium was assessed. The findings from this study showed that variable and unsatisfactory analytical performance may contribute directly to variation in adjusted calcium equations and invalidate the application of a harmonized reference interval for calcium and albumin.
Footnotes
Declaration of conflicting interests
The author(s) declared no potential conflicts of interest with respect to the research, authorship, and/or publication of this article.
Funding
The author(s) received no financial support for the research, authorship, and/or publication of this article.
Ethical approval
Not applicable.
Guarantor
NJ.
Contributorship
NJ planned, analysed the data and drafted the paper. AT provided the data. All authors contributed to the content and the final outcome. All authors read and agreed the final version of the article.