
Abstract
Background
Patients with chronic kidney disease often have increased plasma cardiac troponin concentration in the absence of myocardial infarction. Incidence of myocardial infarction is high in this population, and diagnosis, particularly of non ST-segment elevation myocardial infarction (NSTEMI), is challenging. Knowledge of biological variation aids understanding of serial cardiac troponin measurements and could improve interpretation in clinical practice. The National Academy of Clinical Biochemistry (NACB) recommended the use of a 20% reference change value in patients with kidney failure. The aim of this study was to calculate the biological variation of cardiac troponin I and cardiac troponin T in patients with moderate chronic kidney disease (glomerular filtration rate [GFR] 30–59 mL/min/1.73 m2).
Methods and results
Plasma samples were obtained from 20 patients (median GFR 43.0 mL/min/1.73 m2) once a week for four consecutive weeks. Cardiac troponin I (Abbott ARCHITECT® i2000SR, median 4.3 ng/L, upper 99th percentile of reference population 26.2 ng/L) and cardiac troponin T (Roche Cobas® e601, median 11.8 ng/L, upper 99th percentile of reference population 14 ng/L) were measured in duplicate using high-sensitivity assays. After outlier removal and log transformation, 18 patients’ data were subject to ANOVA, and within-subject (CVI), between-subject (CVG) and analytical (CVA) variation calculated. Variation for cardiac troponin I was 15.0%, 105.6%, 8.3%, respectively, and for cardiac troponin T 7.4%, 78.4%, 3.1%, respectively. Reference change values for increasing and decreasing troponin concentrations were +60%/–38% for cardiac troponin I and +25%/–20% for cardiac troponin T.
Conclusions
The observed reference change value for cardiac troponin T is broadly compatible with the NACB recommendation, but for cardiac troponin I, larger changes are required to define significant change. The incorporation of separate RCVs for cardiac troponin I and cardiac troponin T, and separate RCVs for rising and falling concentrations of cardiac troponin, should be considered when developing guidance for interpretation of sequential cardiac troponin measurements.
Keywords
Introduction
Chronic kidney disease (CKD) is common: 4.5% of the UK population have a glomerular filtration rate (GFR) below 60 mL/min/1.73 m2. 1 The majority of individuals with CKD have moderate disease (CKD category G3) defined by a GFR of 30 to 59 mL/min/1.73 m2. People with CKD have an increased prevalence of cardiovascular disease2,3 and an increased cardiovascular mortality risk with declining renal function.4–8 Consequently, patients with moderate CKD are more likely to die from cardiovascular complications than progress to renal failure requiring renal replacement therapy.
Diagnosis of acute myocardial infarction requires: (a) evidence of myocardial injury by observing at least one measure of cardiac troponin concentration exceeding the upper 99th percentile of a healthy reference population; (b) confirmation that such injury is acute, through observing a rise and/or fall of cardiac troponin concentration and (c) evidence of myocardial ischaemia as demonstrated by accompanying characteristic symptoms and signs of myocardial infarction (e.g. electrocardiogram changes). 9 Patients with CKD are frequently observed to have concentrations of cardiac troponin that exceed the 99th percentile in the absence of myocardial infarction.9–12 The increased plasma troponin concentration observed in CKD is most likely a reflection of the multifaceted burden of cardiovascular disease and creates a significant diagnostic problem.9,10,13–15 The diagnosis of myocardial infarction in patients with CKD can be further complicated by the absence of ischaemic symptoms and characteristic electrocardiogram changes.13,16–18 In this situation, observation of changing cardiac troponin concentration over time is a useful pointer towards myocardial infarction, although acute volume overload or heart failure may also cause this pattern. 9
There is little published data relating to the biological variation of cardiac troponin in patients with moderate CKD. Knowledge of the biological (and analytical) variation can be used to calculate reference change values (RCVs), which can be used to determine whether a change in serial measures of a biomarker are statistically significant. 19 This is pertinent to the diagnosis of acute coronary syndromes since other medical conditions, including CKD, increase cardiac troponin concentrations in the absence of myocardial infarction. Defining significant change in cardiac troponin concentration is an area of active debate. In 2007, the National Academy of Clinical Biochemistry (NACB) suggested a change of 20% should be considered significant among dialysis patients, although this recommendation predated the use of high-sensitivity cardiac troponin assays and did not consider biological variation. 20 The recent Fourth Universal Definition of Myocardial Infarction considers the difficulties of defining significant change. While a troponin concentration change >50% has been considered to exceed that which could be attributed to biological and analytical variability, smaller changes (>20%) are significant when the initial baseline value exceeds the 99th percentile of the reference population. Furthermore, there is a move towards defining change in absolute (concentration) rather than relative (percentage) terms, although it is acknowledged that such values will be assay dependent.9,21 Generally, definitions of significant change have not discriminated between cardiac troponin T (cTnT) and cardiac troponin I (cTnI). The aim of the present study was to establish the total variation (CVT), within-subject biological variation (CVI) and analytical variation (CVA) of cTnT and cTnI using high-sensitivity assays in patients with clinically stable moderate CKD in order to derive RCVs.
Study participants and methods
Patients were recruited from nephrology clinics at the Kent Kidney Care Centre, Canterbury, UK, between August 2014 and July 2015. Twenty white participants with moderate CKD were invited to participate in the biological variability substudy of the multicentre UK prospective longitudinal eGFR-C study. 22 Inclusion criteria comprised an estimated GFR between 30 and 59 mL/min/1.73 m2 sustained over at least 90 days prior to the study. GFR was estimated using the Modification of Diet in Renal Disease (MDRD) Study equation 23 and an enzymatic creatinine assay (Abbott Laboratories) standardized to the reference materials NIST SRM 967 and 914. Exclusion criteria were age <18 years, pregnancy, breastfeeding, an episode of acute kidney injury within the last six months, known current alcohol or drug abuse, amputee (whole or part-limb), kidney transplant recipient and cognitive impairment. Patients provided written informed consent. The study had ethical approval (South-East Coast Research Ethics Committee, reference 11/LO/1304). The study conforms to the internationally agreed checklist for the reporting of studies of biological variation. 24
Blood was collected into ethylenediaminetetraacetic acid (EDTA) (Vacuette®, Greiner Bio-One International) tubes using standard venepuncture procedures. Samples were obtained once a week for four consecutive weeks with standardization to the same time of day (morning) and day of the week to minimize preanalytical variables. Samples were centrifuged within 6 h of venepuncture and plasma pipetted into 2 mL microtubes (Sarstedt). Plasma was stored at –80°C for approximately 24 months before cardiac troponins were measured in a single batch.
Cardiac troponins were measured in duplicate using two high-sensitivity assays. On the morning of analysis, samples were thawed at room temperature and mixed by inversion. Immediately prior to analysis, samples were centrifuged at 3300 g for 10 min. Plasma cTnI was measured using the ARCHITECT® STAT high-sensitivity cTnI chemiluminescent microparticle immunoassay (Abbott Laboratories, Chicago, IL, USA, product code 3P25) assay (upper 99th percentile of a healthy reference population: female [15.6 ng/L], male [34.2 ng/L], combined [26.2 ng/L]) on the Abbott ARCHITECT® i2000SR module. Plasma cTnT was measured using the Elecsys® high-sensitivity cTnT electrochemiluminescent sandwich immunoassay on the Roche Cobas® e601 (Roche Diagnostics, Risch-Rotkreuz, Switzerland) analyser platform (upper 99th percentile of a healthy reference population 14 ng/L). The measurement of both cardiac troponins was undertaken on the same day by a single operator using one instrument that had been calibrated using a single batch of standards, reagents and quality controls. The samples for each patient were analysed in duplicate in random order to minimize any effects of assay drift.
Data analysis
Samples with measures below the limit of detection for either the cTnI assay (≤1.2 ng/L) or the cTnT assay (≤5 ng/L) were excluded. Normality was assessed using the Shapiro-Wilk test (Analyse-it Software Ltd, Leeds, UK) which showed a non-Gaussian distribution. The data were therefore log-transformed using a natural logarithm as recommended.24,25 For both cardiac troponins, Cochran’s test identified two values that differed markedly between duplicate measures and one value that differed markedly between the series of replicate measures; these were therefore removed. Where one duplicate of a sample was excluded (or absent), both duplicate results were excluded from statistical analysis.
26
The data-set of each patient was then subject to outlier removal by Reed’s test; no subjects were excluded based on this test. The data-set belonging to any patient with less than three (out of four) duplicate cardiac troponin measures available were completely excluded from statistical analysis. On this basis, a total of three patients were excluded; one individual was excluded from all analysis; one individual was excluded from cTnI analysis only and one individual was excluded from cTnT analysis only. Details of excluded measures are shown in supplementary Table S1. The log-transformed data from 18 patients were subject to ANOVA (Minitab Statistical Software, Minitab Ltd, Coventry, UK) and estimates of biological variation were generated for CVT, CVA and CVI. Data were then back-transformed allowing derivation of the exact CV values
Results
Characteristics of the study participants are shown in Table 1. Three patients had type 2 diabetes mellitus, seven ischaemic heart disease, one angina and two had heart failure. One participant was a current smoker and 10 were ex-smokers. Antihypertensive and cholesterol-reducing drugs were being taken by 15 and 13 patients, respectively. Seven of the participants had urine albumin concentrations between 3 and 30 mg/mmol creatinine, and a further four had urine albumin concentrations >30 mg/mmol. No participants had a significant change in kidney function during the study nor an acute cardiac event. 30
Characteristics of the study population.
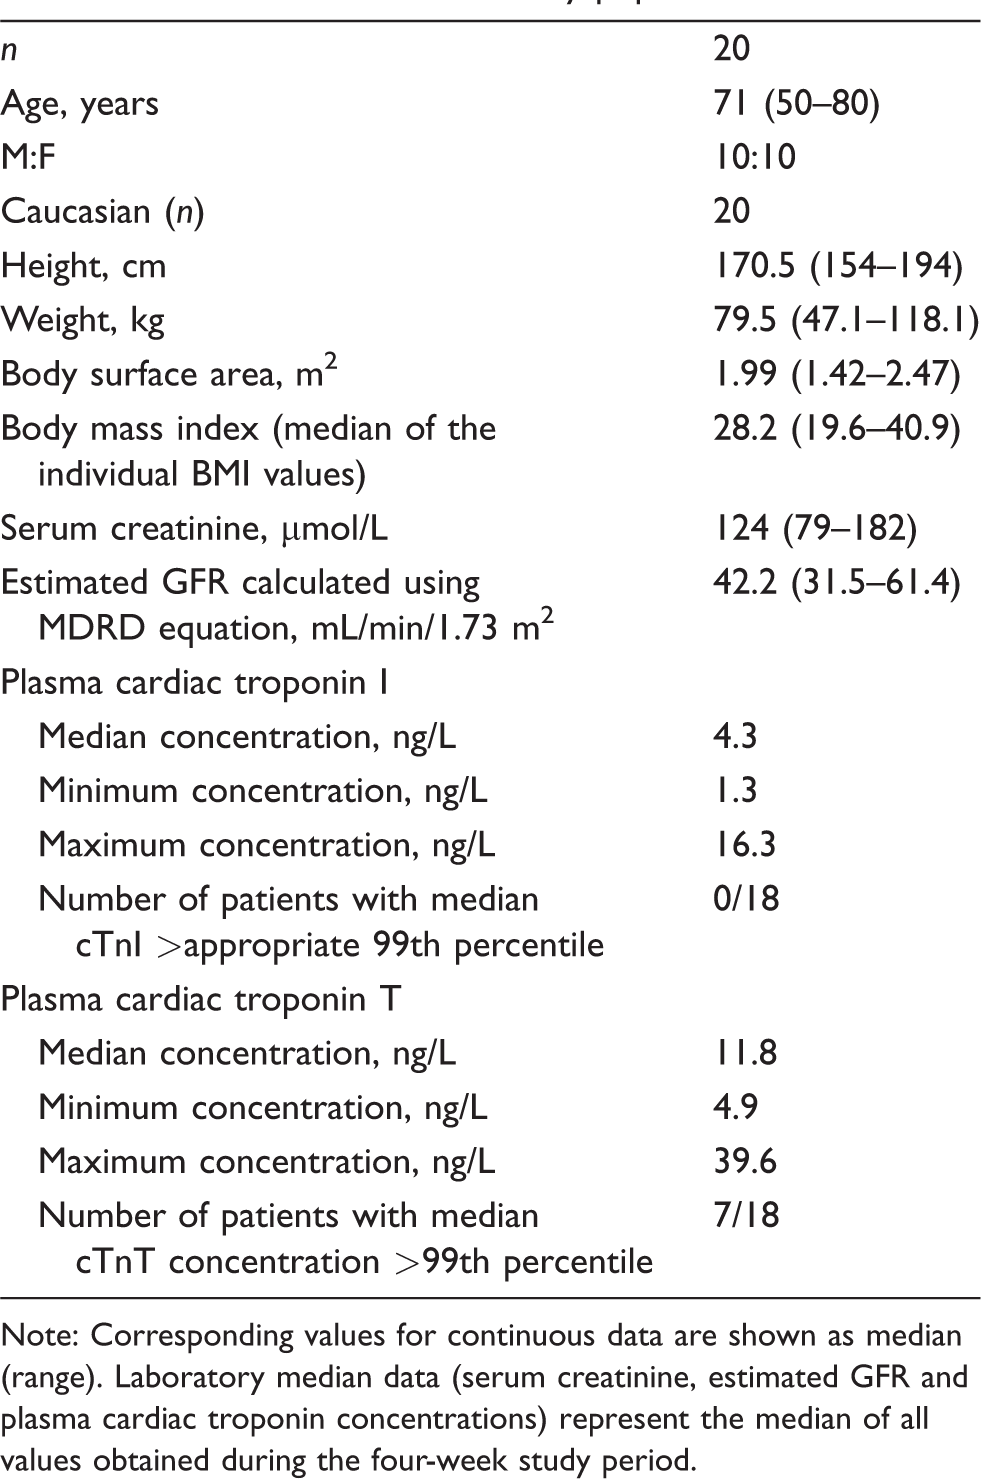
Note: Corresponding values for continuous data are shown as median (range). Laboratory median data (serum creatinine, estimated GFR and plasma cardiac troponin concentrations) represent the median of all values obtained during the four-week study period.
The median concentration overall (all patients, all study points) of both cardiac troponins was below the relative 99th percentile derived from a healthy reference population. For cTnT, the median cTnT concentration of seven patients exceeded the 99th percentile (Figure 1(a)), whereas for cTnI, no individual patient had a median concentration over all study points exceeding the 99th percentile (Figure 1(b)). The highest median concentration of cTnT observed in an individual was 37.6 ng/L, whereas the highest median value for an individual for cTnI was 13.7 ng/L.
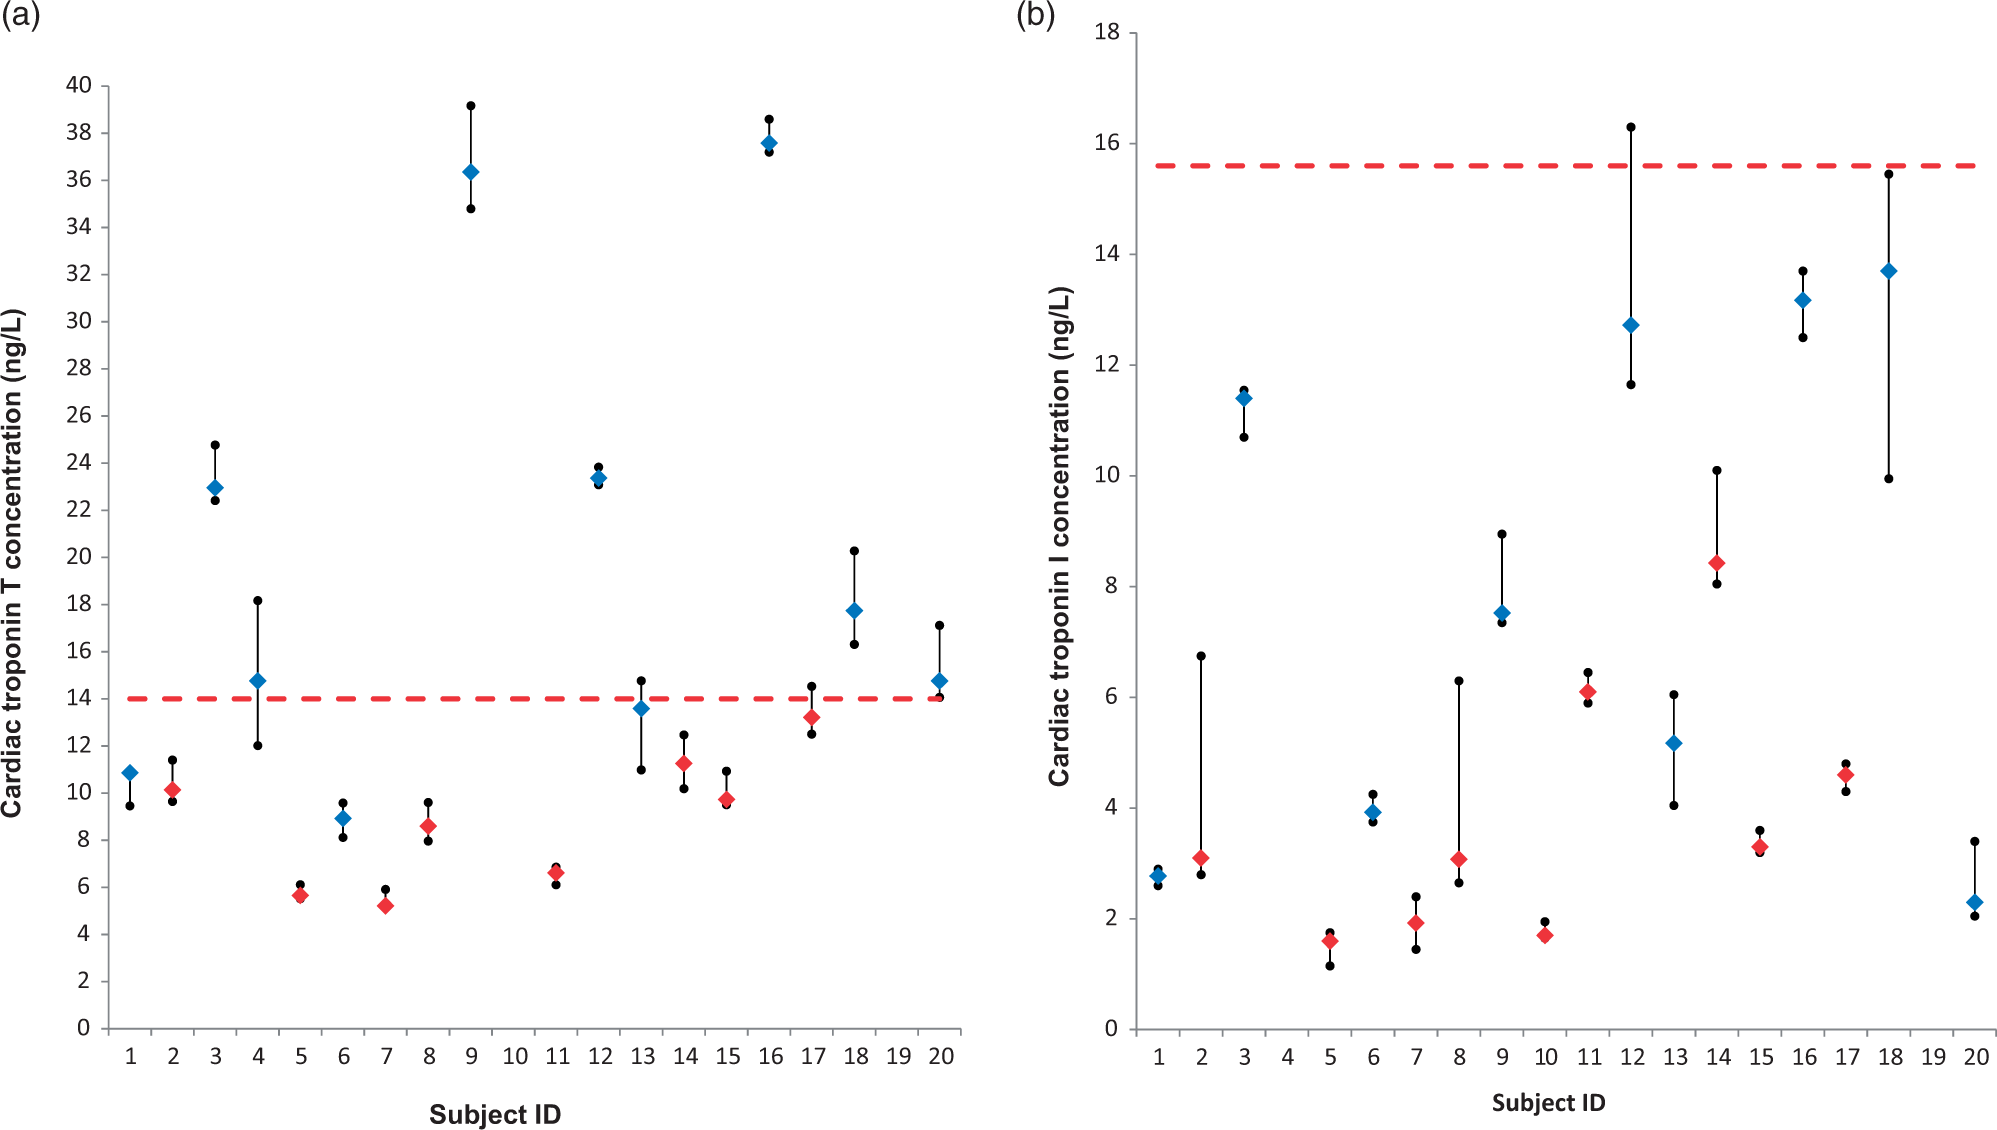
Plots depicting the biological variation of cardiac troponins T (a) and I (b) in 18 patients (minus exclusions) with moderate CKD sampled over a period of four weeks. Diamonds represent the individual patient medians with the filled circles representing individual minimum and maximum values. Males and females are depicted by blue and red diamonds, respectively. For cardiac troponin T, the horizontal dashed line represents the upper 99th percentile of a healthy reference population. In the case of cardiac troponin I, the horizontal dashed line represents the 99th percentile for females (15.6 ng/L), with males having a higher 99th percentile (34.2 ng/L, not shown).
Biological and analytical variation data are shown in Table 2. The within-subject and analytical variability of cTnT was approximately half that of cTnI. Consequently, the positive and negative RCVs were lower for cTnT (25%/–20%) than for cTnI (60%/–38%).
Summary of the components of variation of cardiac troponin I and T.
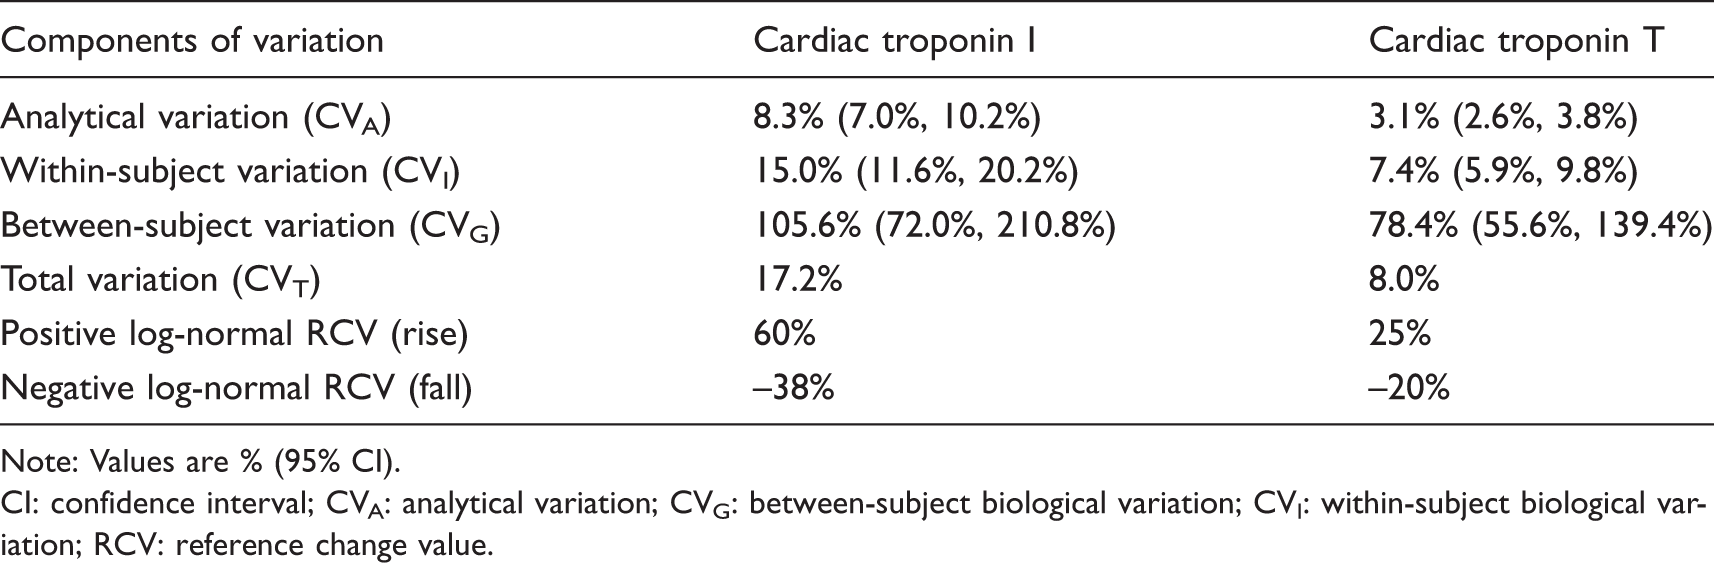
Note: Values are % (95% CI).
CI: confidence interval; CVA: analytical variation; CVG: between-subject biological variation; CVI: within-subject biological variation; RCV: reference change value.
Discussion
Defining a statistically significant change in serial troponin concentrations should be established from biological variability studies. 31 There is a literature describing the biological variation of cardiac troponins in patients with kidney failure treated by dialysis but, to the best of our knowledge, this is the first study to report the biological variation of both cTnT and cTnI measured using high-sensitivity assays in patients with moderate CKD. We observed within-subject biological variation of 7.4% (CI 5.9% to 9.8%) and 15.0% (CI 11.6% to 20.2%) for cTnT and cTnI, respectively. RCVs for increasing and decreasing troponin concentrations were +25%/–20% for cTnT and +60%/–38% for cTnI.
The estimates of within-subject biological variation for cardiac troponin reported in the present study are similar to those previously reported in patients undergoing haemodialysis. For example, Fahim et al. reported a CVI for cTnT of 7.9% in dialysis patients. 32 Among studies that simultaneously measured both cTnI and cTnT,33,34 including the present study, the within-subject variability has been consistently lower for cTnT than for cTnI. In patients with renal failure undergoing haemodialysis treatment Mbagaya et al. reported slightly higher CVI values compared with the present study for cTnT and cTnI of 10.5% and 20.2%, respectively. 34 Aakre et al. estimated the CVI of cardiac troponins among stable haemodialysis patients and reported values of 8.3% and 14.3% for cTnT and cTnI, respectively. In the same study, CVI values among healthy individuals of 8.3% (cTnT) and 14.3% (cTnI) were reported. 33 Corte et al. observed within-subject biological variation for cTnT of 14.7% among patients with kidney failure compared with 5.9% among healthy individuals, although the study design was somewhat different between the two groups. 35 Among patients with CKD not receiving dialysis (median estimated GFR 17 mL/min/1.73 m2), within-day biological variability for cTnI of 8% to 9% has been reported. 36 Overall, the reported variability appears comparable between studies including haemodialysis patients, CKD patients and healthy individuals.
When considering any change in a patient’s results, health-care practitioners need to be able to distinguish true change (‘signal’) from the ‘noise’ of variability. In clinical practice, biological variation is best considered in terms of the RCV, which takes both biological and analytical variation into account. RCVs for cTnT in the present study (25%/–20%) are generally comparable to those previously reported in dialysis patients: 33%/–25%, 32 26%/–21% 33 and 34%/–26%. 34 The RCVs for cTnT reported in the present study are also broadly compatible with the NACB’s definition of a significant change of 20%. 20
For cTnI, however, our data suggest that a larger difference (60%/–38%) is required to define significant change. Similarly, reported RCVs for cTnI among dialysis patients were 53%/–35% 33 and 80%/–44%, 34 and among CKD patients not receiving dialysis 34%/–26%. 36 The reported positive and negative RCV values therefore consistently exceed the 20% critical difference recommended by the NACB, in some cases by several fold, and would stretch the critical relative differences discussed within the Fourth Universal Definition of Myocardial Infarction.9,20 The use of a 20% critical difference to interpret serial measures of cTnI could contribute to misleading diagnoses of acute myocardial infarction in patients with moderate CKD. It is also clear that the data do not have a symmetric distribution, i.e. the same critical difference cannot be applied to rising and falling troponin concentrations. Our data and that of others,33,34,36 particularly for cTnI, demonstrate that the biological variation of troponin concentration is non-Gaussian and that RCVs will differ between rising and falling concentrations. Similarly, should absolute, as opposed to relative, delta values be used to detect change, as has been suggested, the same issue will pertain regarding different rising and falling troponin concentrations. 9
As previously reported, particularly among dialysis patients,32–34 but also in earlier studies of non-dialysis CKD patients,10,11 cTnT is more commonly increased above the 99th percentile than cTnI. The reason for this is not the main focus of the present study, but various explanations have been proposed including different cTnI and cTnT release kinetics or differences in clearance from the circulation. This observation is reinforced by the present study with concentrations of cTnT commonly exceeding the 99th percentile reference interval, while cTnI concentrations were predominantly normal.
The study was adequately powered based on essential elements of the study design (number of individuals, samples and replicates). 28 In relation to analytical performance specifications defined by the ratio of CVA to CVI, the cTnT (0.4) and cTnI (0.5) assays met desirable and minimum quality specifications, respectively. 26 The study followed a strict design to minimize preanalytical and analytical variation and investigator bias. 24 Outliers in the data were excluded using a formal exclusion protocol, and a strength of this study is that few data were excluded prior to ANOVA. Estimation of components of variation was derived using a nested ANOVA approach, which takes into account analytical variation for estimation of within-subject biological variation. The participants were derived from a patient group which is a major population in which detection of myocardial infarction is a clinically relevant issue. Participants had stable kidney disease, suggesting that the variation we have reported is physiological and not pathological in nature. The methods used to measure cTnT and cTnI met criteria for the definition of high-sensitivity assays31,37 and are recommended by the National Institute for Health and Care Excellence for the early rule out of myocardial infarction. 38
Our study has some limitations. The cohort studied was recruited from a single centre and was exclusively Caucasian: biological variability estimates may therefore not be transferable to other ethnic groups. Our study comprised participants with moderate CKD and the results may not be transferable to more advanced kidney disease. However, as discussed above, comparison with other studies of patients receiving dialysis for kidney failure suggests similar levels of biological variability.32–34 The RCV is a value derived under idealized conditions which are often not replicated in typical clinical practice (e.g. multiple operators and batches of reagents will increase the value of CVA and hence increase the RCV). Furthermore, sampling time was standardized to some extent in our study. In the clinical setting, change in cTnT concentrations will also be influenced by the known circadian variation, with peak concentrations occurring in the early morning and a nadir in the evening.39,40 RCVs should therefore be considered a minimum clinically significant change. Individual laboratories may need to adjust RCVs to take into account the analytical variation of their own troponin assay. However, the values generated in this study are useful to guide understanding of change in cardiac troponin concentration in patients among whom interpretation can often be challenging. Although the recommended approach, the outlier removal process may inadvertently remove values representing true biological variation, albeit, as noted above, relatively few outliers were removed in this study. Myocardial infarction was not a measured outcome in this cohort of CKD patients. However, in a renal dialysis population, Aakre et al. demonstrated successful use of the RCV to identify patients with acute cardiac events. 33 Serial changes in concentration of cTnT exceeded the RCV in all four patients who experienced cardiac events and in three of four patients for cTnI. 33 Finally, our samples were stored for up to two years at –80°C prior to analysis. We are unaware of published data supporting storage over this period. However, Egger et al. report good stability over one year at –80°C for both cTnI and cTnT in EDTA plasma, including through two freeze–thaw cycles, measured using the Abbott and Roche assays, respectively, suggesting good stability of these markers. 41
A further consideration is the timescale over which variability is studied to generate the RCV. We have used samples obtained at weekly intervals. Variability over shorter periods of time may be more relevant when addressing the issue of diagnosis of myocardial infarction. Among healthy volunteers, for both cTnT and cTnI, within-subject biological variability does seem to be higher when studies are conducted over periods of days/weeks compared with studies of within-day (hourly) variability.33,42,43 Literature on this point is less clear among patients with kidney disease. Aakre et al. studied variability in haemodialysis patients and observed lower within-subject variability when troponins were studied at 90 min intervals over 6 h (cTnT 1.9% and cTnI 3.3%). 33 Conversely, estimates of CVI for cTnI obtained by van der Linden et al. from hourly measurements over 24 h in patients with and without CKD were 8.7% and 9.4%, respectively, closer to the results we report in the present study. 36 These authors observed that the CVI did not differ significantly irrespective of whether hourly, 3-hourly or 6-hourly sampling intervals were considered. 36
In conclusion, we describe the biological variability of cTnT and cTnI in a carefully designed study using high-sensitivity assays in patients with moderate CKD. Our data suggest that independent RCVs for cTnI and cTnT should be incorporated into guidance for the interpretation of cardiac troponin in patients with CKD. Furthermore, we recommend that separate positive and negative RCVs should be considered, particularly for cTnI. While not the focus of our study, the same considerations would apply to the use of absolute concentration changes. Research should continue to elucidate reasons for the observed difference in prevalence of increased concentrations of cTnT compared with cTnI in relation to the respective 99th percentile of a healthy reference population, and of the difference in biological variability between the two troponins, which cannot currently be explained.
Supplemental Material
ACB906431 Supplemental Material - Supplemental material for Biological variation of cardiac troponins in chronic kidney disease
Supplemental material, ACB906431 Supplemental Material for Biological variation of cardiac troponins in chronic kidney disease by RA Jones, J Barratt, EA Brettell, P Cockwell, RN Dalton, JJ Deeks, G Eaglestone, T Pellatt-Higgins, PA Kalra, K Khunti, FS Morris, RS Ottridge, AJ Sitch, PE Stevens, CC Sharpe, AJ Sutton, MW Taal, EJ Lamb and on behalf of the eGFR-C Study Group in Annals of Clinical Biochemistry
Footnotes
Acknowledgements
We are grateful to the pathology staff at the Pembury Hospital, Pembury, Kent UK for assistance with the cTnT measurements. We acknowledge Birmingham Clinical Trials Unit for trial coordination and data management, and the Research Governance teams at the University of Birmingham and East Kent University Hospitals NHS Foundation Trust for research governance and Sponsor duties.
Declaration of conflicting interests
The author(s) declared no potential conflicts of interest with respect to the research, authorship, and/or publication of this article.
Funding
The author(s) disclosed receipt of the following financial support for the research, authorship, and/or publication of this article: The eGFR-C study is funded by the National Institute for Health Research (NIHR) Health Technology Assessment Programme 11/13/01. The views expressed are those of the authors and not necessarily those of the NIHR or the Department of Health and Social Care. AS and JJD are supported by the NIHR Birmingham Biomedical Research Centre at the University Hospitals Birmingham NHS Foundation Trust and the University of Birmingham.
Ethical approval
Guarantor
EJL.
Contributorship
All authors contributed to the design, analysis and production of the article. Laboratory work was undertaken by RAJ.
Supplemental material
Supplemental material for this article is available online.
References
Supplementary Material
Please find the following supplemental material available below.
For Open Access articles published under a Creative Commons License, all supplemental material carries the same license as the article it is associated with.
For non-Open Access articles published, all supplemental material carries a non-exclusive license, and permission requests for re-use of supplemental material or any part of supplemental material shall be sent directly to the copyright owner as specified in the copyright notice associated with the article.