
Abstract
Background
Serum cardiac troponin T concentrations are important predictors of cardiovascular and all-cause mortality in end-stage renal disease. In patients with end-stage renal disease, assessment of serial results is essential to distinguish between a cardiovascular event and chronic elevation. We employed a high-sensitivity serum cardiac troponin T assay to evaluate the long-term biological variation in end-stage renal disease patients and in healthy individuals; these biological variation data were used to define the reference change value and the analytical goals.
Methods
Serum samples were collected from 18 end-stage renal disease patients in steady-state conditions, one per month for 6 months, and from 11 healthy volunteers at weekly intervals over 5 weeks. Biological variation data were derived using analysis of variance.
Results
Baseline serum cardiac troponin T concentrations in end-stage renal disease patients were above the 99th percentile of the healthy population and increased with duration of haemodialysis. For end-stage renal disease patients, within-subject (CVI) and between-subject (CVG) coefficients of variation were 14.7 and 77.8%, respectively, whereas these were 5.9 and 30.4%, respectively, for healthy individuals. The derived two-tailed and one-tailed reference change values were 44.1 and 37.1%, respectively, for end-stage renal disease patients, and 21.6 and 18.2% for healthy subjects.
Conclusions
For appropriate clinical management of end-stage renal disease patients in the context of a cardiovascular event, regular monitoring of serum cardiac troponin T concentrations could be important in order to allow future comparison through reference change value. Biological variation data in end-stage renal disease patients were significantly higher than for healthy individuals; therefore, the use of proper reference change value data is recommended. Moreover, the observed CVI values provide demanding imprecision goals for current technology.
Keywords
Introduction
Cardiovascular complications are the most important cause of morbidity and mortality in patients with end-stage renal disease (ESRD).1,2 The reported mortality rate is 10 times higher in ESRD patients undergoing chronic haemodialysis (HD) therapy than in the general population. 3 Therefore, the diagnosis and risk stratification of cardiovascular events are key issues in the clinical management of these patients. More than 10 years ago, elevations of serum cardiac troponin (S-cTn) concentrations were reported in ESRD patients,4,5 although some of these increases occurred without evidence of cardiac damage or clinical symptoms,6,7 and no correlations were observed with serum creatinine concentrations. 8 Nevertheless, high S-cTn concentrations have their own clinical relevance, since they have been proven to be important predictors of long-term, cardiovascular and all-cause mortality in ESRD patients.9,10
According to a recent update of the universal definition of acute myocardial infarction (AMI), 11 the diagnosis of AMI requires the detection of an increase in cardiac biomarkers, preferably cardiac troponin I (S-cTnI) or T (S-cTnT), with at least one concentration above the 99th percentile limit of a healthy population, along with clinical or electrocardiographic findings of acute myocardial ischaemia. This discriminatory limit has to be measured with less than 10% imprecision.11,12 The new high-sensitivity (hs) serum troponin assays (hs-S-cTnI and hs-S-cTnT) are able to quantify concentrations of S-cTn in the low ng/L range and have allowed the concentrations for the 99th percentile cut-off to be established with optimal imprecision.13,14
However, this higher sensitivity has been associated with an increase in the number of abnormal S-cTn concentrations observed in various chronic conditions with cardiac involvement, such as ESRD, which continues to hinder the diagnosis of AMI in these patients. Guidelines endorsed by the National Academy of Clinical Chemistry, the American College of Cardiology, the European Society of Cardiology and the American Heart Association have addressed this issue 15 and, for patients with chronically elevated S-cTn concentrations, a 20% change from the baseline concentration 6–9 h after the onset of clinical symptoms has been recommended as indicative of AMI. This limit was based on three times the analytical imprecision described for most S-cTn assays in the concentration range observed in AMI and not on the biological variation (BV) of the cTn.
BV has been defined as the inherent random variation in analyte concentration due to the physiological balance between metabolic turnover and homeostatic regulation. Two components, termed within-subject BV, which is described as the average random fluctuation around a homeostatic set-point, and between-subject BV, defined as the difference between the set-points of individuals, have been distinguished.16,17 In mathematical terms, these data are expressed as coefficients of variation (CV): CVI and CVG, respectively. Quantitative BV data have been used for several purposes, including assessing the utility of population-based reference intervals through the index of individuality (II) 18 and calculating the reference change value (RCV) required for assessment of the significance of changes in serial results from an individual. 19 Likewise, it has been suggested that desirable analytical quality specifications are best based on BV components. 20
It is common practice to use RCV estimated from healthy individuals in monitoring the clinical course of patients in order to discriminate significant changes in serial analytical results. However, underlying pathology may alter both the analyte homeostatic set-point and the variation around that set-point; therefore, the use of RCV derived from healthy individuals may not be suitable for monitoring patients with chronic advanced disease. Accordingly, an increasing number of studies of BV for biochemical markers in different pathological conditions have been published. 21 Of note is the fact that despite the potential advantages of the use of RCV in the evaluation of S-cTn changes, the assessment of BV in healthy individuals has not been possible until the development of the hs assays. Recently, several studies have been published on the BV for these markers in healthy individuals22–25 and in patients with stable coronary artery disease; 26 however, no specifically designed studies on BV have been reported for ESRD patients.
In the present study, we used a new hs-S-cTnT assay to obtain BV data in both ESRD patients and healthy individuals in long-term steady-state conditions. These data have been used to assess the II, the RCV and to define analytical quality specifications for imprecision (I), bias (B) and total error (TE).
Material and methods
Subjects
To estimate S-cTnT BV data in ESRD, a cohort of 20 patients undergoing chronic conventional HD three times a week at the Service of Nephrology of San Agustin Hospital (Avilés, Asturias, Spain) was selected. The study inclusion criteria were: age <75 years old, no history of cardiovascular events, no hospital admissions during the study period or in the previous 3 months, no significant variations in biochemical monitoring during the same periods and stable dry weights throughout the scheduled HD programme. During the follow-up period, two patients were hospitalized due to pneumonia and unexplained fever; therefore, they were removed from the study, leaving 18 subjects (11 females and seven males; age range, 31–75 years).
For comparison, samples from 11 apparently healthy volunteers (eight females and three males; age range, 21–50 years), recruited for a previous BV study, were used for the estimation of S-cTnT BV data in healthy individuals. None of the subjects had a history of cardiovascular disease, renal disease or any other condition known to affect troponin concentrations.
The study was approved by the institutional review board and the design and execution of the experiment were explained thoroughly to the participants, and informed consent was obtained.
Specimen collection
All samples were collected in plain tubes (Vacuette, Greiner Bio-one, Madrid, Spain) by conventional venepuncture after an overnight fast, with subjects in a sitting position and avoiding venous stasis. Samples from ESRD patients were collected once a month, before the HD treatment. An average of five samples per patient was obtained during a study period of 6 months. Specimens from each healthy volunteer were obtained once a week for 5 weeks at the same time of day (8:30–10:00), under standardized conditions to minimize sources of preanalytical variation. All serum specimens from both healthy individuals and patients were allowed to clot for 30 min at room temperature, centrifuged at 3500 g for 10 min, aliquoted and stored at −80℃ for a maximum of 11 months before analysis; this temperature has been shown to maintain S-cTnT in a stable state for up to 12 months. 27
Analytical methods
Measurements of S-cTnT concentrations were performed with the ECLIA Short Turn Around Time hs-S-cTnT assay in a Cobas e411 analytical system (Roche Diagnostics, Barcelona, Spain) according to the manufacturer’s specifications. The limit of blank (LoB) and the limit of detection were determined as 3 and 5 ng/L, respectively, and the 99th percentile concentration for healthy individuals was 14 ng/L. 13 Routine internal quality controls at two concentrations (26 and 1920 ng/L) were processed to assess method performance. The assay was also evaluated on a regular basis through participation in a national external quality assessment scheme.
Before analysis, all samples were thawed at room temperature and mixed to ensure homogeneity. To remove interbatch analytical variation, all samples from the same group, whether healthy individuals or ESRD patients, were assayed in the same batch. To calculate intrabatch analytical variation, the first sample collected from each subject was analysed in duplicate (thus intrabatch analytical variation has been calculated in the subject’s samples matrix). Single lots of reagents and calibrators were employed, and the whole procedure was performed by a single analyst to minimize the analytical variation.
Statistical analysis
The statistical analysis was carried out with SPSS software (15.0 for Windows, SPSS Inc., Chicago, IL). The Levene test was used to confirm the homogeneity of variances. Normal distribution was assessed in both the overall data-set and each individual data-set by the Shapiro–Wilk test and by verification of the straightness of a normal plot; S-cTnT concentrations in both healthy subjects and ESRD patients showed a non-Gaussian distribution. Kruskal–Wallis and Mann–Whitney test were used for median comparisons, as appropriate, and p < 0.05 was considered statistically significant. Logarithmic transformations were performed before applying the Cochran test to exclude outlying values from the individual subjects (within-subjects data) and the Reed test to eliminate mean outlying values (between-subjects data).
Overall, the S-cTnT concentrations were not normally distributed, while individual data-sets from each subject showed normal distribution. In these situations, Fraser and Harris 16 have discouraged the use of logarithmic transformations of data to calculate BV components.
Analytical variance (SDA2) was calculated from the differences between the duplicates according to the formula: SDA2 = Σd2/2N, where d is the difference between duplicates and N is the number of duplicates. The SDA2 is expressed as relative SDA to the mean of duplicates (CVA). One-way analysis of variance was applied to divide the total variance into between-subjects (SDG2) variance and total within-subjects variance (SDTI2). Since SDTI2 includes both biological and analytical components, the within-subjects variance (SDI2) was obtained by subtraction, using the formula: SDI2 = SDTI2–SDA2. Within- and between-subjects BV was expressed as CV by the use of the homeostatic mean of each individual (CVI) and the overall mean (CVG), respectively. The 95% confidence intervals (95% CI) for CV were calculated according to the formula from Miller. 28
BV data for S-cTnT in both healthy individuals and ESRD patients were used to calculate the desirable analytical quality specifications as I = 0.5CVI, B = 0.25(CVI2 + CVG2)1/2, TE = 1.65(0.5CVI) + 0.25(CVI2 + CVG2)1/2 and II as II = (CVI2 + CVA2)1/2/CVG. RCV was calculated as the probability of a rise or a fall (one-tailed; Z-score = 1.65) and as the probability of a change (two-tailed; Z-score = 1.96) at p < 0.05 as RCV = 21/2*Z(CVA2 + CVI2)1/2. Because the global distribution of S-cTnT data was slightly skewed, RCVs were also evaluated with the lognormal approach that was first described in equations formulated by Fokkema et al., 29 who used the total intraindividual coefficient of variation (CVTI) of non-log-transformed data to estimate the σ parameter of the lognormal distribution. The asymmetrical limits for the upward value for the lognormal RCV (RCVpos) and for the downward value (RCVneg) were determined as follows: RCVpos = [exp(Z × 21/2 × σ)–1] × 100, and RCVneg = [exp(–Z × 21/2 × σ)–1] × 100.
Results
The distribution of S-cTnT results for long-term BV in ESRD patients and healthy individuals is shown in Figure 1. Four ESRD patients showed median S-cTnT concentrations significantly higher (p < 0.05). None of these patients had a medical history of hypertension, arteriosclerosis or echocardiographic findings, and no large differences in body mass index, mean concentration of serum C reactive protein, medication or in the aetiology of ESRD were found. Two of them had higher mean concentrations of serum triglycerides (45%), cholesterol (30%) or low density lipoprotein cholesterol (30%) than the other patients during the follow-up period. Observed cTnT concentrations were above the assay LoB, except for one sample from a healthy subject, which was identified as an outlier and removed from the study. All data from healthy individuals were below the 99th percentile limit of 14 ng/L, while the 98% cTnT concentrations from ESRD patients were above this clinical decision-making point.
Serum cardiac troponin T (S-cTnT) concentrations. Data are presented as median concentrations. (a) Biological variation results for ESRD patients in 18 subjects over a 6-month period. (b) Biological variation results for healthy individuals in 11 subjects over a 5-week period. M: Male.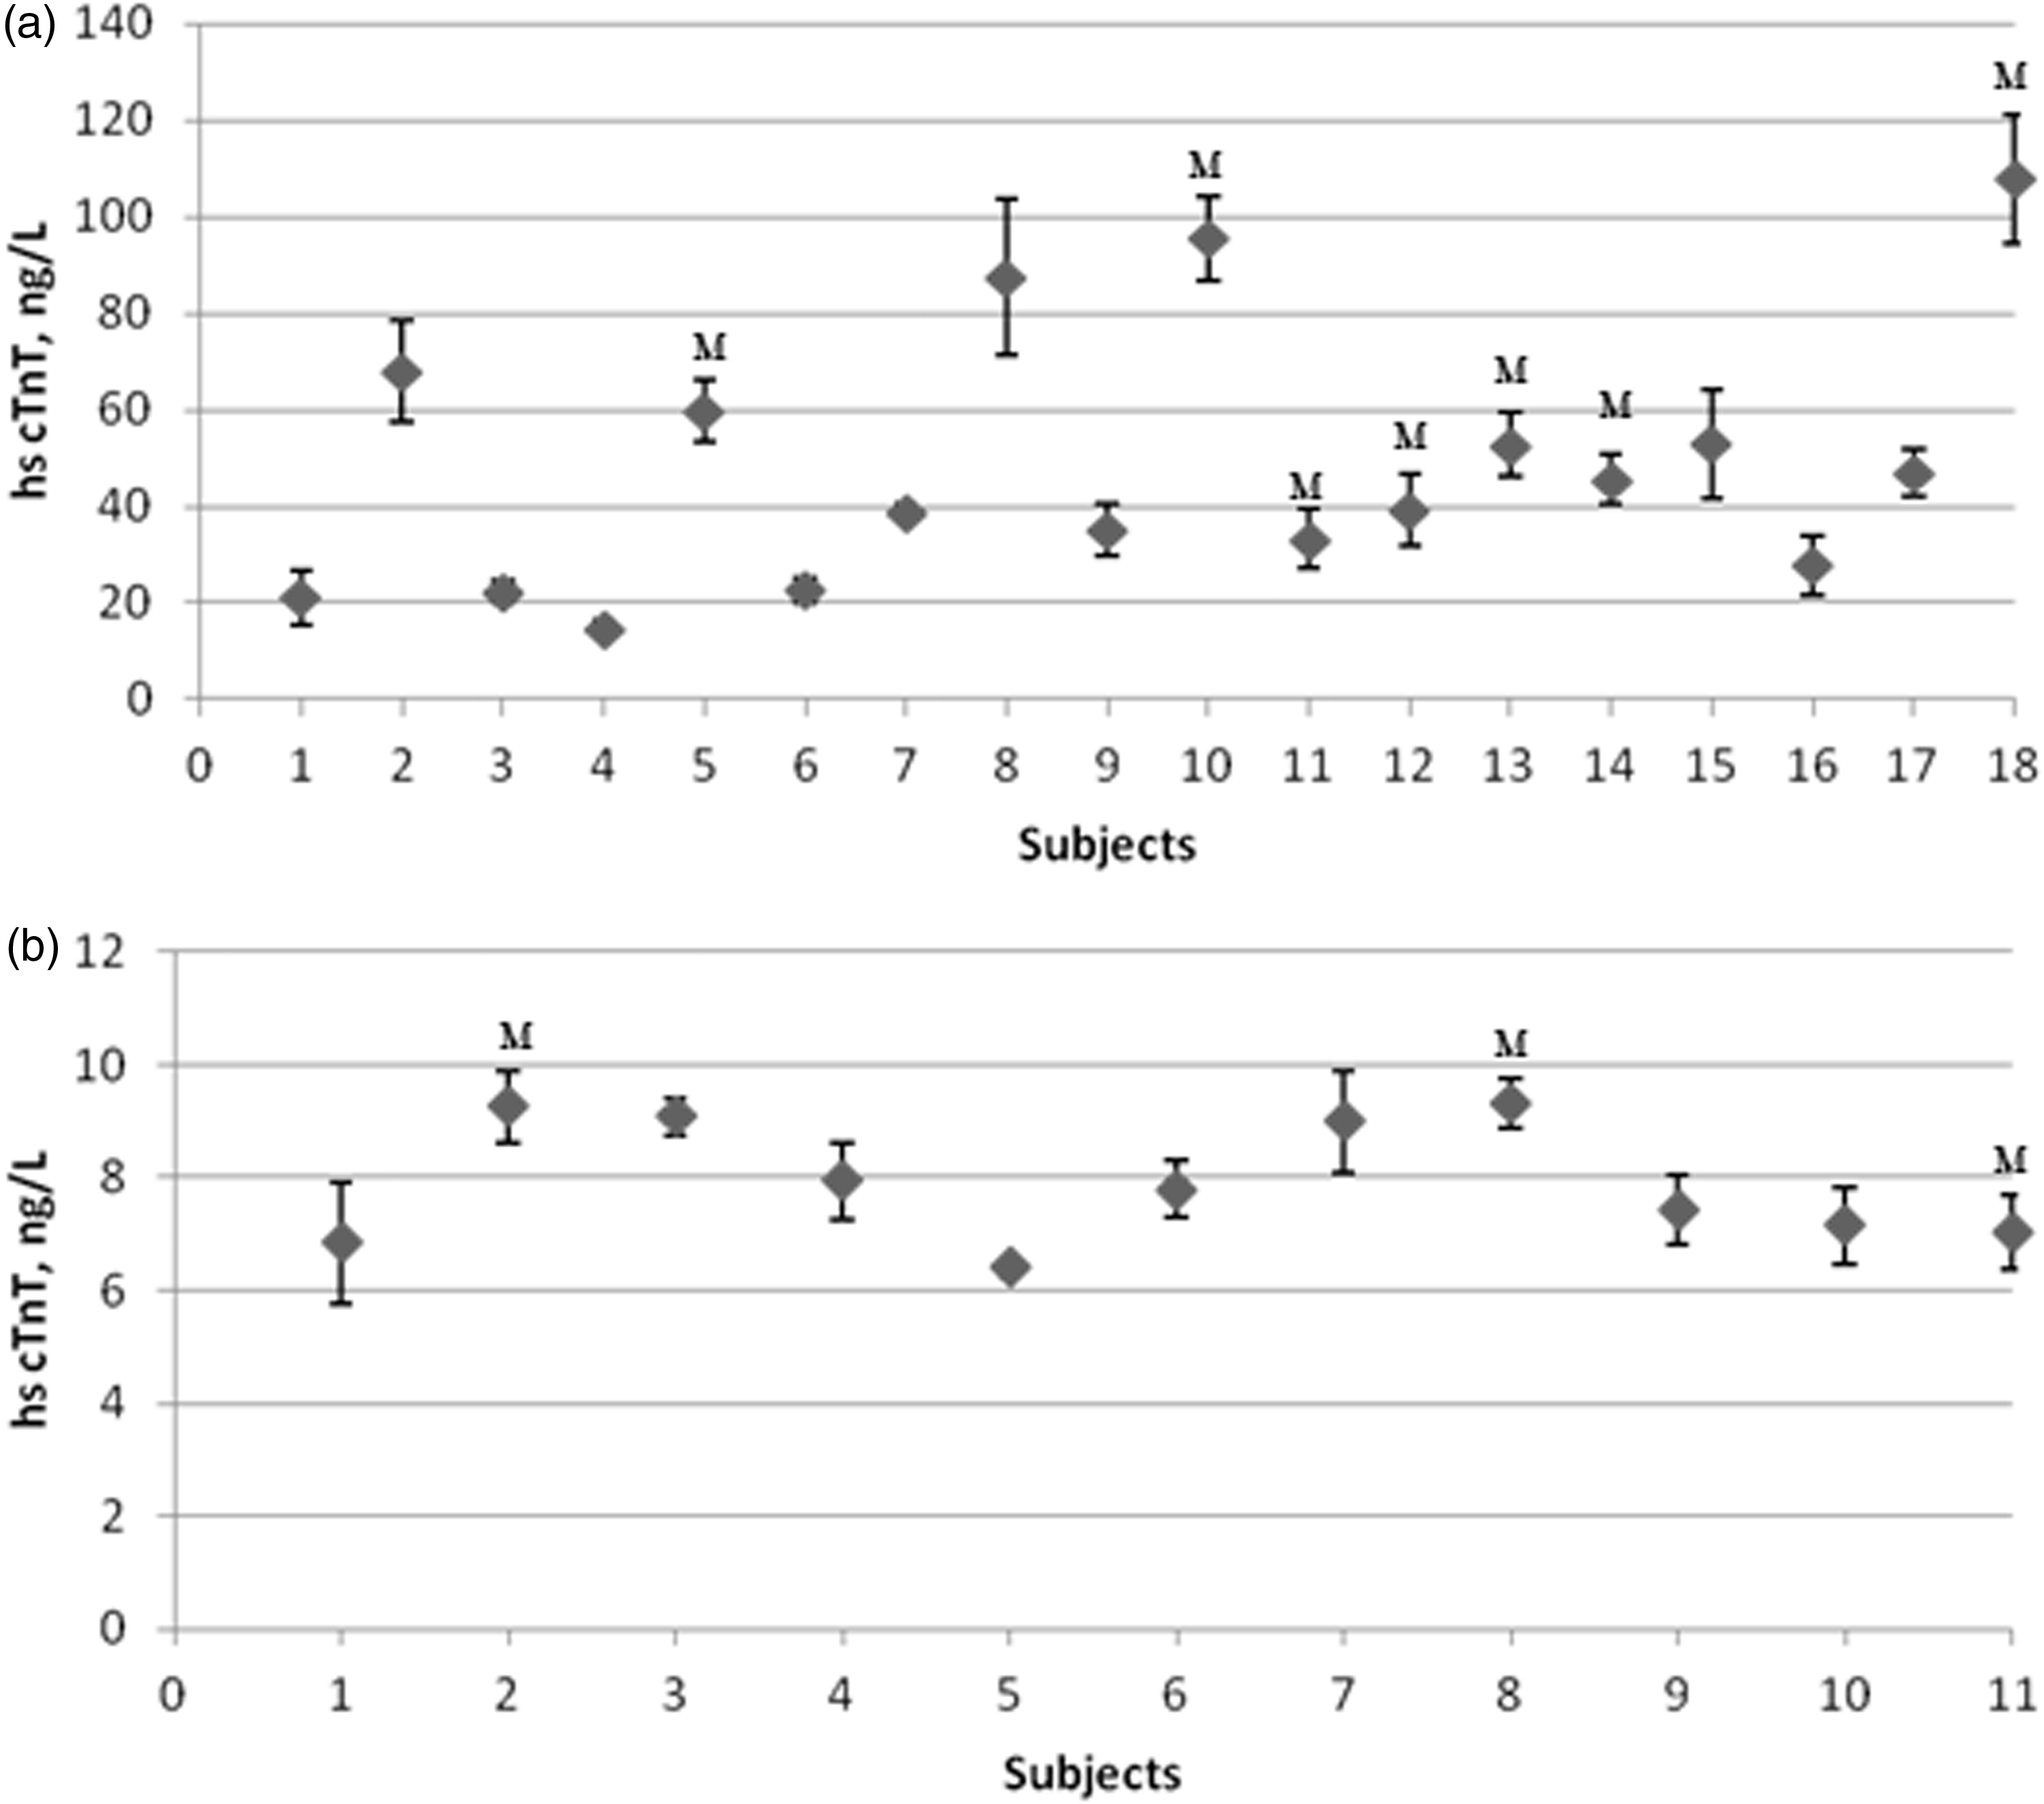
Biological variation data and derived parameters for serum cardiac troponin T in healthy individuals and ESRD patients.
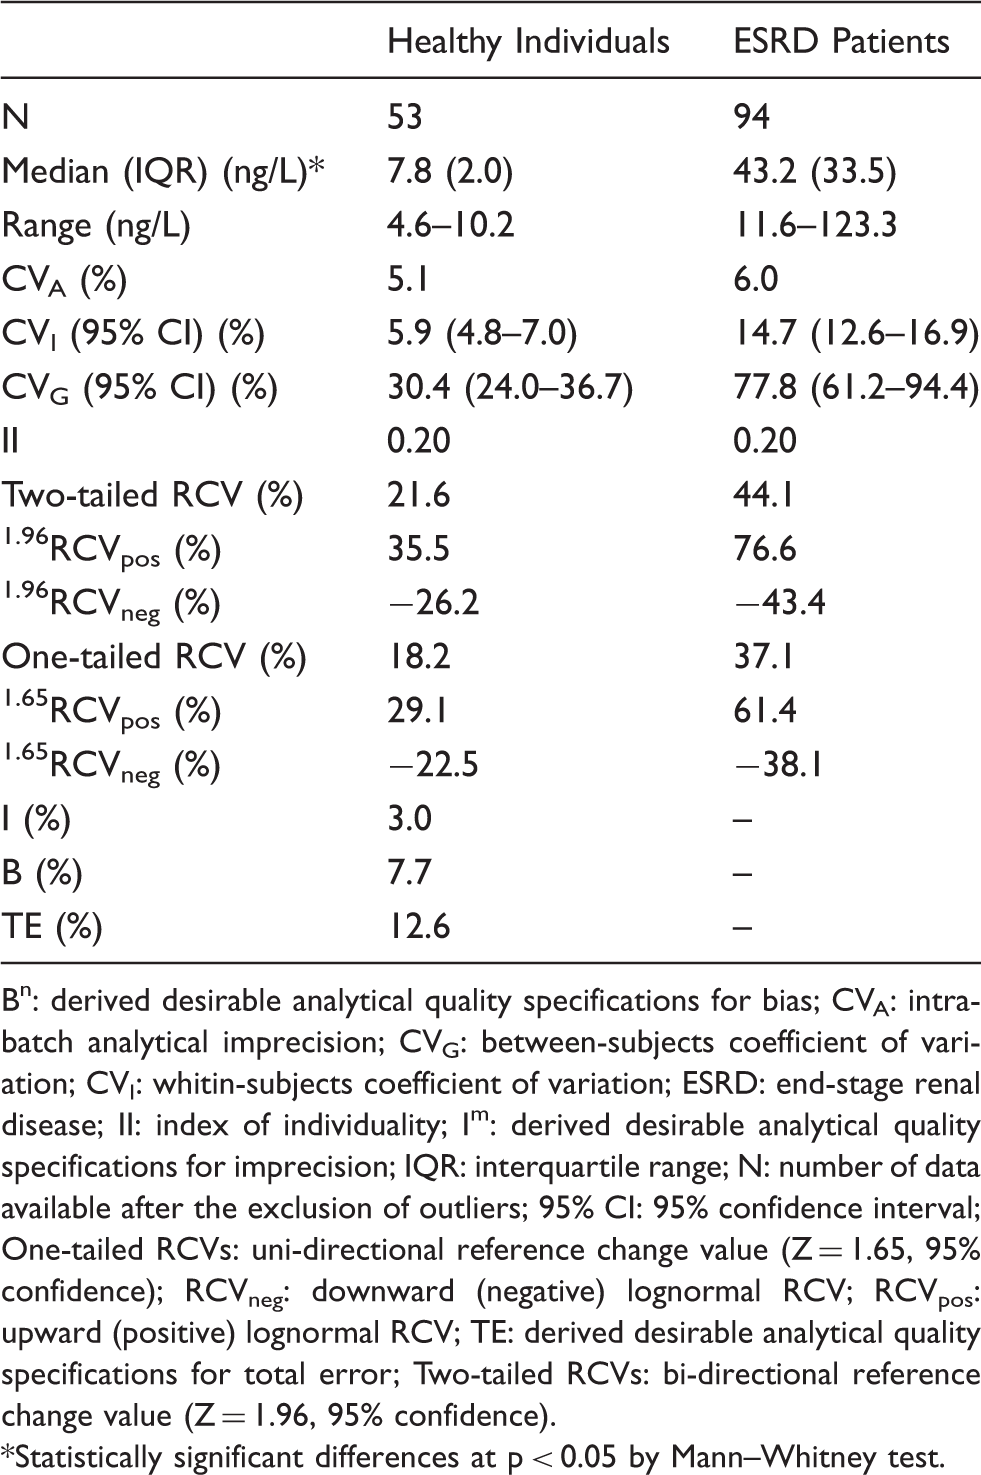
Bn: derived desirable analytical quality specifications for bias; CVA: intra-batch analytical imprecision; CVG: between-subjects coefficient of variation; CVI: whitin-subjects coefficient of variation; ESRD: end-stage renal disease; II: index of individuality; Im: derived desirable analytical quality specifications for imprecision; IQR: interquartile range; N: number of data available after the exclusion of outliers; 95% CI: 95% confidence interval; One-tailed RCVs: uni-directional reference change value (Z = 1.65, 95% confidence); RCVneg: downward (negative) lognormal RCV; RCVpos: upward (positive) lognormal RCV; TE: derived desirable analytical quality specifications for total error; Two-tailed RCVs: bi-directional reference change value (Z = 1.96, 95% confidence).
*Statistically significant differences at p < 0.05 by Mann–Whitney test.
The estimated CVTI was 8.1 and 16.2%, and CVA was 5.1% (duplicate median S-cTnT = 8.3 ng/L) and 6.0% (duplicate median S-cTnT = 43.6 ng/L) for healthy individuals and ESRD patients, respectively. Median S-cTnT concentrations observed in ESRD patients (43.2 ng/L) were significantly higher than those in healthy individuals (7.8 ng/L), like the within- and between-subject BV, according to the 95% CI. Due to the differences in CVI data, the estimated RCVs for ESRD patients were more than twice those calculated for healthy individuals. As expected, the upward and downward RCVs calculated from the lognormal approach were consistent with the RCV obtained from the standard approach for both healthy individuals and ESRD patients.
Effect of the time undergoing haemodialysis in serum cardiac troponin T concentrations and biological variation data.
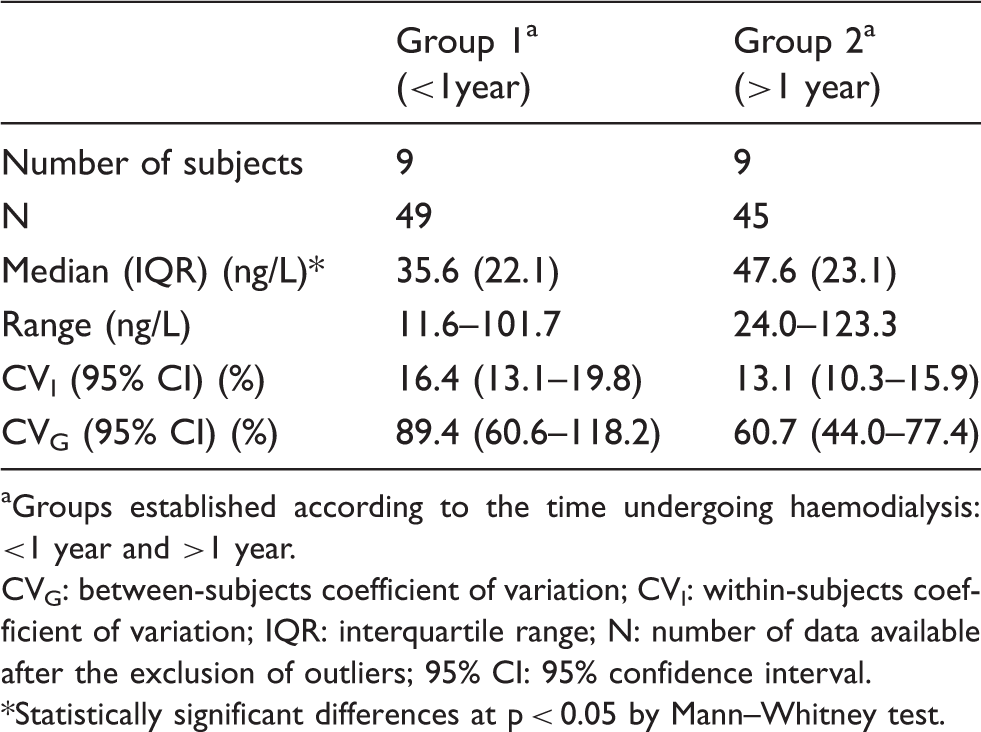
aGroups established according to the time undergoing haemodialysis: <1 year and >1 year.
CVG: between-subjects coefficient of variation; CVI: within-subjects coefficient of variation; IQR: interquartile range; N: number of data available after the exclusion of outliers; 95% CI: 95% confidence interval.
*Statistically significant differences at p < 0.05 by Mann–Whitney test.
Discussion
The presence of high baseline cTn concentrations in ESRD patients without signs of myocardial ischaemia has been widely documented and is associated with an increase in morbidity and mortality.9,10 The development of hs-S-cTn assays has made possible the detection of mild increases of cTn concentration in patients with other chronic conditions, as well as in the general population,22–26 allowing subjects with either silent, or clinically underestimated, cardiac disease to be identified. Paradoxically, this increase in analytical sensitivity has raised concerns about interpretation and clinical relevance in the clinical setting. 30
The increasing interest in the usefulness of BV data for the management of patients has encouraged studies in specific pathologies: for instance, in renal transplant patients to detect acute rejection 31 ; in congestive heart failure for therapeutic monitoring32,33 or in stable coronary artery disease. 26 Despite the need to assess serial observations of S-cTnT to recognize an acute cardiac event in ESRD patients, no specifically designed studies on BV have previously been reported. In this study, we have generated BV data for S-cTnT in ESRD patients and compared these with data obtained in healthy individuals, employing an hs-S-cTnT assay which provides the required imprecision.
Some limitations of the study design should be considered when assessing the results shown. The control group was younger than the ESRD group; therefore, direct comparison of BV data must be performed with caution. There are differences in the number of subjects included and in follow-up periods between healthy and ESRD subjects; however, it has been reported that the estimates of BV are usually similar, irrespective of the time scale of the study and the number of subjects included.16,17,34 Likewise, the influence of differences in the duration of observation could be minor according to the steady-state conditions in both groups. On the other hand, our data reflect only the pre-HD situation; therefore, further studies may be needed to evaluate the acute effect of ultrafiltration or that of peritoneal dialysis on S-cTnT concentration and BV data.
S-cTnT exhibited a low CVI value (14.7%) relative to the CVG (77.8%) in ESRD patients, which might suggest a limited turnover of cardiac myocytes in the presence of larger differences in the rates of cell turnover or renal clearance among patients. This CVI value agrees with that reported by Jacobs et al. 14 (CVI = 13%) in a 6-month follow-up study of 15 ESRD patients without cardiovascular complications. Interestingly, the CVI value in our ESRD patients was twice that obtained in healthy individuals (CVI = 5.9%), indicating that chronic renal disease modifies the variation of S-cTnT around the homeostatic set-point, as has been reported for some organ-specific markers such as creatinine in renal post-transplantation. 31 BV data generated for healthy individuals differ considerably from the hs-S-cTnT data previously published by Vasile et al., 22 who reported CVI and CVG values of 94% in an 8-week follow-up study on 19 healthy volunteers, and, to a lesser extent, from a recent study by Frankestein et al., 23 which assessed the hs-S-cTnT BV data in 15 subjects during a 4-week follow-up, showing CVI values of 30%. Despite differences in the kinetics of release and clearance between S-cTnT and S-cTnI, 35 our data bear more resemblance to those reported for hs-S-cTnI by Wu et al., 24 who studied 17 healthy subjects for 8 weeks (CVI = 14%; CVG = 63%), and those of Vasile et al., 25 in 19 healthy subjects for the same period (CVI = 2.6%; CVG = 41.6%). Potential reasons for observed discrepancies in hs-S-cTnT BV data include differences in subject selection and the statistical treatment of data. For instance, the number of serum concentrations reported in some studies close to or below the LoB of the assays might affect the accurate estimation of BV data, since measurements in the very low range of detection are always associated with increased imprecision. Thus, Browning et al. 36 advise against the estimation of BV data from an analyte if the available assays do not fulfil the minimum analytical requirements that ensure the analytical component is <20% of the total variance found. That strong influence was also shown in the study by Roraas et al. 34
Overall, 98% of the ESRD patients showed S-cTnT concentrations above the 99th percentile of the healthy population and a significant increase in these concentrations with the duration of HD treatment was observed. This is in agreement with the data published by Willging et al., 37 who noted that longer duration of HD treatment was associated with higher S-cTnT concentrations. On the contrary, BV data do not seem to be affected by the duration of HD treatment in our patients. The mechanism of serum S-cTnT elevation in asymptomatic ESRD patients is not clearly established, but it has been considered to reflect the onset or aggravation of a coronary artery disease, congestive heart failure, left ventricular hypertrophy or microinfarctions.10,38,39 Therefore, it would be useful to consider S-cTnT as a biomarker in the primary prevention of cardiovascular disease in those ESRD patients with a longer time in HD as they appear to be at higher risk. Moreover, measurements of S-cTnT concentration in periods of clinical stability could become an essential requirement in order to establish baseline concentrations that will allow future comparison through the RCV and, therefore, an appropriate clinical management of these patients.
The low II values obtained in both ESRD patients and healthy subjects (<0.6) show that S-cTnT has marked individuality. 18 This confirms the limited value of population-based reference intervals or defined cut-off decision-making limits in the diagnosis of AMI and supports the notion that serial testing is the key approach for an appropriate clinical interpretation of S-cTnT changes in both populations.
The long-term RCV calculated here for healthy individuals may support the percentage of increase (20%) recommended as evidence of AMI in recurrent infarction 11 or in subjects with chronically elevated S-cTnT concentrations, 15 which is based on the common analytical imprecision, although higher changes would be required (29.1 or 35.5% for one- or two-tailed RCVpos, respectively) if skewed distributions of the S-cTnT concentrations were considered. However, RCVs obtained for ESRD patients were twice the recommended percentage, which means that attributing clinical significance to 20% change may be associated with a larger number of false positive cases. On the other hand, the potential increase in false negatives with the higher RCV obtained in these high-risk patients for acute coronary syndrome could be attenuated by the shorter time of hs-S-cTnT reanalysis, indicated at 3–6 h after the onset of symptoms. 11 It should be noted that RCVs derived from healthy individuals play a role in identifying myocardial damage in the early stages of chronic kidney disease as there is usually a progressive transition from the non-diseased to diseased states. Nevertheless, for ESRD patients the use of the RCV derived from advanced disease-specific BV data seems to be more appropriate, in particular the more stringent one-tailed RCVs, since a significant increase is the only change to be considered. 40
Finally, the European consensus established that the best quality specifications in laboratory medicine are those based on BV. 20 As a consequence of the low CVI value observed for S-cTnT in healthy individuals, the derived desirable analytical goals for I, B and TE are quite stringent. Nevertheless, the minimum goal for imprecision (0.75CVI) is usually achieved in our laboratory.
In summary, BV data for S-cTnT have been generated by the use of the new hs assay, observing a relatively low CVI in relation to the CVG in both healthy individuals and ESRD patients. Due to their likely different homeostatic regulation, BV data for ESRD patients were significantly higher than those for healthy individuals; therefore, the use of appropriate RCV data is recommended for the evaluation of changes in serum S-cTnT. For appropriate clinical management of these patients in relation to the development of cardiovascular events, the regular monitoring of the S-cTnT concentrations could be important in order to allow future comparison through the RCV.
Footnotes
Declaration of conflicting interest
None declared.
Funding
This research received no specific grant from any funding agency in the public, commercial, or not-for-profit sectors.
Ethical approval
The study was approved by the institutional review board (27012010).
Guarantor
RV.
Contributorship
RV conceived the study. All authors were involved in protocol development, institutional review board approval and patient recruitment. RV and ZC performed the data analysis. ZC wrote the first draft of the manuscript. All authors reviewed and edited the manuscript and approved the final version of the manuscript.