
Abstract
Background
Patients with end-stage renal failure exhibit a chronic elevation of serum cardiac troponin (cTn) concentration. In order to facilitate the diagnosis of myocardial infarction in these patients, it is necessary to distinguish an increased cTn concentration due to an acute event, from that being a manifestation of chronic elevation. The aim of this study was to gather biological variation data relating to two serum cTn assays, one, a hs-cTnT assay, the other a contemporary sensitive cTnI assay, among stable haemodialysis patients. It was hoped that this might inform as to the best way to use cTn assays to assist in the diagnosis of myocardial infarction in patients with end-stage renal failure.
Methods
Eighteen stable haemodialysis patients were recruited, of whom 16 completed the study. Predialysis blood samples were collected weekly for 10 weeks during the second dialysis session of the week. Analytical CV (CVA), within-subject biological variation (CVI), between-subject biological variation (CVG), reference change value (RCV) and index of individuality (II) were determined for both assays.
Results
All samples had a serum hs-cTnT concentration above the 99th percentile for a healthy population compared to 29.4% for cTnI. For hs-cTnT, the long-term CVA was 2.1%, CVI 10.5%, CVG 64.2%, RCV 28.1% and log-normal RCV (rise/fall) 34.4%/–25.6%. The corresponding values for cTnI were 7.1, 20.2, 100.5 and 79.8%/–44.4%. The II was 0.17 and 0.2 for hs-cTnT and cTnI, respectively.
Conclusion
Long-term biological variation of cTn in stable haemodialysis patients is similar to that in healthy individuals and in patients with stable coronary arterial disease. The low II for cTnI and hs-cTnT in stable haemodialysis patients indicates that population-based decision points are of limited value. Serial measurements are required to detect significant changes in cTn concentrations and support diagnosis of myocardial infarction in these patients.
Introduction
Current guidelines recommend the measurement of serum cardiac troponin (cTn) in the diagnosis of myocardial infarction (MI), with values above the 99th percentile for the population and evidence of myocardial ischaemia considered diagnostic. 1 The introduction of high-sensitivity troponin (hs-cTn) assays now allows the measurement of serum cTn at concentrations below the 99th percentile. It also allows the detection of small changes in serum cTn concentration. This has resulted in a move towards measuring a delta change in serum cTn concentration to facilitate earlier and improved diagnosis of myocardial ischaemia.2,3 Various studies have shown that some healthy individuals have measurable concentrations of serum-cTn above the limit of detection.4,5 Elevations in serum troponin concentration have been found in 5–18% of patients with end-stage renal disease (ESRD) using previous generation assays. 6 These elevations have been attributed to reduced renal clearance and increased myocardial injury. 7 This may predict cardiac disease and mortality.8,9
The introduction of hs-cTn assays has also resulted in an increase in the detection rate of cTn in stable haemodialysis (HD) patients, compared to conventional cTn assays.7,10,11 A study over a three-month period, using a Vitros ES hs-cTnI assay in patients undergoing HD, found that 41% of patients had an elevated serum cTnI. 12 Baseline values were higher in those HD patients with a history of coronary heart disease, left ventricular hypertrophy and low cardiac ejection fraction. 12 Similarly, Wolley et al., using cTnT, found serum concentrations above the 99th percentile for normal healthy individuals in 98% of stable HD patients. 13 The National Academy of Clinical Biochemistry (NACB) guidelines for the diagnosis of acute MI advocate the use of serial testing of serum cTn to detect changes in cTn concentration.1,14,15 Knowledge of the biological variation of serum cTn enables the calculation of the reference change value (RCV), which can be used to indicate whether the delta change between serial results is significant.
Previous studies have described the variability of cTn in patients undergoing HD.10,12,16 In a study using different serum cTn assays, Jacobs et al. found a within-subject biological variation (CVI) of 39, 15 and 13% for cTnT, hs-cTnT and cTnI assays, respectively. 10 Wolley and colleagues found a CVI of less than 50% in stable HD patients, with a greater variation observed in those individuals with cardiac disease.13,15 The CVI of serum cTn was small in studies that used conventional cTn assays as opposed to hs-cTn assays,12,16 but the inability of these assays to measure values below the 99th percentile is an important limitation. Previous studies did not fulfil the criteria that are required for undertaking a study on biological variation, and a failure to control for preanalytical factors means that the coefficients of variation derived in these studies are less reliable.17,18 An exception to this was a study by Aakre et al. who found the long-term CVI for serum cTn, measured using hs-cTnI and hs-cTnT methods in stable HD patients, was similar to that found in healthy individuals. 19
Our study investigated the long-term biological variation of cTn in the serum of stable HD patients, measured using a contemporary sensitive cTnI assay and a hs-cTnT assay. Biological variation was determined by the Cotlove protocol. 17
Methods
Subjects
Eighteen stable HD patients who had been receiving HD three times a week were recruited. Predialysis blood samples were collected weekly from the participants during the second dialysis session of the week, for a total of 10 weeks. To minimize variability, the interval between the first and second dialysis sessions of the week was two days for all of the patients.
Specimen collection
Samples were collected using the standard venepuncture and phlebotomy procedures in the dialysis unit. Sample handling and storage were performed according to a standardized protocol.
Analytical methods
A single operator performed the analysis using a single batch of reagents, quality control material and calibrators for each instrument. Each sample from each individual was measured in duplicate in random order and in a single batch. The position of the duplicate was randomized to minimize any perceived inherent positional- or time-related difference within the assay. Each assay had one duplicate of the two concentrations of quality control material at the beginning and end of the batch. These measures were taken to eliminate between-run variations and minimize analytical variation.17,18
Serum-cTnI assay
The Siemens TnI-ultra assay was used (Lot no 11397069 expiry 12/07/2013 with calibrator Lot no 010069 expiry 12/07/2013), performed on a Centaur XP analyser (Siemens Healthcare Diagnostics, Frimley UK). This assay has a stated limit of detection of 6 ng/L, with a concentration of 40 ng/L at the 99th percentile and an analytical coefficient of variation (CVA) of < 10% at 30 ng/L. Internal laboratory validation of this assay found a limit of blank of 6 ng/L and CVA < 10% at 34 ng/L.
Serum hs-cTnT assay
The Roche hs-cTnT assay was used (Lot no 16734503 Expiry 07/2013 with calibrator Lot no 16948901 expiry 12/2013) on a Cobas e411 analyser (Roche Diagnostics GmbH, Manheim, Germany). The calibrator was standardized against the Elecsys Troponin T hs STAT assay (ref 05092728) which is originally standardized against the Enzymun-Test troponin T cardiac method. This assay has a stated limit of blank of 3.0 ng/L, limit of detection of 5 ng/L, with a concentration of 14 ng/L at the 99th percentile, CVA < 10% at 13 ng/L.
Quality control material
Both methods used Biorad Cardiac Markers plus Lot no 23551 and 23552 expiry 28/02/2015 (Biorad Laboratories, Irvine, CA, USA).
Statistical analysis
All calculations and analysis were carried out using Microsoft Excel and Graph Pad Prism 6.0 (Graph Pad Inc, San Diego, CA, USA). Outliers were excluded using Cochran and Reed tests.
17
Biological variation data were analysed according to methods previously described by Fraser and colleagues.18,20 Using this technique, the analytical variance was calculated from the difference between duplicate results for each specimen.
The minimum number of samples needed from each participant to obtain an estimate within 10% of his/her true homeostatic set point with a 95% probability was calculated using the formula
The index of individuality (II) was calculated as:
Results
Patient baseline characteristics (n = 16).
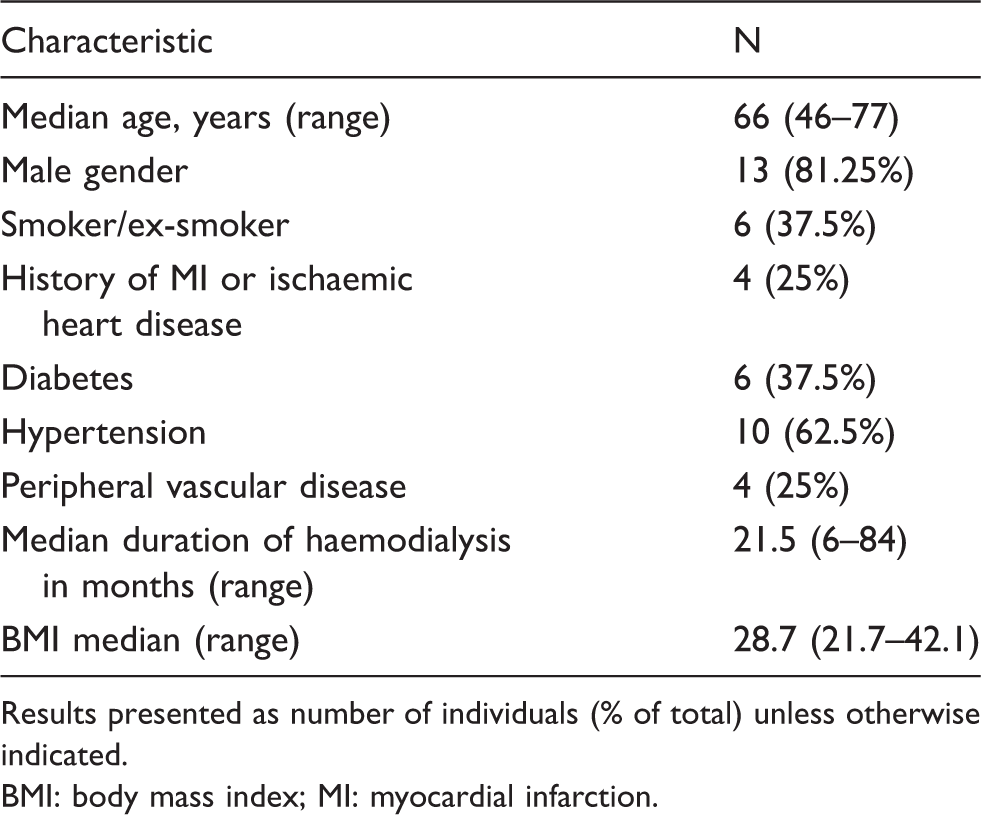
Results presented as number of individuals (% of total) unless otherwise indicated. BMI: body mass index; MI: myocardial infarction.
Causes of ESRD.
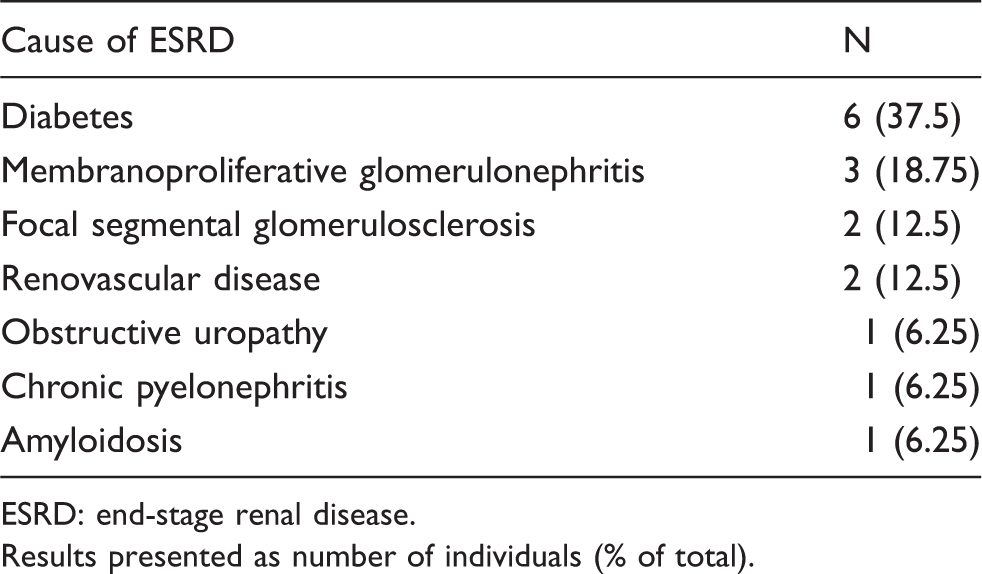
ESRD: end-stage renal disease.
Results presented as number of individuals (% of total).
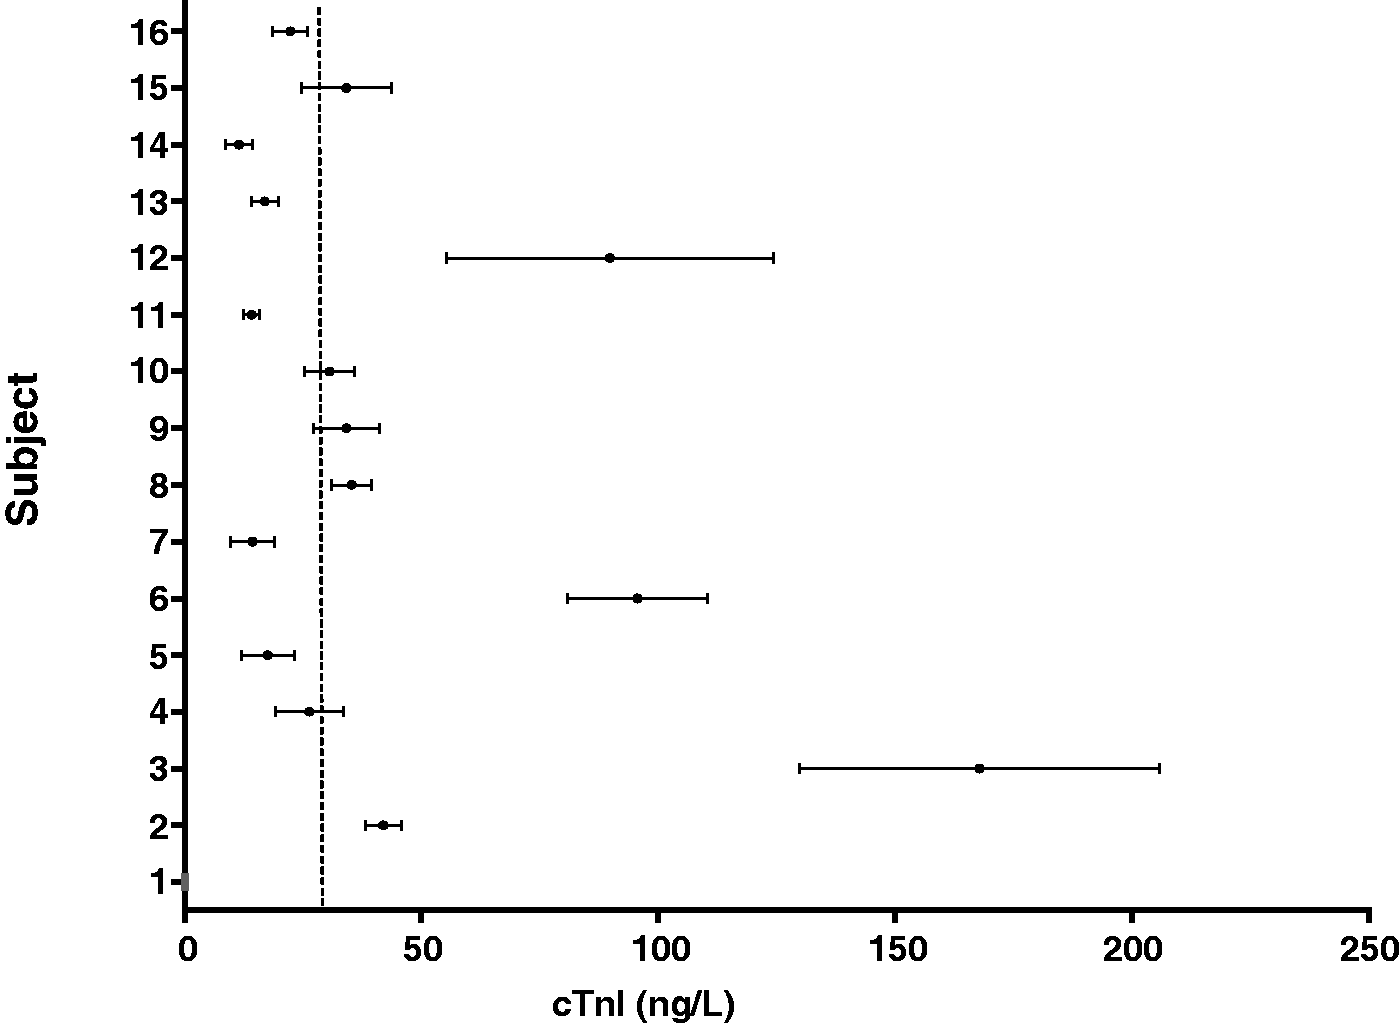
The biological variation of hs-cTnT and cTnI was determined using all of the cTn results that were above the limit of detection for the particular cTn assay. The mean concentration (ranges) for serum cTnT and cTnI obtained in the study participants are shown in Figures 1 and 2, respectively. The mean CVA, CVI and CVG, RCV and index of individuality of the two assays are compared in Table 3. The cTnI assay had a higher CVA, CVI and CVG compared to the hs-cTnT assay.
Serum hs-cTnT concentrations for individual HD patients. Data are presented as mean (range). Dashed line = 99th percentile, 14 ng/L. Serum cTnI concentrations for individual HD patients. Data are presented as mean (range). Dashed line = 99th percentile, 40 ng/L. Biological variation data for hs-cTnT and cTnI in HD patients.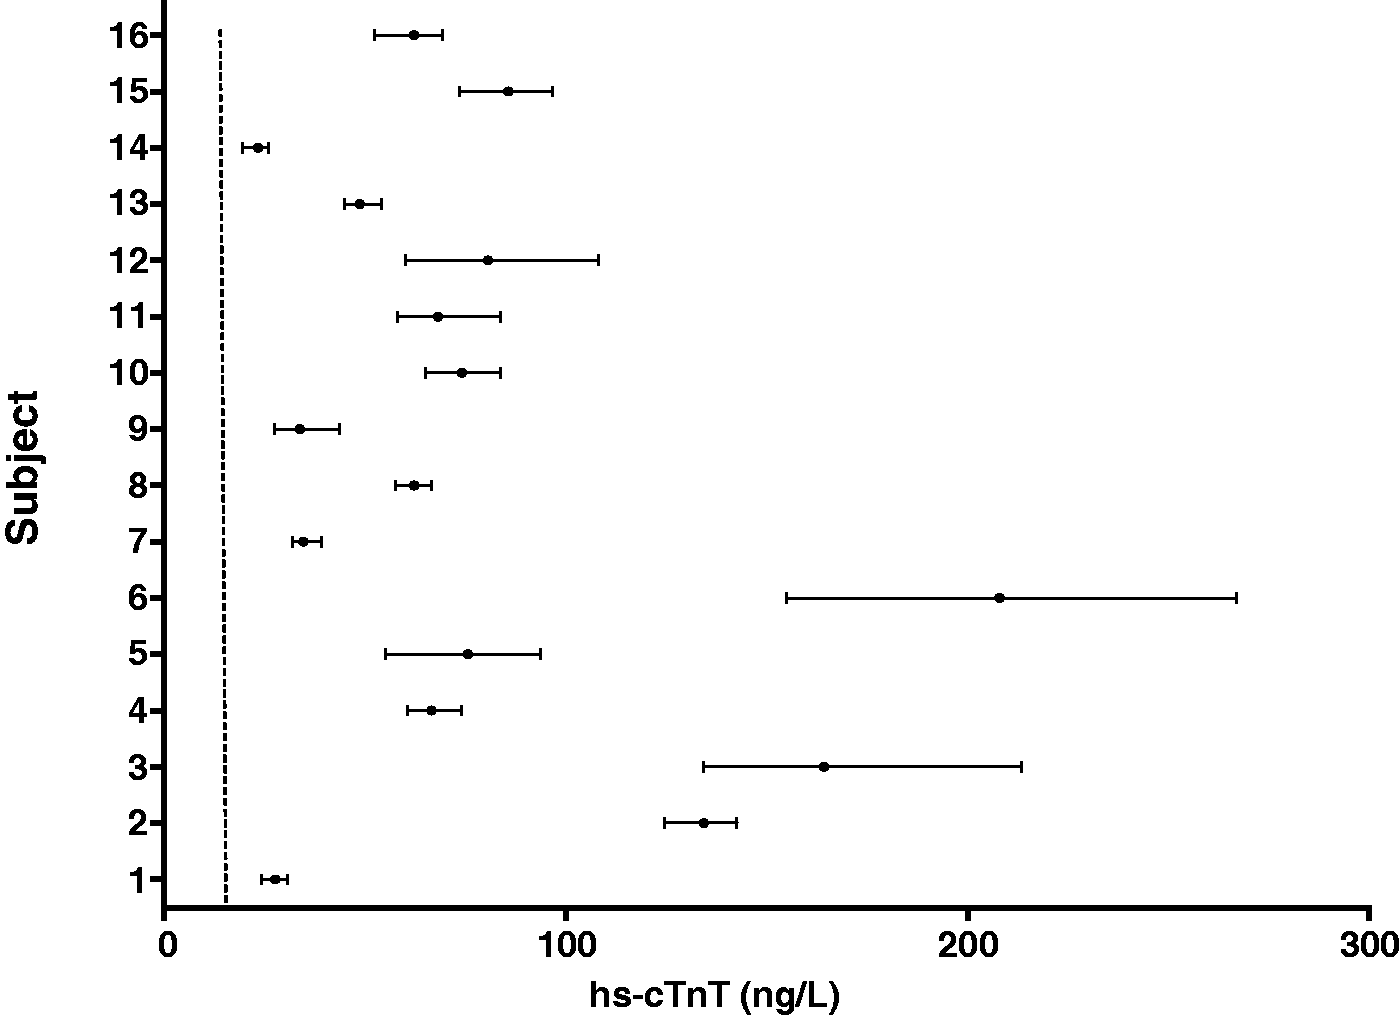
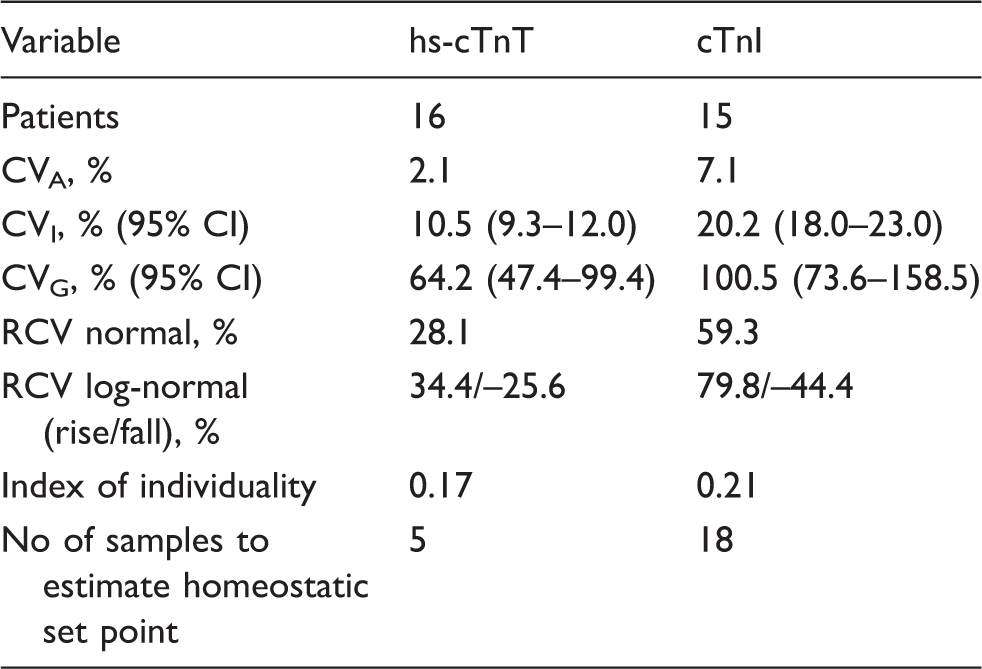
The CVI for the hs-cTnT assay was 10.5%, RCV normal 28.1% and the RCV log-normal (rise/fall) was 34.4%/–25.6%. The corresponding values for the cTnI assay were 20.2, 59.3 and 79.8%/–44.4%. The index of individuality was 0.17 for the hs-cTnT assay and 0.21 for cTnI assay.
Discussion
This study presents data on the biological variation of serum cTn in stable HD patients. We found that the long-term CV1 of cTn in this group of patients was similar to that seen in healthy individuals and patients with stable coronary arterial disease. The wide variation in individual baseline serum cTn values, which results in a large CVG in this group, means that population-based reference intervals are of limited value in the diagnosis of cardiac events. This is important, as it is difficult to distinguish a serum cTn result that is elevated due to acute coronary syndrome in the context of atypical symptoms, from elevations associated with chronic kidney disease.9,10,25–27 The long-term CVI in patients undergoing HD was 10.5 and 20.2% for the hs-cTnT and cTnI assays, respectively, and was similar to that previously described in healthy individuals.19,28,29 The differences in study design and CVA may explain the higher CVI previously reported in some studies.30,31 The long-term CVI observed in the two assays used in this study is similar to that seen in patients with stable coronary artery disease. 32 Being clinically stable while undergoing regular HD may, like having stable coronary arterial disease, not influence the within-subject biological variability of cTn in serum.
In our study, the CVA for cTn was less than 0.5 CVI, indicating that smaller changes would be significant for serial results in individual measurements. 33 However, a large proportion (64%) of samples had a serum cTnI concentration below 34 ng/L, the concentration at which, the locally derived total CVA is 10%. 33 The higher CVA of cTnI at low concentrations in our study may, in part, account for its higher derived CVI. The CVA was derived from the duplicate study samples analysed as a single batch, which may have underestimated the CVA, as well as RCV at the low concentrations. The CVA for both assays were relatively low, implying a minimal effect of CVA on the RCV (a high intra-assay CVA would have led to a higher RCV). While the imprecision profile of these cTn assays may necessitate the application of a different RCV across the analytical range, these would be difficult to implement for two reasons. Firstly, clinicians do not readily understand this concept, and secondly, it may be difficult to report a range of RCVs for cTn at different concentrations, in some laboratory information systems. This may have an effect on the number of samples required to determine the homeostatic set point.
Since the troponin data in our study were skewed, the log-normal RCV was calculated. Our data demonstrate that a 34.4% rise or fall of greater than 25.6% in hs-cTnT and 79.8% rise or fall of greater than 44.4% in cTnI is required for the change to be significant. The long-term RCV of 28.1% for hs-cTnT and 59.3% for cTnI were similar to those found in patients with stable coronary artery disease. 32 The log-normal RCV was similar to that of hs-cTnI, described in healthy individuals.28,29 Serum cTn has a large between-subject variation in stable HD patients. In our study, the individual mean serum concentration of hs-cTnT varied from 23.5 to 208 ng/L with a CVG of 64.2%. The corresponding results for cTnI were 11.5–168 ng/L, with a CVG of 100.5%. The low CVI with a large CVG results in a low index of individuality (II), 0.17 for hs-cTnT and 0.21 for cTnI. An II of <0.6 indicates that a population-based reference interval or a diagnostic cut-off value is of limited use for diagnostic purposes and further suggests that each individual's homeostatic set point should be determined. A low II has previously been reported in patients with ESRD and in healthy individuals. 34
The biological variation indices reported in the present study support the use of delta changes in cTn concentration rather than reference intervals, for clinical decision-making in stable HD patients. However, the wide variation in mean hs-cTnT concentration in the study participants means that absolute delta change values may result in increased false positive and false negative rates depending on the decision limits used. This differs from the report of Mueller et al., which found absolute delta changes to be superior to relative changes in discriminating acute coronary syndrome. 35 The RCV for both assays is greater than the value of 20%, which is the delta change in cTn over a 6–9 h period recommended by the NACB. 14 This may result in an increased number of false positives when using either of these assays. This number may be lower if a unidirectional RCV was calculated or short-term RCV determined. The imprecision profile of cTn assays would mean that different RCV across the concentration range would be required. The consistently raised serum hs-cTnT concentration in HD patients as well as lower RCV would make this the preferred assay in clinically stable HD patients. 19 The decision limits for delta changes in these patients should be patient specific and will depend on the patient's homeostatic set point derived from the CVI and CVA at the mean cTn concentration. In our study, hs-cTnT had to be measured on five samples and cTnI measured on 18 samples from each HD patient in order to obtain an estimate within 10% of each individual's true homeostatic set point with a 95% probability at the CVA of each assay. A lower CVA would result in fewer samples required to establish the set point as would using a lower probability threshold to determine the set point. 18 It is worth considering that the homeostatic set point may vary over the course of dialysis, which may influence the time interval for determining it. Similarly, while 95% probability is used in studies, this may vary in clinical practice with lower probability used.
The mean cTnI concentrations for study patients 3, 6 and 12 were considerably higher than other study participants. Only patient 3 had a previous history of MI. None of the three patients had been on dialysis for more than two years. We were unable to find a cardiovascular cause for the raised cTn in the other two patients. However, ESRD patients have greater cardiovascular morbidity and mortality and thus possibility of undiagnosed ischaemic heart disease. 8
This study had a number of limitations. The effect of haemodialysis on cTn molecules has been shown to be variable. 36 The RCV of cTn in our study was calculated in relation to predialysis blood samples, with an assumption made that cTn concentrations are unaffected by HD. However, changes in cTn concentrations during dialysis could affect the calculated RCV at different times in relation to HD. This is important, as assessment to exclude myocardial injury could occur arbitrarily between dialysis intervals. This is a complex concept which was not addressed in our study.
Only 36% of the study samples had cTnI results above 34 ng/L, the concentration at which the CVA is 10%. The high CVA observed at low cTn concentrations may have contributed to the biological variation indices obtained. While every attempt was made to have the same designated phlebotomist for each patient, this was not achievable due to holidays and sickness. However, all phlebotomists had undergone standardized training, thus minimizing variation in practice. The study did not establish the short-term variation of cTn in the study participants. This would have been helpful to establish what represents a significant change in an acute setting.
In conclusion, our study has shown that the long-term CVI of cTn in stable HD patients is similar to that seen in both healthy individuals and in patients with stable coronary arterial disease. The II for both cTnI and hs-cTnT in these patients are both low, therefore the use of a diagnostic cut-off value in the diagnosis of MI is of limited value. Serial measurements are required to detect significant changes in cTn concentrations in order to support the diagnosis of acute MI in this group of patients. The decision to use absolute or relative delta changes would depend of specific clinical scenarios. The results should be used in relation to the established homeostatic set point for individual patients. This would depend on locally defined clinical utility and significance.
Footnotes
Acknowledgements
To Kate Gunn, Andrew Cundiff, Zeb Hanif and Phil Christy from Harrogate Hospital for their support during the study.
Declaration of conflicting interests
None.
Funding
We received assay kits from Siemens Healthcare Diagnostics.
Ethical approval
West Midlands Coventry and Warwickshire Research Ethics Committee Ref: 12/WM/0382.
Guarantor
WM.
Contributorship
BL and WM conceived the study. WM performed the study. WM, AL and BL contributed to writing the paper. All authors have reviewed the final manuscript.
References
Supplementary Material
Please find the following supplemental material available below.
For Open Access articles published under a Creative Commons License, all supplemental material carries the same license as the article it is associated with.
For non-Open Access articles published, all supplemental material carries a non-exclusive license, and permission requests for re-use of supplemental material or any part of supplemental material shall be sent directly to the copyright owner as specified in the copyright notice associated with the article.