
Abstract
The revised national guidelines for the analysis of cerebrospinal fluid for bilirubin in suspected subarachnoid haemorrhage (UK) provide a framework for the analysis of cerebrospinal fluid samples for the purpose of investigation of subarachnoid haemorrhage. In principle, as long as samples are collected and analysed according to the guidelines, any absorbance scan thus obtained ought to be amenable to interpretation. The case presented involves a cerebrospinal fluid sample with an absorbance scan which could not be interpreted with the guidelines. An archive search for similar cases suggested interference from doxycycline therapy as the cause. Doxycycline was confirmed to be the cause through experimental in vitro reproduction of the interference. Difficulties arising from this interference are discussed. It is hoped that a future version of the guidelines may mention, and propose a means of dealing with, the issue of doxycycline interference.
Keywords
Introduction
Suspected subarachnoid haemorrhage (SAH) may be investigated by the spectrophotometric analysis of cerebrovascular fluid (CSF). This is especially important in cases which present more than 12 h after onset of symptoms – in these cases computed tomography has been shown to lack sensitivity. 1 A spectrophotometer is used to generate an absorbance scan which is then interpreted using the revised national guidelines for the analysis of CSF for bilirubin in suspected SAH. 1 The guidelines involve the use of an artificial baseline that touches the absorbance curve in two places: between 350 and 400 nm and again between 430 and 530 nm. Through the use of an artificial baseline, inferences can be made about the sample’s oxyhaemoglobin and bilirubin content. A sample that contains significant bilirubin is normally deemed supportive of a diagnosis of subarachnoid haemorrhage. This case involves the novel situation in which the guidelines could not be used. An explanation is offered and means of dealing with this problem are discussed.
Case
The patient was being treated with doxycycline for a skin infection. Several days after commencing doxycycline the patient presented with visual disturbance and headache. Computed tomography of the patient’s head was normal. A CSF sample was submitted for analysis to our laboratory for exclusion of subarachnoid haemorrhage. The sample was analysed as per our normal protocol: centrifugation at 250 g for 5 min, analysis of sample within 30 min of sample reception, use of a spectrophotometer (Shimadzu UV 1800P) to generate an absorbance curve (see Figure 1), use of our blood gas instrument, the ABL 800 Flex, to generate biochemistry results and use of a microscope to generate a cell count. All measured biochemistry and cell counts were normal (albumin, glucose, lactate, red blood cell and white blood cell concentration). Although serum bilirubin was not measured, extrapolation from the icterus index as measured on our general chemistry instrument, the Cobas 6000, suggested that this was normal. Interpretation of the absorbance curve was problematic because it was not possible to draw a tangent that touches the curve between 350 and 400 nm and again between 430 and 530 nm as described in the revised national guidelines for the analysis of cerebrospinal fluid. This was due to the presence of an absorbance peak located at around 375 nm. It was proposed that the extra peak might be due to an interfering substance. As the sample was clear and colourless and contained neither an absorbance peak at 455 nm (that of bilirubin) nor at 410–418 nm (that of oxyhaemoglobin), the sample was reported as ‘Bilirubin and oxyhaemoglobin not increased. No evidence to support SAH’.
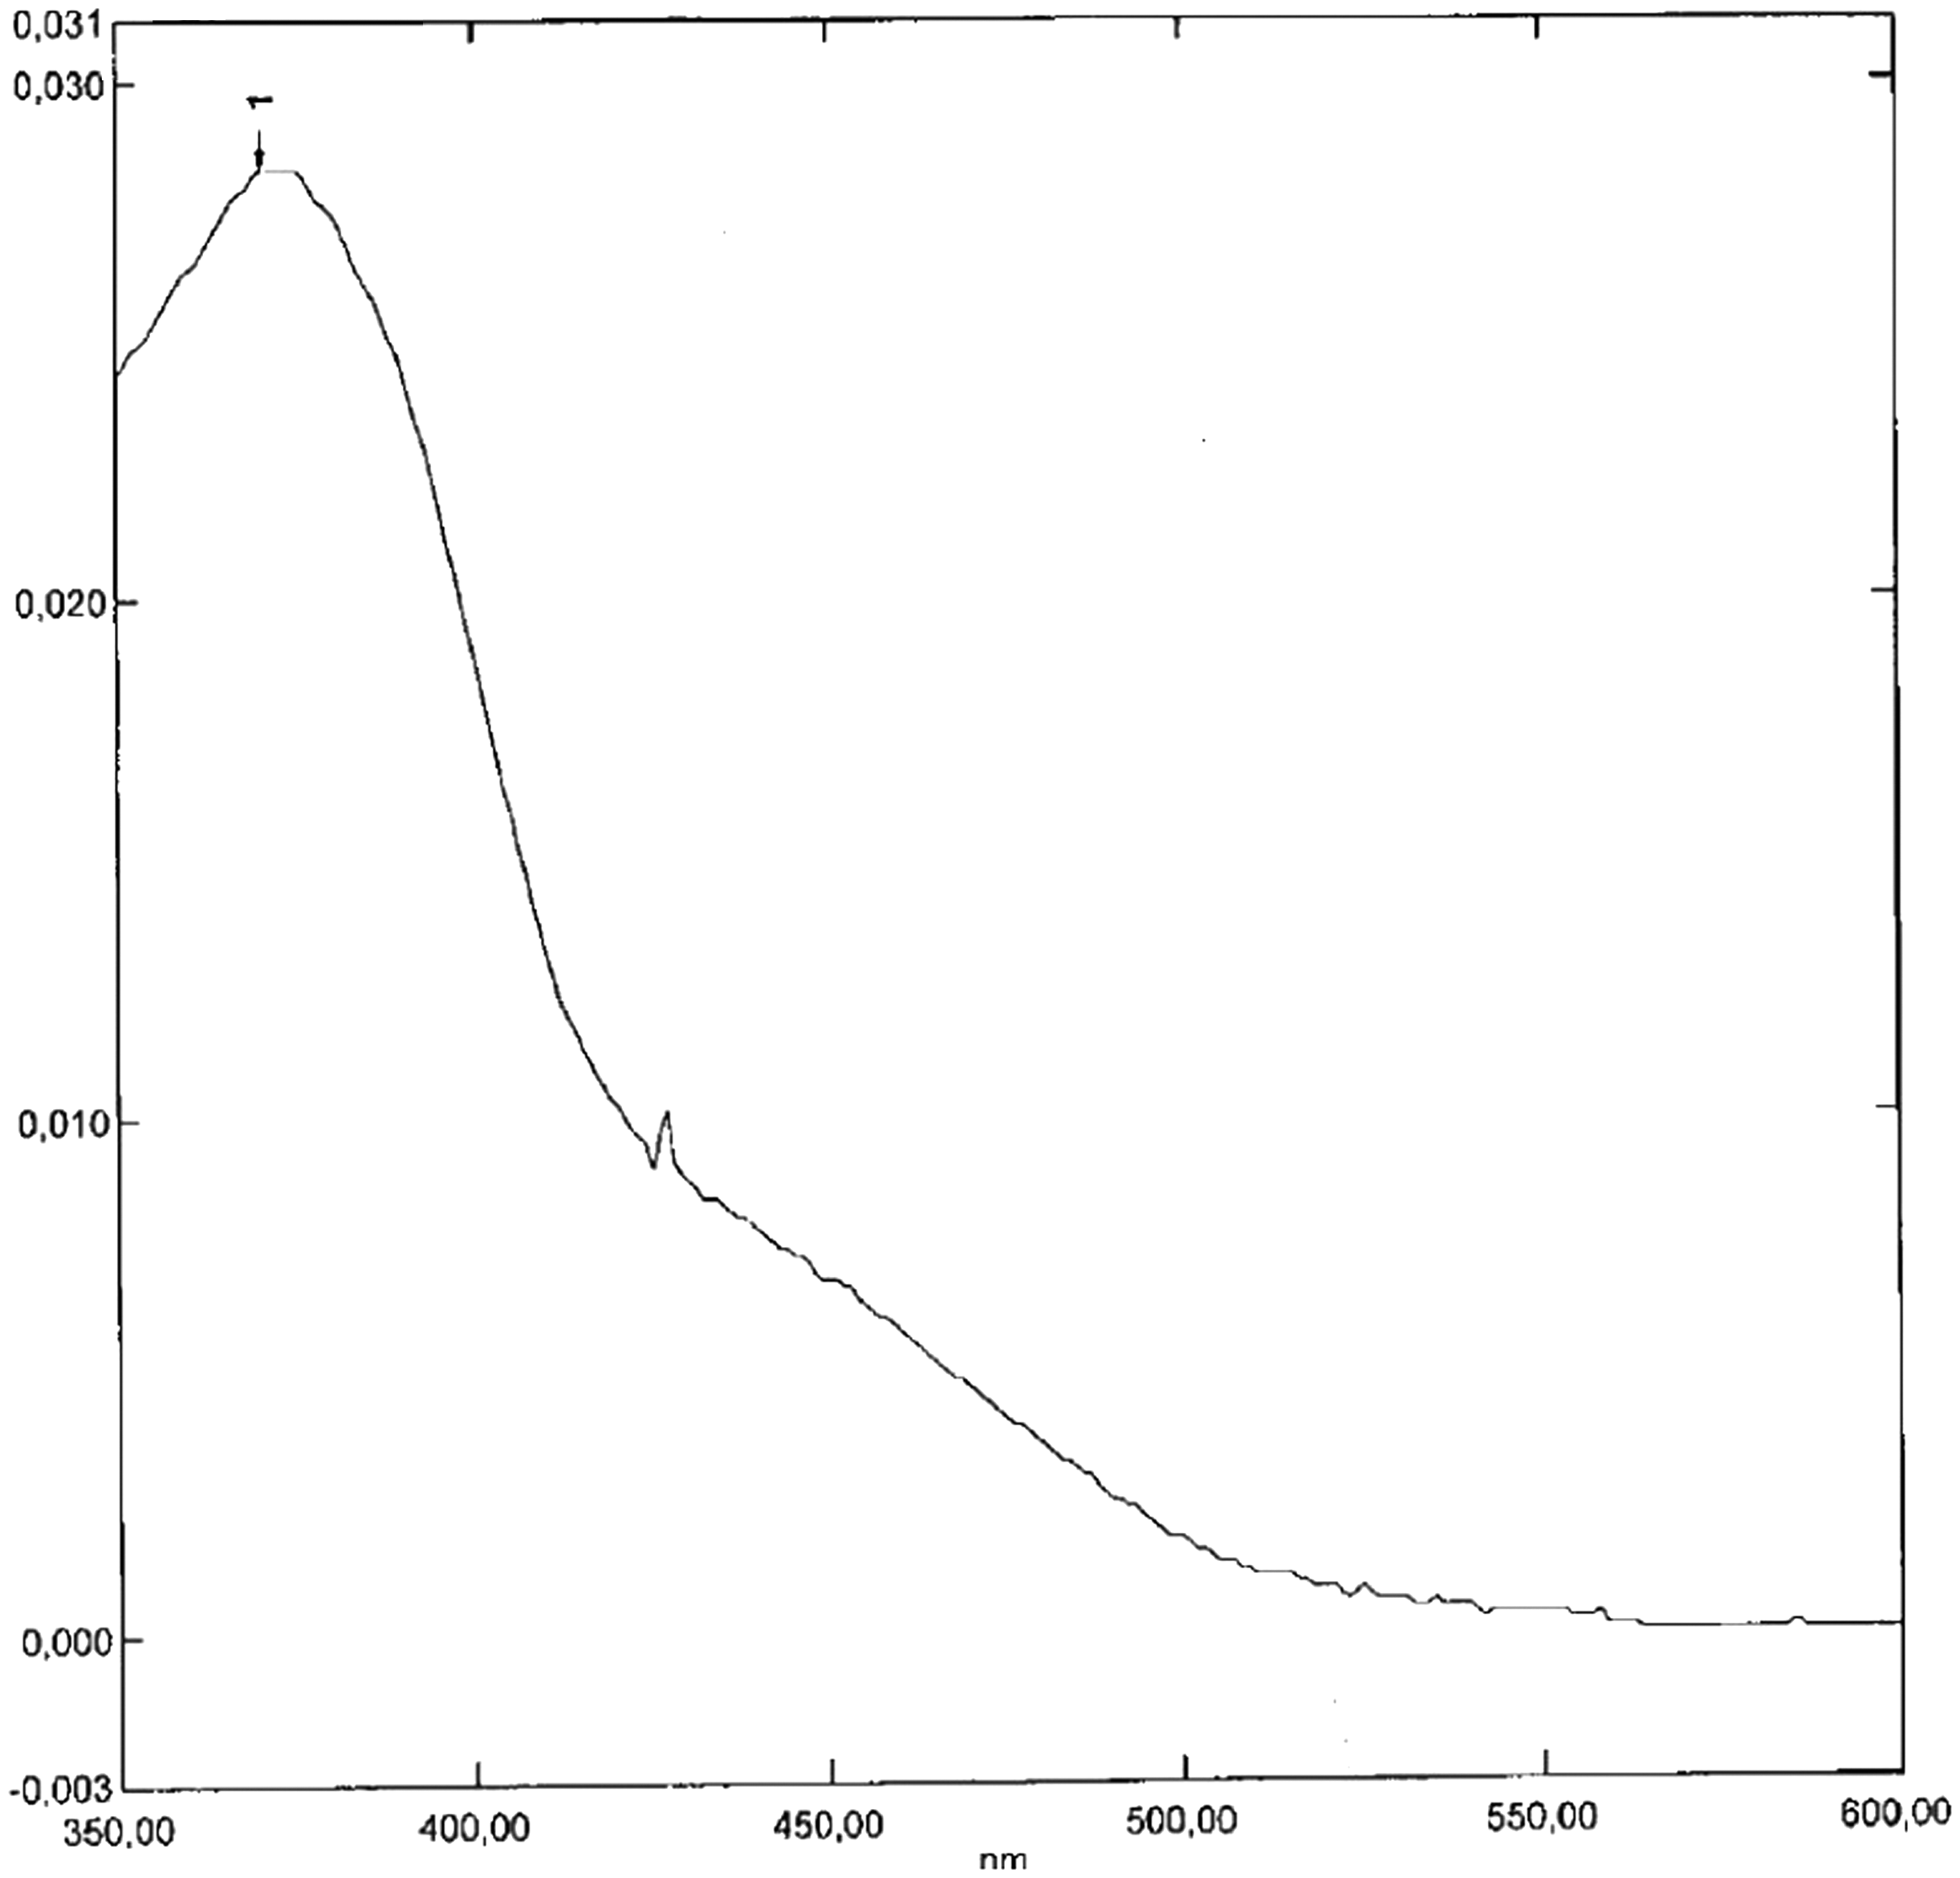
The CSF absorbance curve affected by the interference.
The patient’s symptoms resolved completely over the course of several weeks. There were no sequelae. The final diagnosis was skin infection.
Follow-up
In reference to the described case it was noted that the patient’s medications included doxycycline. On a separate occasion, a similar absorbance peak was found in another patient’s CSF scan at around 375 nm and it was noted that this patient was also being treated with doxycycline. The two patients had no other medications in common. In order to test the theory that doxycycline caused the interfering absorbance peak at around 375 nm, the laboratory archive was searched for absorbance scans with this peak. In total five scans containing this peak were found over the course of one year. In all five cases the patient was being treated with doxycycline at the time the CSF sample was obtained. As doxycycline is known to penetrate the blood–brain barrier, 2 is not metabolized within the body and is known to absorb light with a peak at around 375 nm, 3 it was concluded that the extra peak was most likely due to the presence of doxycycline. Further evidence for this hypothesis was provided through the experimental reproduction of the extra peak affecting the index case, as well as that of the cases discovered in the archive search, by the addition of doxycycline to a CSF sample – see sections Experimental method and Experimental Results below for details. The archive cases affected by the extra absorbance peak all had an infective diagnosis: suspected borrelia infection (cases 2 and 3), sinusitis (case 1), sepsis (case 4) and diverticulitis (case 5). Notably, none of the patients affected by the extra absorbance peak had a diagnosis of SAH either at the time of presentation or on follow-up.
Experimental method
Doxycycline solution: 3 mg doxycycline monohydrate (Sigma-Aldrich), 980 μL distilled water, 20 μL of 1 mol/L HCL. This solution was diluted with distilled water to a concentration of 30 μg/mL doxycycline.
Creation of interference: 1 mL of a CSF sample that was negative for oxyhaemoglobin, negative for bilirubin and with an otherwise normal absorbance scan and with albumin, glucose, erythrocyte and leucocyte cell counts in the normal range (this sample was chosen in order to match that of the index case as closely as possible) obtained from a single patient, was combined with 5 μL of 30 μg/mL doxycycline solution and re-analysed spectrophotometrically between 350 and 600 nm. A further 5 μL of doxycycline solution was then added to the sample and the sample was re-analysed. This process was repeated as shown in the table (see Table 1). These concentrations were chosen to include those in published literature concerning the CSF of patients being treated with oral doxycycline therapy, 0.4–1.9 μg/mL. 2
Sample volumes and resultant concentrations and absorbances obtained.
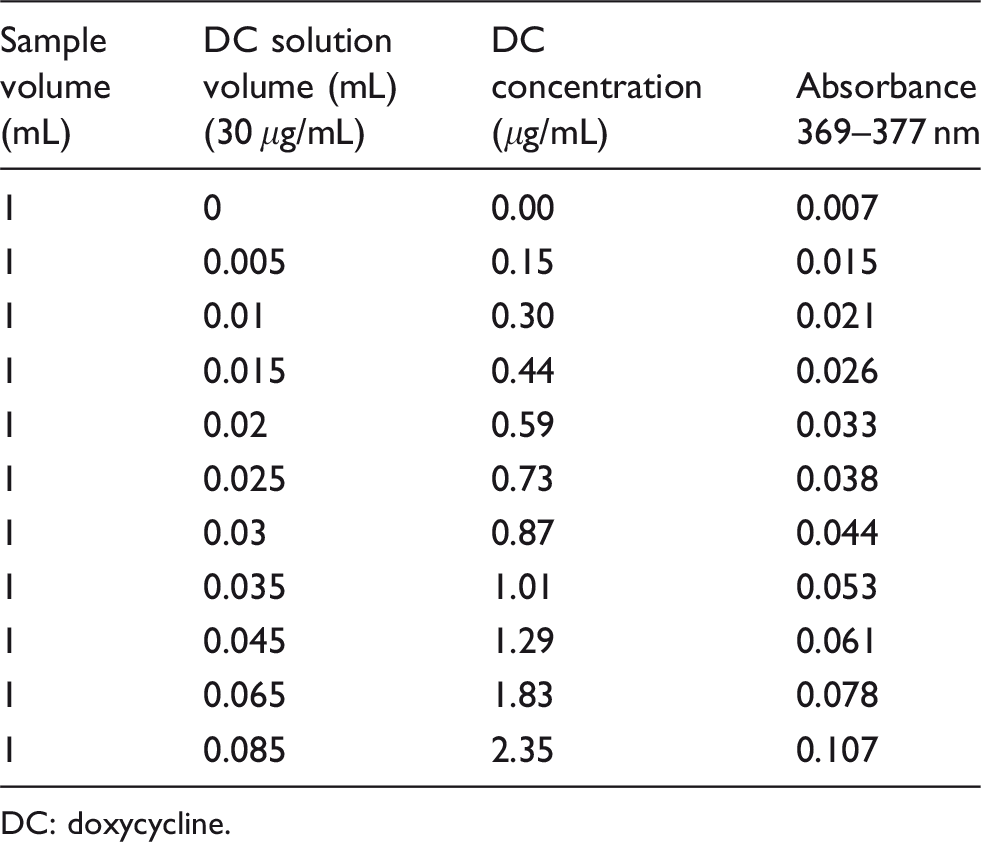
DC: doxycycline.
Experimental results
In each case, apart from the initial baseline analysis, the presence of a peak around 375 nm was noted. The position, height and character of the interfering peak in the index case were reasonably reproduced with a doxycycline concentration of 0.59 μg/mL (see Supplementary Figure 3), a concentration which corresponds well with what would be expected from published literature at the dose and formulation of doxycycline that the patient was taking at the time, 0.6 μg/mL with an oral dose of 200 mg doxycycline per day. 2 Similar reproductions of the peaks from the cases found in the archives were achieved with doxycycline concentrations between 0.44 and 2.35 μg/mL (see Supplementary Figure 3).
Discussion
The curve in Figure 1 may appear to be negative for bilirubin, that is, unsupportive of SAH (see Supplementary Figures 1 and 2 for comparison); however, upon closer examination, it is apparent that it is in fact impossible to draw a tangent as described in the guidelines, and therefore impossible to quantify the net bilirubin absorbance (NBA). In the author’s experience, this problem only affects curves that are artefactual. A repeat analysis was therefore performed, yet yielded an identical result. Also, the instrument, a Shimadzu UV 1800P, appeared to be functioning normally. The author was therefore forced to confront the novel problem of the non-artefactual yet uninterpretable absorbance curve. As the guidelines make no allowance for such curves, consideration was given to the question of whether anything meaningful could be offered in terms of interpretation. It was noted that there was no evidence of a peak in the region of bilirubin’s absorbance maximum (455 nm); also, the absorbance in this region was low, that is, well below 0.01 absorbance units (AU). It was also noted that there was no evidence of an oxyhaemoglobin absorbance peak and that the absorbance in this region (410–418 nm) was well below the UK guidelines cutoff value of 0.02 AU. The sample was visually inspected and noted to be clear and colourless. Although visual examination has been criticized for lack of sensitivity, 4 it remains the standard method of CSF analysis in North America for the purpose of investigation of SAH. These observations led the author to interpret the sample as: negative for bilirubin and oxyhaemoglobin, unsupportive of SAH.
Due to the grave consequences of missing a so-called ‘warning bleed’, the process of interpretation, as well as consideration of the question of whether any interpretation should even be offered, was time consuming and not without stress. As the peak at around 375 nm did not correspond to any of the three pigments that are normally sought in the interpretation of a CSF absorbance curve – bilirubin, oxyhaemoglobin and methaemoglobin – possible alternative explanations were considered. These included instrument malfunction, presence of interfering substance, and the result of an illness affecting the patient. Had the author had the benefit of the evidence of doxycycline as the cause of this interference, interpretation of the absorbance curve might have been much more straightforward.
As to the question of how best to interpret curves affected by the interference at around 375 nm, the author has no general answer. I would recommend taking a clinical history, noting the dose and duration of any doxycycline therapy, careful examination of the absorbance curve and careful inspection of the sample for the presence of xanthochromia, the yellow discolouration that suggests the presence of bilirubin. I hope that a future version of the UK guidelines might mention the issue of doxycycline interference and how best to interpret affected absorbance curves.
Supplemental Material
Supplemental figure1 - Supplemental material for Uninterpretable cerebrospinal fluid absorbance scan caused by doxycycline therapy
Supplemental material, Supplemental figure1 for Uninterpretable cerebrospinal fluid absorbance scan caused by doxycycline therapy by Jan Miller in Annals of Clinical Biochemistry
Supplemental Material
Supplemental figure2 - Supplemental material for Uninterpretable cerebrospinal fluid absorbance scan caused by doxycycline therapy
Supplemental material, Supplemental figure2 for Uninterpretable cerebrospinal fluid absorbance scan caused by doxycycline therapy by Jan Miller in Annals of Clinical Biochemistry
Supplemental Material
Supplemental figure3 - Supplemental material for Uninterpretable cerebrospinal fluid absorbance scan caused by doxycycline therapy
Supplemental material, Supplemental figure3 for Uninterpretable cerebrospinal fluid absorbance scan caused by doxycycline therapy by Jan Miller in Annals of Clinical Biochemistry
Footnotes
Acknowledgements
I would like to thank Johan Kumlien, Andreas Hillarp, Bengt-Åke Johansson and Stefan Lönn for their assistance and guidance.
Declaration of conflicting interests
The author(s) declared no potential conflicts of interest with respect to the research, authorship, and/or publication of this article.
Funding
The author(s) received no financial support for the research, authorship, and/or publication of this article.
Ethical approval
This study was approved by Regionala Etikprövningsnämnden Lund (Sweden), Dnr 2018/774. Patient consent was not obtained because the article contains very little clinical information and no data that could be used to identify a patient.
Guarantor
JM.
Contributorship
JM researched literature, conceived the study, collected data, interpreted data, wrote the first draft and reviewed the manuscript.
References
Supplementary Material
Please find the following supplemental material available below.
For Open Access articles published under a Creative Commons License, all supplemental material carries the same license as the article it is associated with.
For non-Open Access articles published, all supplemental material carries a non-exclusive license, and permission requests for re-use of supplemental material or any part of supplemental material shall be sent directly to the copyright owner as specified in the copyright notice associated with the article.