
Abstract
Background
As part of the Survey of Health, Ageing and Retirement in Europe (SHARE) study, dried blood spot samples were obtained for measurement of potential biological biomarkers, among those vitamin D. Unfortunately, no studies describe the impact of high temperatures on dried blood spot samples and vitamin D measurements.
Materials and methods
Capillary samples were collected on dried blood spot cards from 40 outpatients (median age 78 years) along with venous blood samples. To mimic the different environmental and temporal challenges during collection and shipment until final storage in the SHARE study, dried blood spot cards were stored at different temperatures, at time span and with/without freeze-thaw. Vitamin D concentrations in venous plasma samples were measured by conventional immunoassay (on Architect i2000SR), while vitamin D concentrations in dried blood spot samples were measured using LC-MS/MS with a well-described extraction method and with relevant calibration and comparison with a reference method.
Results
Vitamin D measured in dried blood spot samples did not differ significantly from venous plasma measurements under the different storage conditions tested. The optimal vitamin D correlation between the two matrices was by storage at either 21°C or 35°C for four days (r = 0.9060 and 0.9026, respectively). Freeze-thaw of the dried blood spot samples did not have any significant effect.
Conclusion
We find that vitamin D measured in dried blood spot samples do not differ significantly from venous plasma measurements despite storage at different temperatures and freeze-thaw, which enables the use of dried blood spot in multicentre studies taking place under alternating temperature conditions.
Introduction
The use of dried blood spots (DBS) is increasing as they are easy to obtain, transport and store. 1 As part of a large European ageing research study, the Survey of Health, Ageing and Retirement in Europe (SHARE), where multinational, cross-disciplinary longitudinal data on health and socio-economic conditions are collected in people aged 50 years or older, 2 DBS samples are obtained to facilitate measurement of potential biological biomarkers. A number of known biomarkers has been shown feasible to measure in DBS samples, e.g. HbA1c, 3 C-reactive protein, 4 trace elements 5 and vitamin D. 6 The latter has gained considerable interest in the last decade, as studies have indicated an association between vitamin D deficiency and different conditions, e.g. cancer, depression, diabetes, and falls tendency, 7 just to mention a few. Also, vitamin D remains an important marker for bone remodelling and of course risk of osteoporosis, and it is therefore highly relevant to investigate in an ageing survey like the SHARE.
Differences between vitamin D measurements in venous blood and DBS samples have previously been described, e.g. by Heath et al., 8 who also suggested a correction formula to allow the use of standard reference ranges. Recently, quantitation of 25-hydroxyvitamin D in DBS by 2D LC-MS/MS was demonstrated without derivatization, also with an acceptable correlation with serum in adult and paediatric patients. 9 A number of methodological concerns regarding vitamin D measurements in DBS samples has been investigated, mostly involving liquid chromatography-tandem mass spectrometry8,10 and different aspects affecting this,11–13 but also the impact of the sampling technique. 14 Seasonal variation has been described for vitamin D concentrations measured in DBS samples, 8 but the study did not investigate whether this was due to the well-known seasonal variation in vitamin D, or whether it partly could be due to a preanalytical factor caused by temperature differences during sampling. Of note, a direct effect on blood samples due to light exposure (as for e.g. vitamin A and bilirubin) has not been described for vitamin D. As the SHARE study is conducted in Israel and in many countries in Europe, from Sweden in the north to Malta and Cyprus in the south, DBS samples are collected at considerably different temperatures. Unfortunately, no studies describe the impact of high temperatures on DBS samples in general and vitamin D measurements in particular. A study was therefore conducted to elucidate this aspect.
Materials and methods
Study population
A total of 40 participants, 31 women and 9 men (median age 78 years, range 62–95 years), were consecutively recruited from the outpatient Falls Clinic at the Geriatric Department, Odense University Hospital, Denmark, in the period June–July 2013. None of the patients were seriously ill at the time of inclusion, and cognitively impaired patients were excluded. The study was approved by The Regional Ethical Committee in Southern Denmark (Document S-20120052) and was conducted in accordance with the Helsinki Declaration's Code of Ethics. All participants received written information and signed a written consent statement, which they were able to withdraw at any time.
Blood sampling
Capillary blood was obtained from the participant’s fingertip using a microtainer contact-activated lancet (Becton Dickinson, New Jersey, USA), and drops of blood were collected on Whatman 903 protein saver cards (GE Healthcare, Little Chalfont, UK), which is adherent to the Clinical & Laboratory Standards Institute (CLSI) guideline NBS01-A6 15 and approved by the Food and Drug Administration (FDA) and the Centers for Disease Control and Prevention. 16 To avoid differences in filter paper, the same paper lot was used for all samples. Venous blood was collected by antecubital venipuncture in Vacutainer EDTA tubes (Becton Dickinson, New Jersey, USA), centrifuged at 2000g for 10 min and analysed immediately for vitamin D by a conventional immunoassay (as described below).
DBS cards
To mimic the different environmental and temporal challenges during collection and shipment until final storage in the SHARE study, nine DBS cards were constructed for each patient as shown in Table 1. All DBS cards were air-dried for 3 h, DBS cards 1–3 at room temperature, and DBS cards 4–9 at 35°C in an incubator. As also shown in Table 1, the DBS cards were incubated for different time spans; e.g. DBS-1 cards were stored at room temperature (21°C) during the initial four days, while DBS-4 cards were incubated at 35°C for 24 h, followed by incubation at room temperature for three days and then frozen. After incubation, all DBS cards were stored separately in a Zip-Lock® bag with a desiccant at −80°C until analysis.
Storage of dried blood spots until analysis.
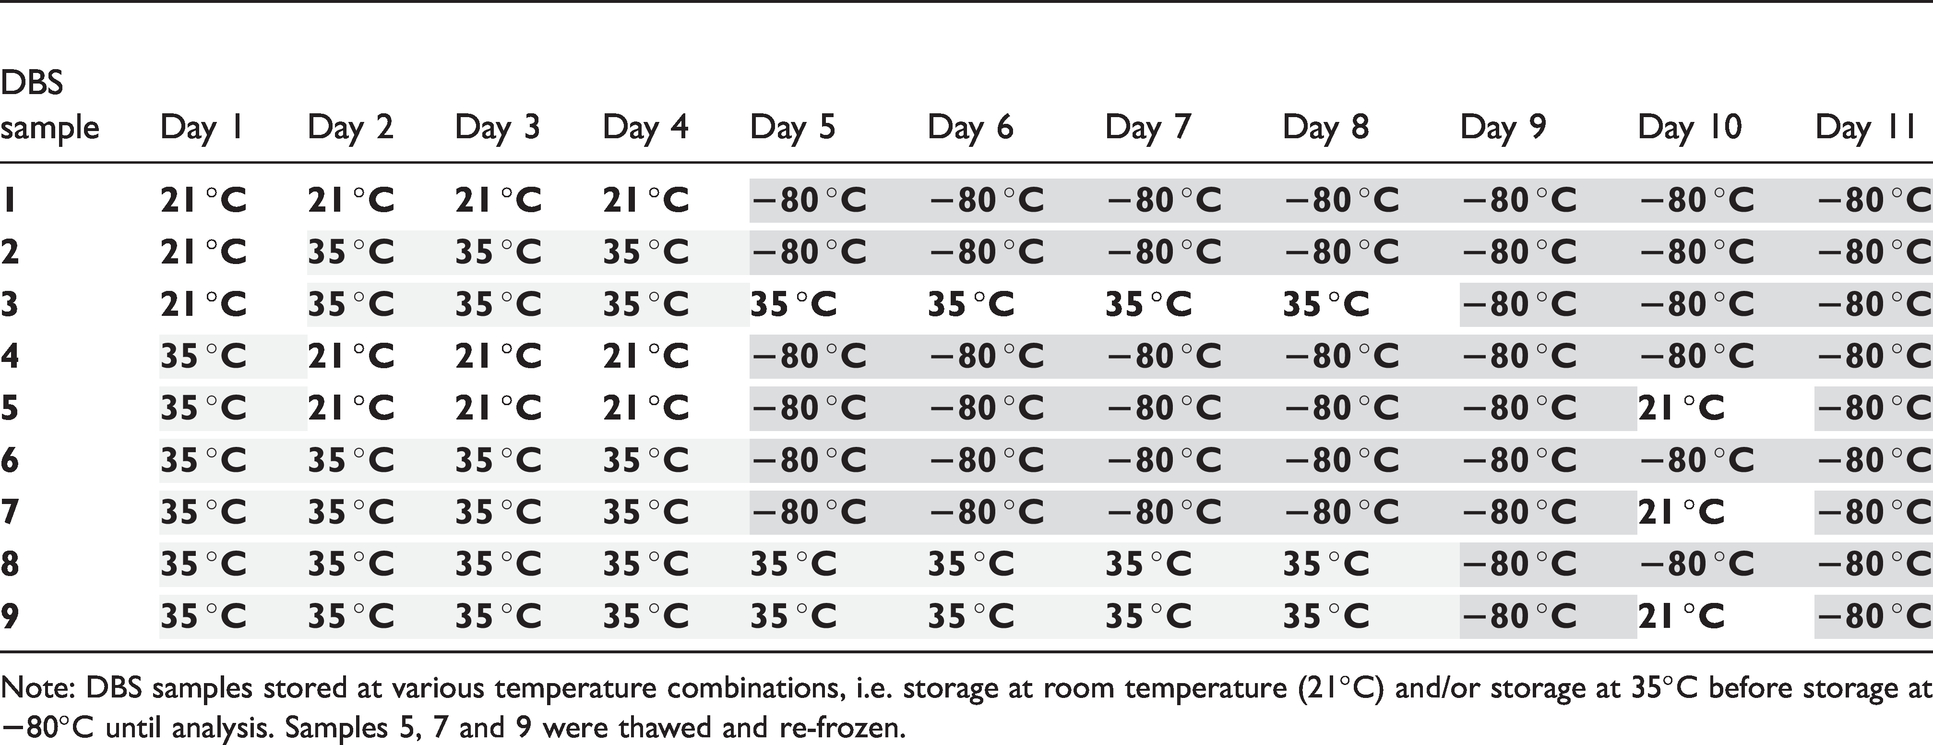
Note: DBS samples stored at various temperature combinations, i.e. storage at room temperature (21°C) and/or storage at 35°C before storage at
Vitamin D measurement in venous samples
Vitamin D was measured in venous samples by a delayed 1-step Chemiluminescent Microparticle Immunoassay (CMIA) with automated online pre-treatment at an Architect i2000SR (Abbott, Chicago, IL) using reagents provided by the supplier. All samples were measured within an hour of blood sampling. The analytical CV was 3.8% at 48 nmol/L (19 ng/mL) and 2.8% at 196 nmol/L (78 ng/mL). The Architect Vitamin D assay has a correlation coefficient of 0.9 with LC-MS/MS and a Passing and Bablok fit of (−1.45 + 1.01×) (information provided by the company).
Vitamin D measurement in DBS samples
DBS LC-MS/MS extraction procedure
The extraction procedure was performed in Eppendorf tubes. For two 3.2 mm punches, 5 µL 50 nmol/L 25-OH-Vitamin D3-d3 in methanol were added and subsequently 75 µL MilliQ water for hydration of the filter paper. Acetonitrile, 250 µL, was added to precipitate proteins, whereafter punches were sonicated for 30 min followed by centrifugation at 3200g for 10 min. A volume of 230 µL of the clear top layer was evaporated to dryness by a stream of dry N2, and 50 µL 4-phenyl-1,2,4-triazoline-3,5-dione (PTAD) (0.1 mg/mL in acetonitrile) was then added to derivatize 25-OH-Vitamin D. After 20 min at room temperature, 100 µL ethanol was added to quench remaining PTAD. The organic solvent was removed by evaporation with N2 and finally, samples were reconstituted in 100-µL acetonitrile:water (50:50 v/v); 20 µL was used for LC-MS/MS analysis.
Calibration and quality control samples
Blood was collected in an open system without additives and spotted on Whatman 903 filter paper within 10 min (without any apparent clotting). The filter paper was allowed to dry overnight and stored in zip-sealed plastic bags at room temperature for maximum three weeks and at all times light protected. A total of 10 volunteers was screened and tested for 25-OH-Vitamin D3 and one was selected as reference for the one-point calibration and three others were selected for quality control (QC) samples. Reference and QC values were set by the LC-MS/MS reference method.
LC-MS/MS reference method
For optimal calibration of the PTAD LC-MS/MS method, we used a NIST 972-calibrated LC-MS/MS method performed on a Thermo Scientific TLX1 system connected to a Thermo Scientific Discovery Ultra TSQ as previously described. 17 Serum samples were added triple deuterium-marked 25-OH-Vitamin D3 as internal standard and deproteinized with ZnSO4 in methanol and then centrifuged at 3200g for 10 min. The supernatant was transferred and injected (100 µL) on the TurboFlow LC-MS/MS. 25-OH-Vitamin D2 and D3 was concentrated on a Thermo Scientific Cyclone P 50 × 1.0 mm column and backflushed on the analytical Phenomenex Gemini column C18 50 × 3.0 mm. 25-OH-Vitamin D2 and D3 was eluted from the analytical column by a gradient with mobile phases A: 10 mM NH4Ac in water, and B: 10 mM NH4Ac in methanol. 25-OH-Vitamin D2 and D3 were spiked in 25-OH-Vitamin D2 and D3-freed human serum in appropriate amounts to produce a six-point calibration curve (weighed 1/x2) and three levels of QC samples: Low at 13 nmol/L, medium at 46 nmol/L and high at 93 nmol/L with CV% of 8.5, 6.1 and 7.2, respectively.
Multiple reaction monitoring (MRM) for the LC-MS/MS reference method was:
25-OH-vitamin D3: 383.3 m/z → 159.0 m/z; 211.1 m/z; 257.2 m/z
d3-25-OH-vitamin D3: 386.3 m/z → 214.1 m/z; 257.2 m/z; 258.2 m/z; 368,3 m/z
PTAD LC-MS/MS method for DBS measurements
The concentrations of DBS 25-OH-Vitamin D were determined on a Thermo Scientific TLX1 system connected to a Thermo Scientific Discovery Ultra TSQ operated in LX-mode. PTAD derivatized 25-OH-Vitamin D2 and D3 was eluted from the analytical column (Phenomenex Gemini column C18 50 × 3.0 mm.) by a gradient with mobile phases A: 0.1% Formic acid in water, and B: 0.1% Formic acid in methanol.
QC-DBS was manufactured similar to calibration DBS and target was set using identical procedure to calibration DBS. Acceptance criteria for QC in a sequence were max 15% deviation from target (which is standard procedure). QC was at three levels (low: 34 nmol/L, mid: 80 nmol/L and high: 110 nmol/L).
Multiple reaction monitoring (MRM) for the PTAD method was:
PTAD-25-OH-vitamin D3: 558.3 m/z → 280.2 m/z; 298.3 m/z
PTAD-d3-25-OH-vitamin D3: 561.3 m/z → 283.2 m/z; 301.0 m/z
Statistical analyses
Shapiro–Wilk’s test revealed that data were non-normally distributed, and non-parametric tests were therefore applied. Spearman’s correlation test, ANOVA, Mann–Whitney U-test and linear regression analysis were all performed using GraphPad Prism version 8.0 (GraphPad Software, San Diego, California, USA).
Results
As shown in Table 2, the median vitamin D concentration in the venous samples was 68.0 nmol/L (IQR 41.0–79.0 nmol/L) with a range of 15.0–119 nmol/L. Overall, median vitamin D concentrations in the DBS samples were higher (ranging from 71.5 to 77.0 nmol/L) and with a considerably larger concentration span than for the venous samples (overall 14.0–226.0 nmol/L). Despite those differences, vitamin D concentrations in the DBS samples did not differ significantly from the concentrations measured in venous samples (Mann–Whitney: P > 0.1 for all sample types), and a Kruskal–Wallis test confirmed that the data sets did not differ statistically (P = 0.9995). Although statistically insignificant, we did observe differences in how much DBS sample concentrations differed from those measured in plasma samples: More specifically, the smallest difference from the venous plasma vitamin D-concentrations was observed in DBS-1 kept at 21°C until freezing, while the most pronounced difference was seen in DBS-8 and 9 kept at 35°C for eight days until freezing.
Correlation between vitamin D concentrations.
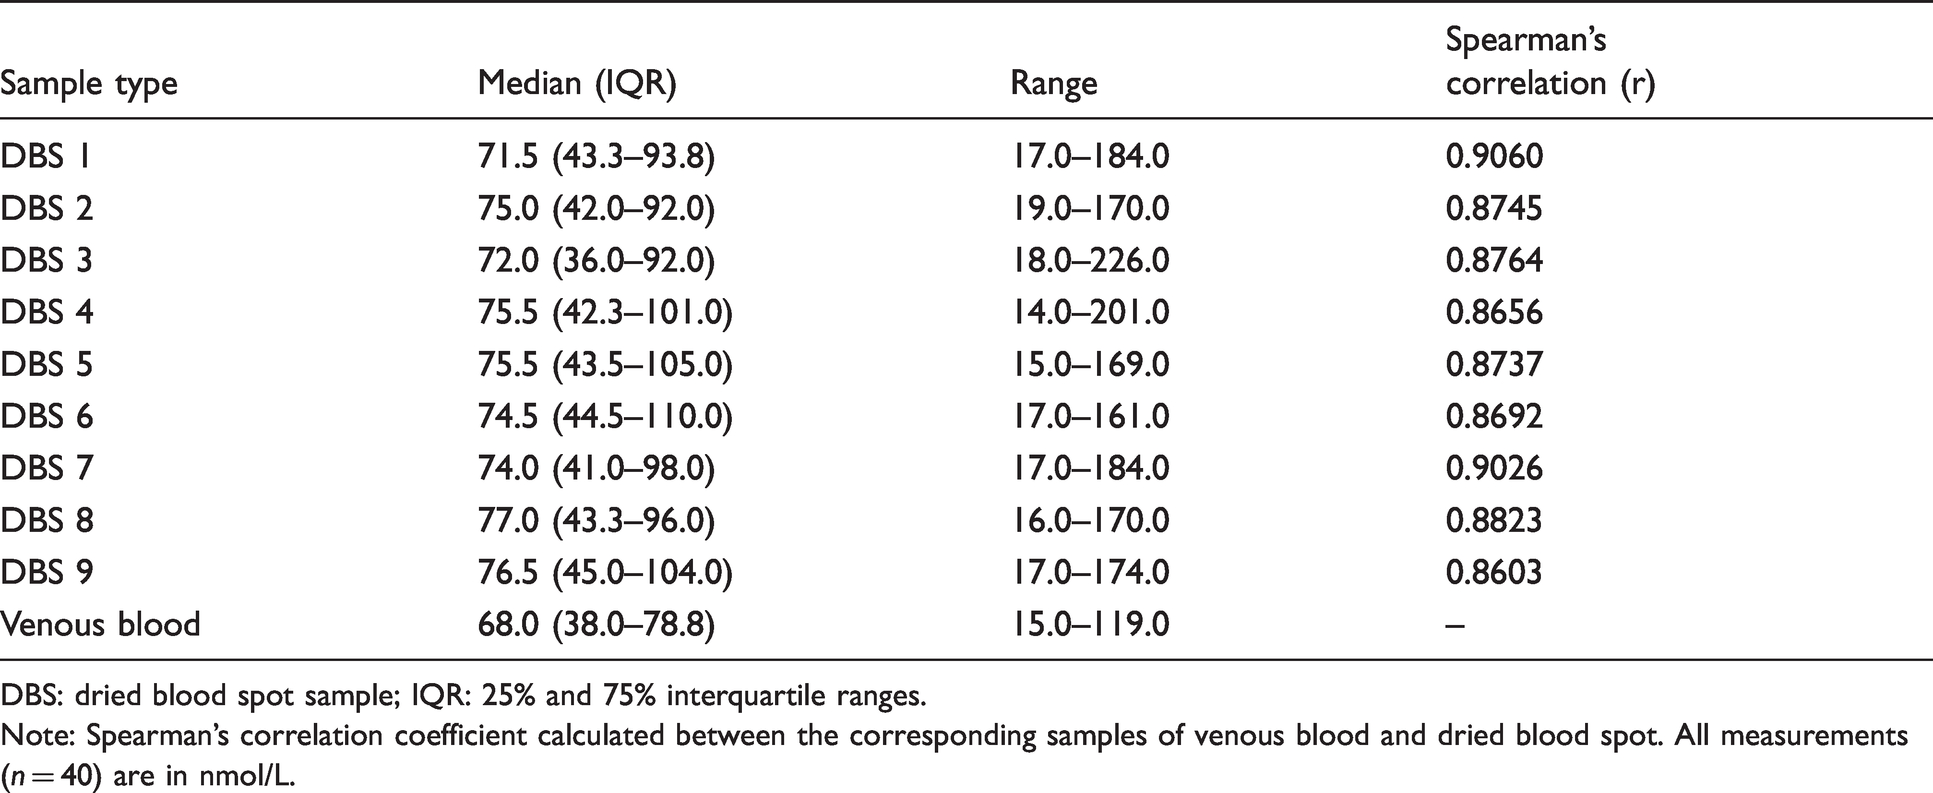
DBS: dried blood spot sample; IQR: 25% and 75% interquartile ranges.
Note: Spearman’s correlation coefficient calculated between the corresponding samples of venous blood and dried blood spot. All measurements (n = 40) are in nmol/L.
The linear regression between venous and DBS samples is shown in Figure 1. All correlations (Table 2) were good (r-values ranging from 0.8603 to 0.9060), and all DBS types correlated significantly with the venous vitamin D measurements. The strongest correlations were between venous vitamin D measurements and DBS-6, followed by DBS-1, 8 and 9, while the weakest correlation was between venous vitamin D measurements and DBS-3 and less weak with DBS-4. The samples with the strongest correlations were those stored either at 21°C or 35°C for four days prior to freezing (r = 0.9060 and 0.9026, respectively), while those with the weakest correlations were stored at 35°C for seven days prior to freezing (r = 0.8603).
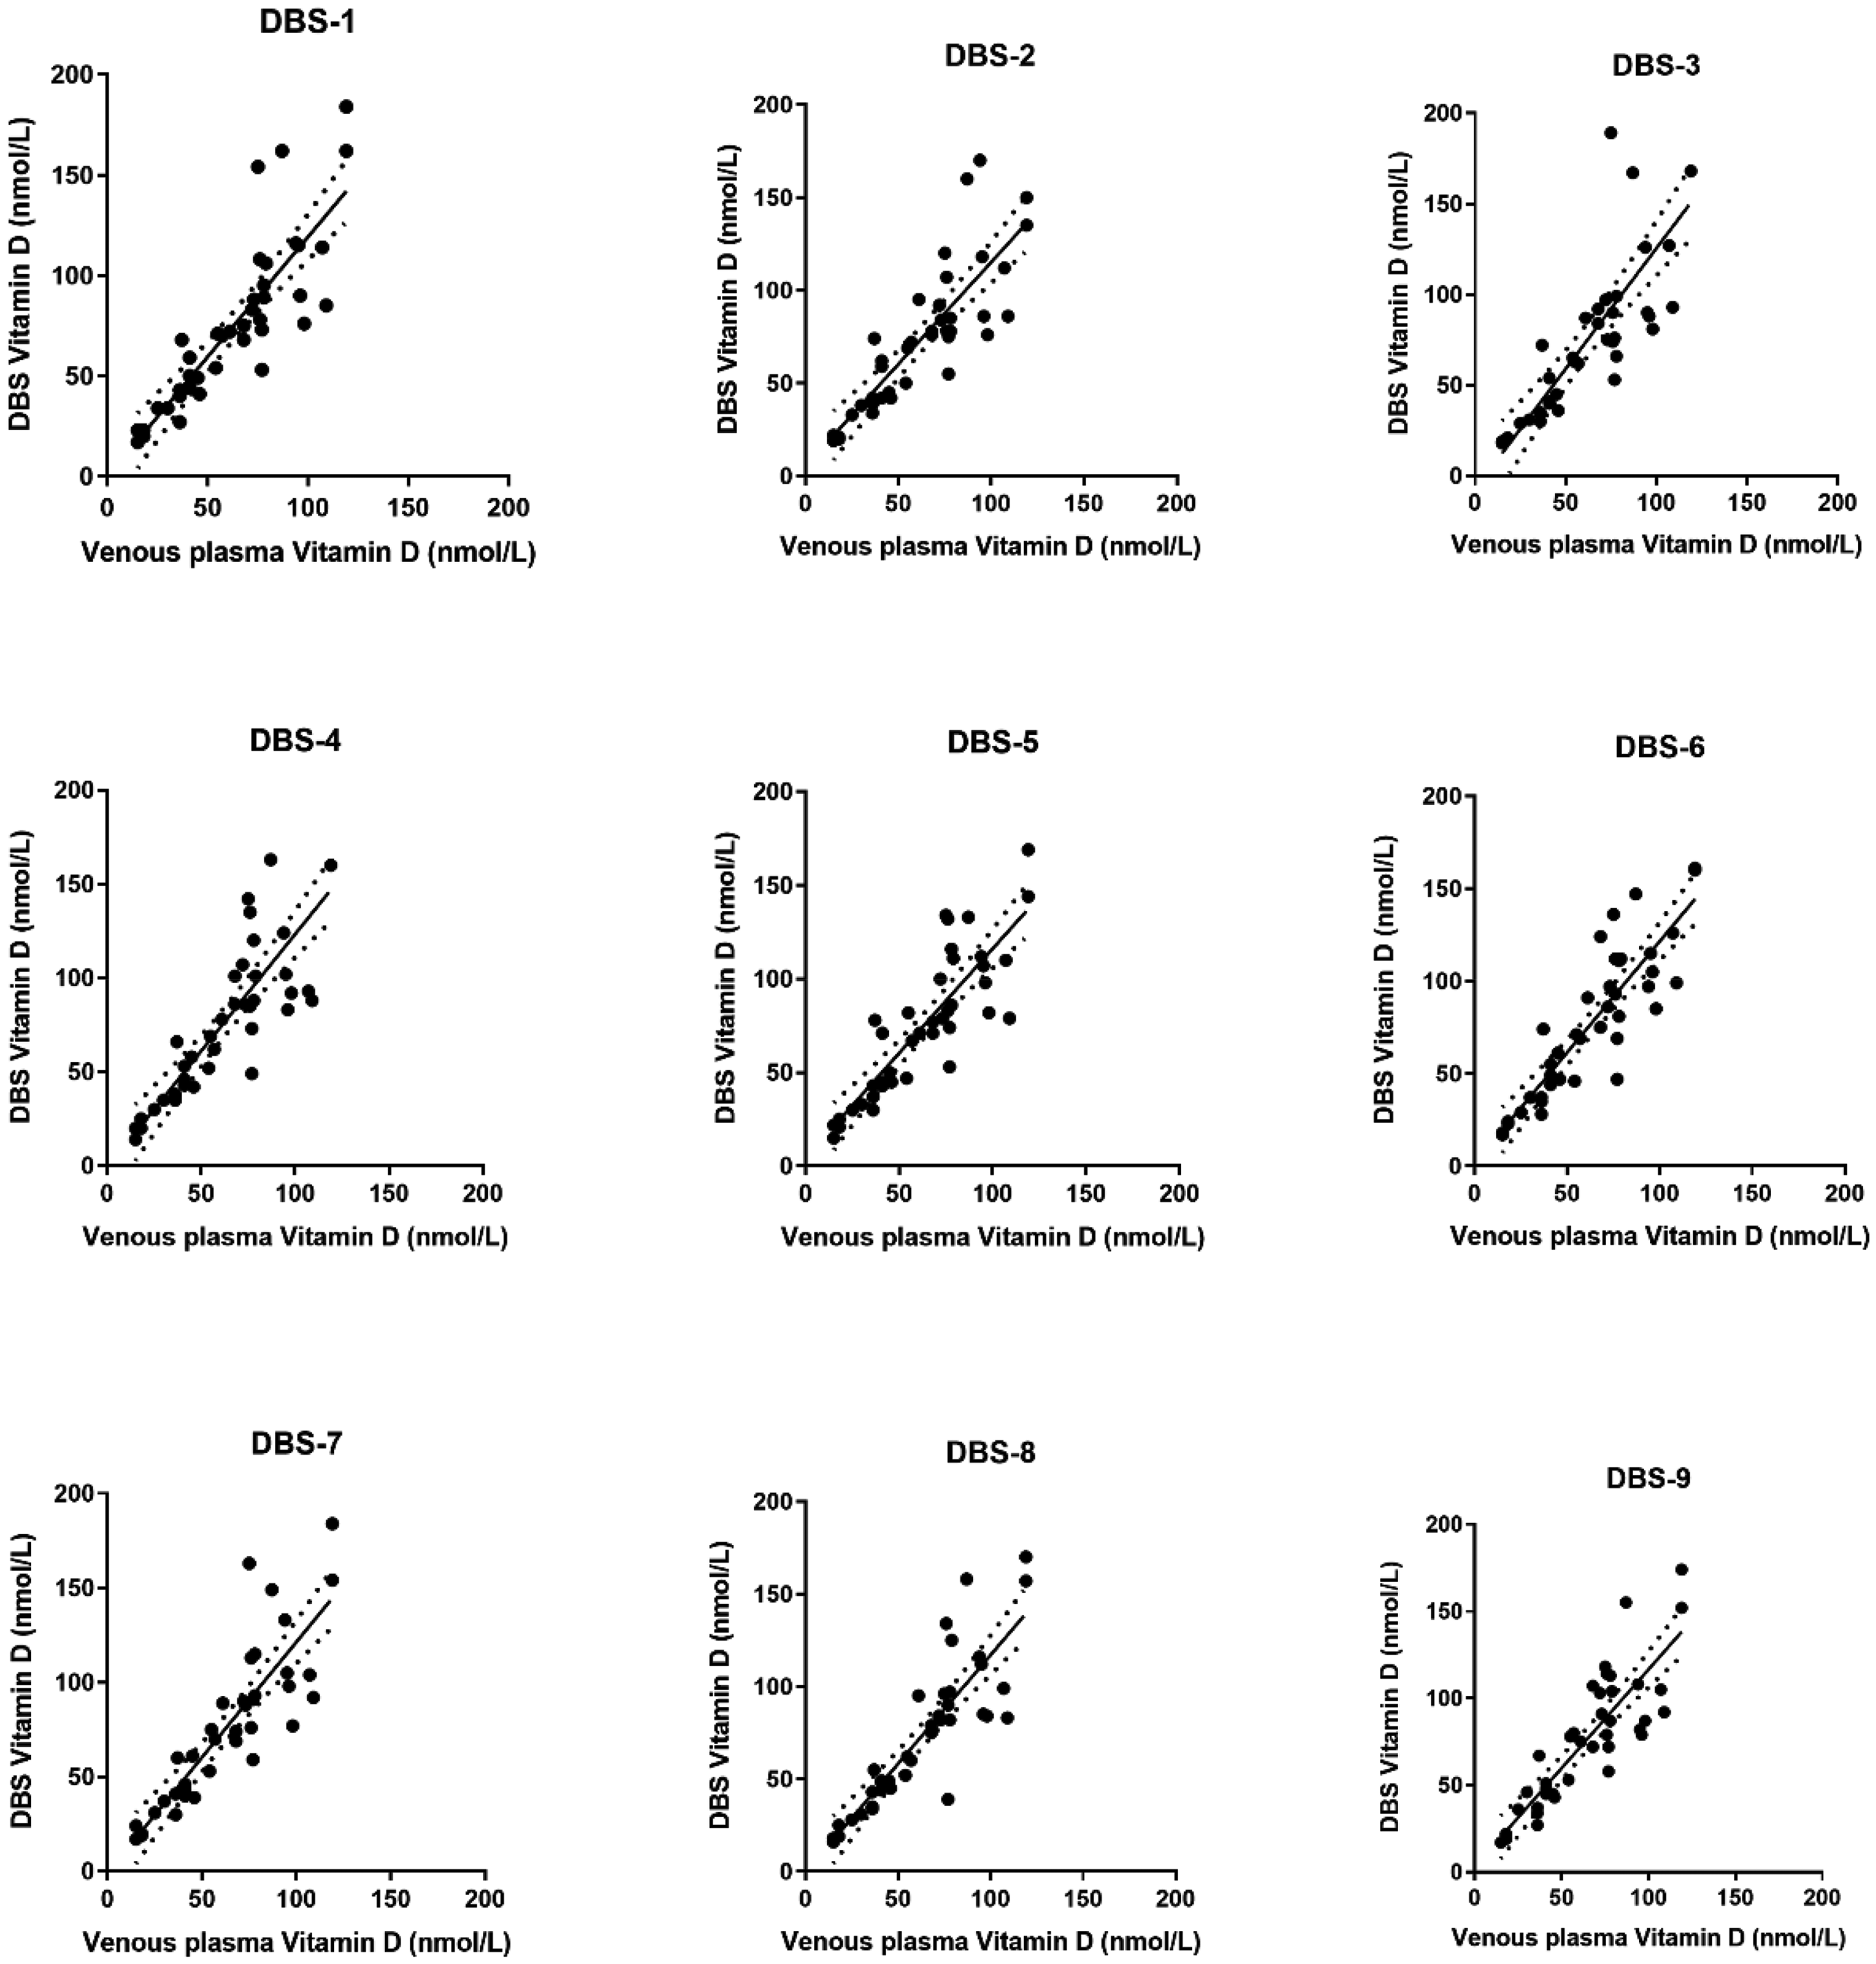
Linear regression between vitamin D concentrations in venous samples and dried blot spots. Each plot depicts the venous vitamin D measurements (X axis) compared to measurements in the nine different groups (Y axis). All measurements are in nmol/L. All correlations were statistically significant (P < 0.0001).
Freeze-thaw-freeze of DBS samples did not alter the vitamin D concentrations significantly when comparing the samples stored identically except for the freeze-thaw procedure (i.e. DBS-4 vs. 5, DBS-6 vs. 7 and DBS-8 vs. 9).
Discussion
Our results indicate that vitamin D measured in DBS samples do not differ significantly from venous plasma measurements under the different storage conditions tested. It is however important to stress that measurements in those two matrices cannot be compared directly, as their dynamics (rise and fall) and specially the high values behave quite differently. This will be discussed more in detail. We furthermore found that the DBS samples, where vitamin D measurements correlated best with venous samples were stored at either 21°C or 35°C for four days. Importantly, freeze-thawing of the samples did not have any significant effect on those correlations.
The finding that vitamin D concentrations measured in DBS samples did not differ significantly from venous plasma measurements are somehow surprising, as DBS measurements were performed by LC-MS/MS (usually considered the gold standard), while plasma measurements were performed with our routine method, a commercial immunoassay. Those two methods are known to give alternating values, but we chose this approach because the automated immunoassay is the method of choice for high-throughput production, e.g. for the SHARE project involving 60,000 samples. A slight discrepancy between the two types of vitamin D measurements was therefore expected. Other studies, e.g. Heath et al., 8 found a significant difference and they therefore developed a calibration model to enable conversion of DBS measurements to equivalent plasma measurements. Importantly, we found a significant correlation between the two measurements, which also is compatible with findings by others,8,12,13 and a good correlation indeed supports the use of a conversion.
Others have also found differences between vitamin D measurements in plasma and DBS,9–13 and this combined with the (although insignificant) differences we found in median vitamin D levels (68 nmol/L in plasma compared to 71.5–77.0 nmol/L in DBS) stresses the importance of not comparing these concentrations directly. It is also important to note that a range of factors are related to the differences between the two matrices (plasma and DBS) investigated here: There are many preanalytical conditions to be aware of, e.g. the number of blood drops applied on the filter paper, the humidity during the sampling, the patient haematocrit value and use of anticoagulants, which all can affect the analysis result. A standard procedure including retrieval of the necessary information on this matter is therefore mandatory. And despite a number of recommendations on how, e.g., punching and extraction from DBS cards should be performed, 18 , 19 a standardized international protocol does unfortunately not exist for the entire process on this matter.
Altogether, it is therefore imperative that specific decision levels and/or limit values are established for DBS samples if these are to be used in a clinical setting. Despite differences in levels, it will, however, be possible to compare values between individuals and to monitor vitamin D levels over time using DBS samples. A more comprehensive study is, however, needed to assure this comparison throughout the entire measurement spectrum.
Alternating storage temperatures did not impact the vitamin D measurements significantly. Nevertheless, we did find some storage conditions to be more favourable than others. Those differences were however insignificant, and the conclusion is therefore that vitamin D concentrations in DBS are not affected by temperature during sample storage unlike what is known for a number of other analytes in common blood samples (e.g. potassium). Therefore, the use of DBS samples seems highly appropriate in a multicentre study, where the temperature conditions can differ from −10 to 15°C in the Nordic countries to 35–40°C on a hot summer day in Southern Europe and Israel.
In general, there are concerns regarding freeze-thaw procedures that tend to have an effect on different analytes due to enzymatic degradation of the protein of interest. A recent study showed that freeze-thaw cycles could significantly influence the variability for quantitation of dihydroxy-metabolites in human serum and should therefore be limited, 20 while plasma measurements of fibroblast growth factor 23 were not affected despite five freeze-thaw cycles. 21 It is therefore important to investigate the impact of this procedure, and especially when a new matrix is used for a well-known analyte as it is the case here. We were therefore satisfied to discover that the freeze-thaw cycles did not affect the vitamin D measurements in DBS samples.
The reference method (NIST LC-MS/MS) was not used for all analyses because it is far more laborious and we found it scientifically safe to assure the comparison with our routine PTAD LC-MS/MS-method. Interestingly, our study indicated that the assay performance of the Architect immunoassay does not seem as impeccable at high concentrations as stated by the manufacturer, but this notion of course needs to be studied more thoroughly on plasma samples with high concentrations.
A strength of the study is that the studied population is a very likely representative for the SHARE population, as they matched in age, included both diabetics and non-diabetics and were falls patient with no overt acute diseases, which could have influenced the sampling and the analyses.
In conclusion, we find that vitamin D measured in DBS samples do not differ significantly from venous measurements despite storage at different temperatures and freeze-thaw, which enables the use of DBS in multicentre studies taking place under alternating temperature conditions.
Footnotes
Declaration of conflicting interests
The author(s) declared no potential conflicts of interest with respect to the research, authorship, and/or publication of this article.
Funding
The author(s) disclosed receipt of the following financial support for the research, authorship, and/or publication of this article: The SHARE data collection has been funded by the European Commission through FP5 (QLK6-CT-2001–00360), FP6 (SHARE-I3: RII-CT-2006–062193, COMPARE: CIT5-CT-2005–028857, SHARELIFE: CIT4-CT-2006–028812), FP7 (SHARE-PREP: GA N°211909, SHARE-LEAP: GA N°227822, SHARE M4: GA N°261982) and Horizon 2020 (SHARE-DEV3: GA N°676536, SERISS: GA N°654221) and by DG Employment, Social Affairs & Inclusion. Additional funding from the German Ministry of Education and Research, the Max Planck Society for the Advancement of Science, the U.S. National Institute on Aging (U01_AG09740-13S2, P01_AG005842, P01_AG08291, P30_AG12815, R21_AG025169, Y1-AG-4553–01, IAG_BSR06-11, OGHA_04-064, HHSN271201300071C) and from various national funding sources is gratefully acknowledged (see ![]() ).
).
Ethical approval
The study was approved by The Regional Ethical Committee in Southern Denmark (Document S-20120052).
Guarantor
MN.
Contributorship
MN and KAR researched literature and conceived the study. All authors were involved in protocol development, while KAR gained ethical approval and patient recruitment. Data analysis was performed by MN and PF. MN wrote the first draft of the manuscript. All authors reviewed and edited the manuscript and approved the final version of the manuscript.