
Abstract
Background
Abnormalities of iron metabolism in pregnancy pose risks for maternal and fetal health. Robust reference intervals for iron metabolism indices have not been established in a pregnant Chinese population. The purpose of this study was to derive reference intervals for indices of iron metabolism during pregnancy in a Chinese population.
Methods
A total of 360 healthy pregnant women were recruited and divided into three groups of 120 by gestational age: first trimester (1–13 weeks), second trimester (14–27 weeks) and third trimester (≥28 weeks). An additional 120 healthy non-pregnant women were recruited as the non-pregnant control group. Serum ferritin was measured by electrochemiluminescence immunoassay. Serum iron and total iron-binding capacity were measured by a direct bathophenanthroline method. Transferrin saturation value was calculated with formula TS = SI/TIBC. The reference intervals were established using a non-parametric method.
Results
In first and second trimesters (combined), the reference intervals for serum ferritin, serum iron, total iron-binding capacity and transferrin saturation are 14.7–184.3 mg/L, 14.50–33.45 µmol/L, 36.53–68.81 µmol/L and 19.04–64.76%, respectively. In the third trimester, the reference intervals for serum ferritin, serum iron, total iron-binding capacity and transferrin saturation are 7.2–122.2 mg/L, 5.83–21.52 µmol/L, 49.40–122.76 µmol/L and 8.22–52.75%, respectively.
Conclusion
The reference intervals for iron metabolism indices for healthy pregnant Chinese women were established in accordance with CLSI C28-A3 guidelines. This will be a valuable tool for clinical practice and research.
Keywords
Introduction
Iron is one of the most important trace elements required by the human body, necessary not only for the functioning of various cellular mechanisms, such as enzymatic processes, DNA synthesis and mitochondrial energy generation, but also an essential component of haemoglobin, which contains around 60% of total body iron and participates in oxygen transport and exchange. Excess iron in the body is stored in the liver, spleen, bone marrow and other areas in the form of ferritin and haemosiderin. The stored iron is rarely used when iron metabolism is balanced. However, if iron deficiency exists, the stored iron will be gradually consumed. Iron deficiency anaemia can occur when iron deficiency continues and stored iron becomes depleted. 1
During pregnancy, iron needs are tripled due to expansion of maternal red cell mass, growth of the fetus and placenta, raised basal maternal requirements and blood loss at delivery. Women require over 1 g of additional iron to cover the entire period. As only a minority of women have iron stores >500 mg, many women become iron deficient and develop iron deficiency anaemia. Iron deficiency and its anaemia can cause decreased activity of iron-containing enzymes and reduced oxygen transport in mothers and fetuses, which are associated with increased risk of maternal deaths, particularly from haemorrhage and sepsis. 2 Babies born to women with iron deficiency during pregnancy have increased risks of low birth weight and delayed psychomotor development. 2 Additionally, different national and international organizations recommend daily antenatal iron supplementation. However, there is concern that giving iron when there is no documented deficiency may produce more harm than good. Several studies report oxidative stress as a possible cause of pre-eclampsia, hypertensive disease, gestational diabetes and low birth weight due to premature deliveries. 3
Iron metabolism related laboratory indices including serum ferritin (SF), the most specific test that correlates with total body iron stores, as well as serum iron (SI) and total iron-binding capacity (TIBC), which is needed to calculate the transferrin saturation (TS) value.4–6 In cases of iron deficiency, SF and iron concentrations fall with an increase in TIBC and a reduction in TS.
Reference intervals (RIs) of clinical laboratory analytes are an important basis for the interpretation of test results and are essential for clinical decision-making. In pregnancy, the RIs for many analytes may differ from those in the non-pregnant population. However, most currently used RIs for iron metabolism indices have been established in the general (i.e. non-pregnant population). RIs for pregnant women in a Caucasian population have been reported, 7 but it is not clear whether these are relevant to a Chinese population.
The purpose of this study was to derive RIs for indices of iron metabolism during pregnancy in a Chinese population.
Materials and methods
Subjects
During September 2017 to March 2018, the information of 574 pregnant women from six geographical regions in China: 88 from Northeast China (Shenyang), 105 from North China (Beijing), 97 from East China (Shanghai), 102 from South China (Guangzhou), 89 from Southwest China (Chengdu) and 93 from Northwest China (Xi’an), who were admitted to downtown hospital from for prenatal check-up or delivery was searched. Information of 151 healthy non-pregnant women who came to Health Care Centre of second Xiangya hospital for routine check-up was also collected.
A total of 214 pregnant women: 28 from Northeast China (Shenyang), 45 from North China (Beijing), 37 from East China (Shanghai), 42 from South China (Guangzhou), 29 from Southwest China (Chengdu) and 33 from Northwest China (Xi’an) were then excluded from the pregnant group and 31 non-pregnant women were then excluded from the non-pregnant group according to the exclusion criteria from CLSI C28-A3 guidelines:
excessive alcohol consumption (>30 g per day) or smoking (>20 cigarettes per day); high blood pressure (either systolic pressure ≥140 mmHg or diastolic pressure ≥90 mmHg) for more than three years; body mass index ≥28 kg/m2 or ≤18.5 kg/m2; blood transfusion or donation within six months, or surgery during the previous four months of pregnancy; history of inherited diseases; medicine intake within two weeks or antibiotic use; a diagnosis of hepatic disease, endocrine disease, impaired renal function, cardiac disease, cancer or other chronic diseases; heavy exercise or laborious work; any structural abnormality of heart, liver, lungs and kidneys found though ultrasound examination or abnormal electrocardiogram; laboratory test results: RBC ≥5.0 × 10¹²/L or ≤3.0 × 10¹²/L, HGB ≤110 g/L, WBC ≥12.0 × 10⁹/L or ≤4.0 × 10⁹/L, PLT<100 × 109/L; triglyceride ≥2.26 mmol/L, total cholesterol ≥6.22 mmol/L, fasting blood glucose ≥7.0 mmol/L; any positive results of hepatitis B surface antigen, anti-hepatitis C virus and anti-HIV; or abnormal urinalysis.
Further exclusion criteria included pregnant women with inflammation (C-reactive protein > 6 mg/L or erythrocyte sedimentation rate >20 cmm/h) or clinical manifestations of iron deficiency.
This study was approved by the ethics committee of the Second Xiangya Hospital of Central South University and all participants gave written informed consent to participate.
Laboratory methods
All participants were asked to maintain their normal lifestyle and avoid strenuous physical exercise within three days of physical examination and laboratory testing. They were also asked to refrain from alcoholic beverages for at least one day prior to the examination and testing. The participants fasted overnight for at least 8 h and sat for at least 30 min before specimen collection. A venous blood sample (5 mL) was collected in a separation gel vacutainer (BD Biosciences, New Jersey, USA) between 8 am to 10 am. Blood samples were kept at room temperature for 30 min before centrifugation at 1200 × g. Centrifuged samples were stored at –20°C until analysis within six months. SF was measured by electrochemiluminescence immunoassay on the Roche E601 analyser with reagents supplied by the instrument manufacturer (Roche, Mannheim, Germany). SI and TIBC were measured by a direct bathophenanthroline method on a Hitachi 7600-DDP/7600–020 analyser with reagents supplied by the instrument manufacturer (Hitachi, Tokyo, Japan). The formula TS = SI/TIBC was used to calculate TS value. All of the tests were performed according to standard operating procedures recommended by NCCLS.
For quality control, two control concentrations of SF, SI and TIBC were tested. The precision and accuracy were determined according to the document EP 15A8 recommended by CLSI. The precision was expressed as the total coefficient of variation (CV), and the accuracy was expressed as recovery. The estimated total CV of SF, SI and TIBC (1.55%, 1.48% and 0.77%, respectively) and recovery (98.62%, 103.21% and 97.43%, respectively) met the requirement. For Trimmed Mean obtained from all laboratories in external quality assessment organized by the NCCLS, the bias of SF, SI and TIBC (3.66%, 2.86% and 3.74%, respectively) were satisfactory.
Statistical analysis
All data were analysed using SPSS 22.0 Statistical Software (SPSS Inc., Chicago, USA). The distribution of the data was assessed using the Kolmogorov-Smirnov test. Outliers were excluded using Dixon test. For non-normal distributed data, Mann-Whitney U tests were used to compare variables between two groups, and Kruskal-Wallis H test was applied to compare variables among multiple groups. Differences at P < 0.05 were considered statistically significant. In accordance with the recommendations of CLSI C28-A3 document, non-parametric tests were used to calculate SF, SI, TIBC and TS RIs. RIs were expressed as the 2.5th to 97.5th percentiles, and 90% confidence intervals (CIs) of lower and upper reference limits were calculated.
Results
Using these criteria, a total of 360 healthy pregnant individuals with a mean age (standard deviation) of 30.5 (9.5) years were selected. The women were then divided into three groups of 120 according to gestational age: first trimester (1–13 weeks), second trimester (14–27 weeks) and third trimester (≥28 weeks). Additionally, 120 healthy non-pregnant women with a mean age 28.7 (9.2) years were selected as the non-pregnant control group. The baseline characteristics for reference population are shown (Table 1).
Baseline characteristics for reference populations.
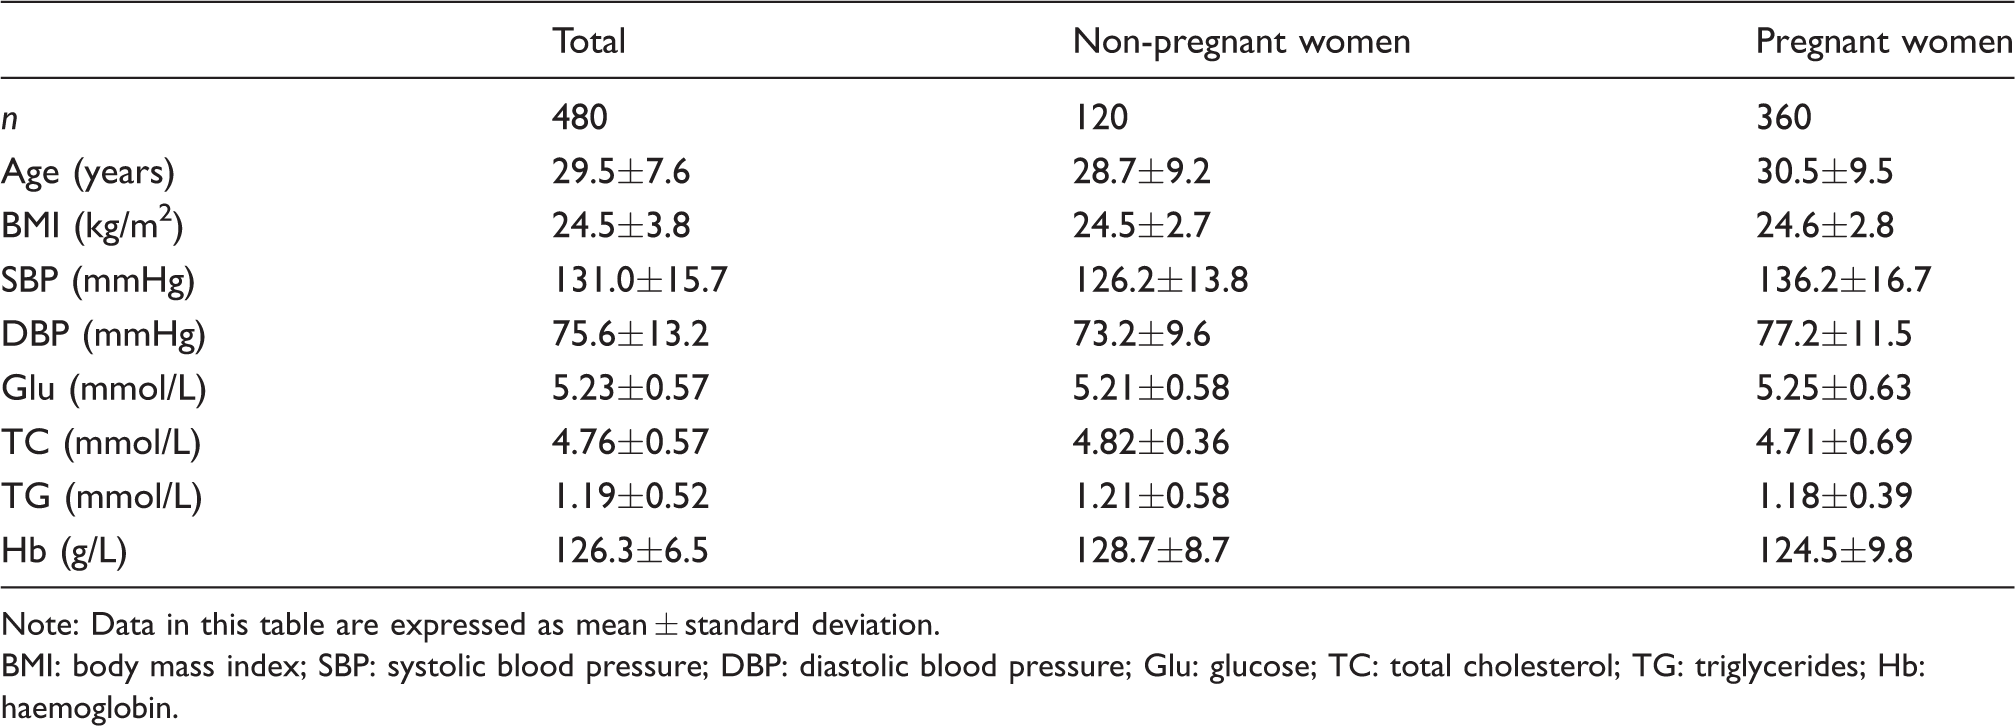
Note: Data in this table are expressed as mean ± standard deviation.
BMI: body mass index; SBP: systolic blood pressure; DBP: diastolic blood pressure; Glu: glucose; TC: total cholesterol; TG: triglycerides; Hb: haemoglobin.
Iron metabolism indices in healthy non-pregnant and pregnant women
The Komlogorov-Smimov test demonstrated that the concentrations of all iron metabolism indices were not normally distributed in both the healthy non-pregnant women and healthy pregnant women groups (P < 0.05). Dixon’s test showed no outliners. The Mann–Whitney U test showed that the concentrations of all iron metabolism indices were significantly different between healthy non-pregnant women and healthy pregnant women group (P < 0.05), indicating that RIs for all iron metabolism indices should be established separately for healthy non-pregnant and pregnant women (Table 2).
Iron metabolism indices in healthy non-pregnant women and healthy pregnant women.
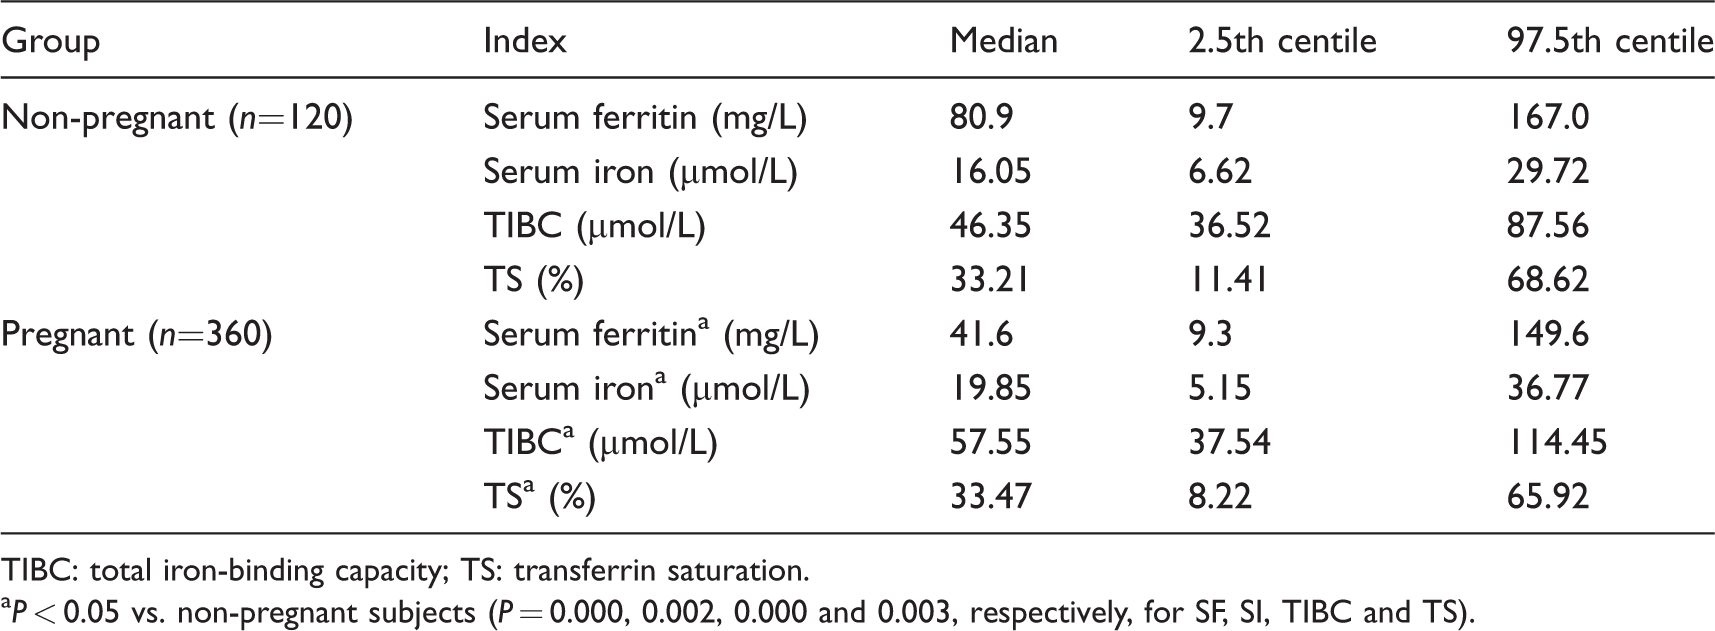
TIBC: total iron-binding capacity; TS: transferrin saturation.
aP < 0.05 vs. non-pregnant subjects (P = 0.000, 0.002, 0.000 and 0.003, respectively, for SF, SI, TIBC and TS).
Iron metabolism indices in healthy pregnant women by trimester
In accordance with CLSI C28-A3 guidelines, healthy pregnant women were divided into three groups with respect to gestational age: first trimester (1–13 weeks), second trimester (14–27 weeks), and third trimester (≥28 weeks) group to calculate RIs.
The concentrations of all iron metabolism indices were not normally distributed in first, second and third trimester group (Komlogorov-Smimov test, P < 0.05). Dixon’s test showed no outliners. H test confirmed that there were significant differences among three trimester groups for concentration of all iron metabolism indices (P > 0.05). U tests were thus performed for pairwise comparisons, and the concentrations of all iron metabolism indices were significantly different between first and third trimester group as well as second and third trimester group (P < 0.05). Nevertheless, there was no significant difference between the first and second trimester group for the concentrations of all iron metabolism indices (P > 0.05). Healthy pregnant women in first and second trimesters were therefore combined into one group to calculate the RIs of iron metabolism indices; the RIs of all iron metabolism indices should be established separately for healthy pregnant women in the third trimester (Table 3).
Iron metabolism in healthy pregnant women by trimester.
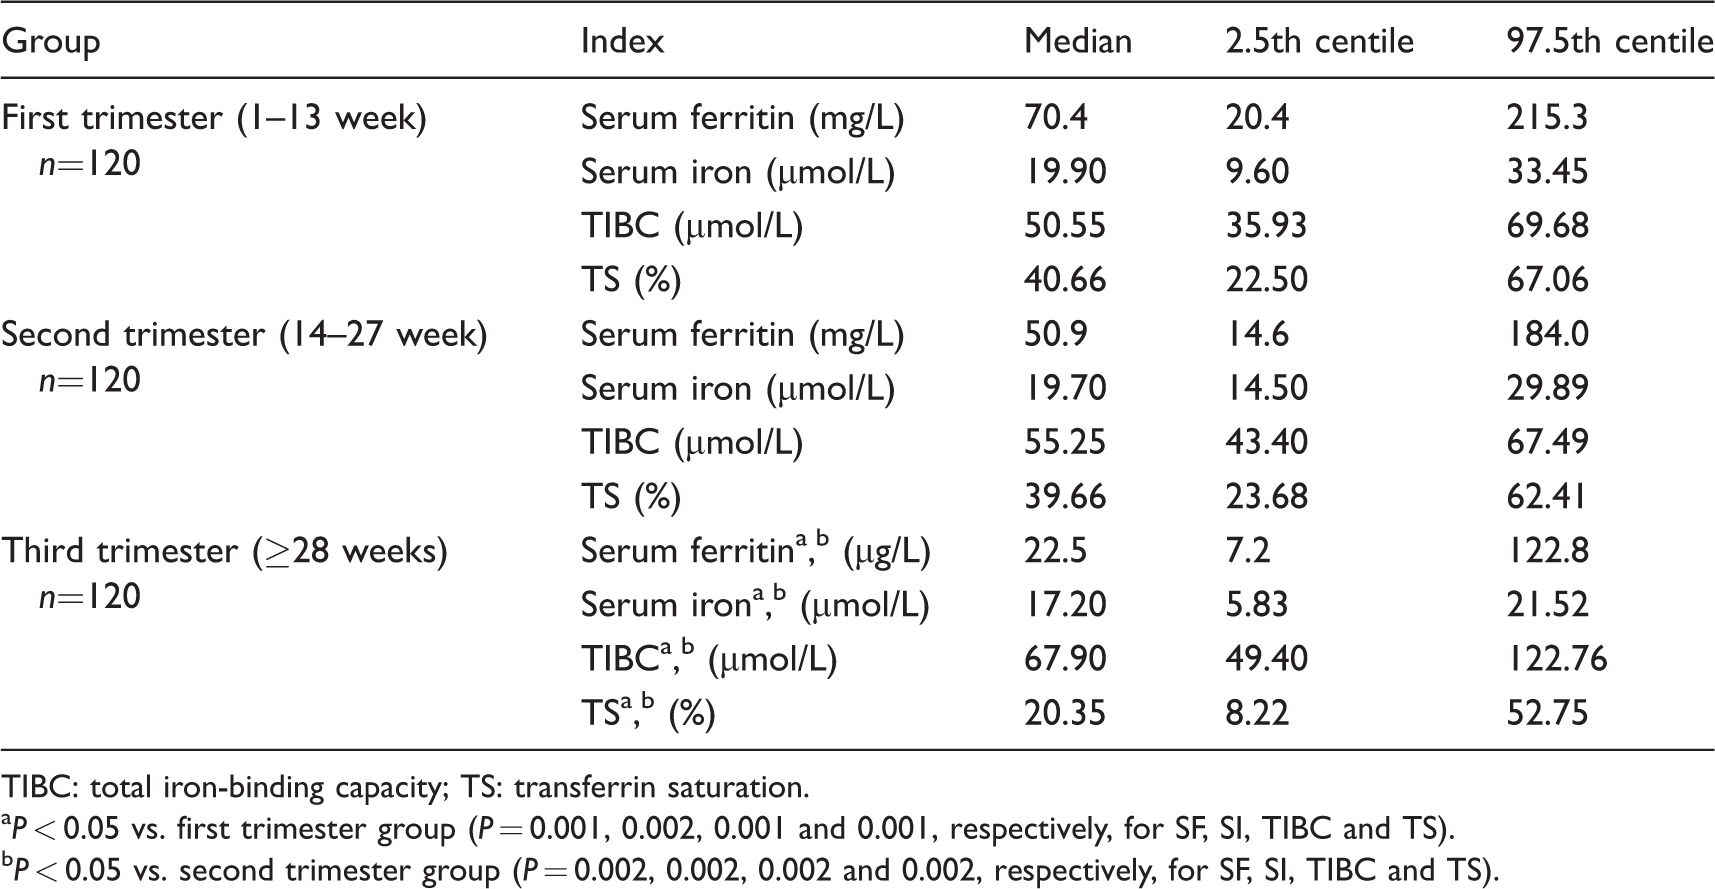
TIBC: total iron-binding capacity; TS: transferrin saturation.
aP < 0.05 vs. first trimester group (P = 0.001, 0.002, 0.001 and 0.001, respectively, for SF, SI, TIBC and TS).
bP < 0.05 vs. second trimester group (P = 0.002, 0.002, 0.002 and 0.002, respectively, for SF, SI, TIBC and TS).
The RIs (with 90% CI) of iron metabolism indices for healthy pregnant women are shown (Table 4).
The RIs of iron metabolism indices and 90% CI for healthy pregnant women.
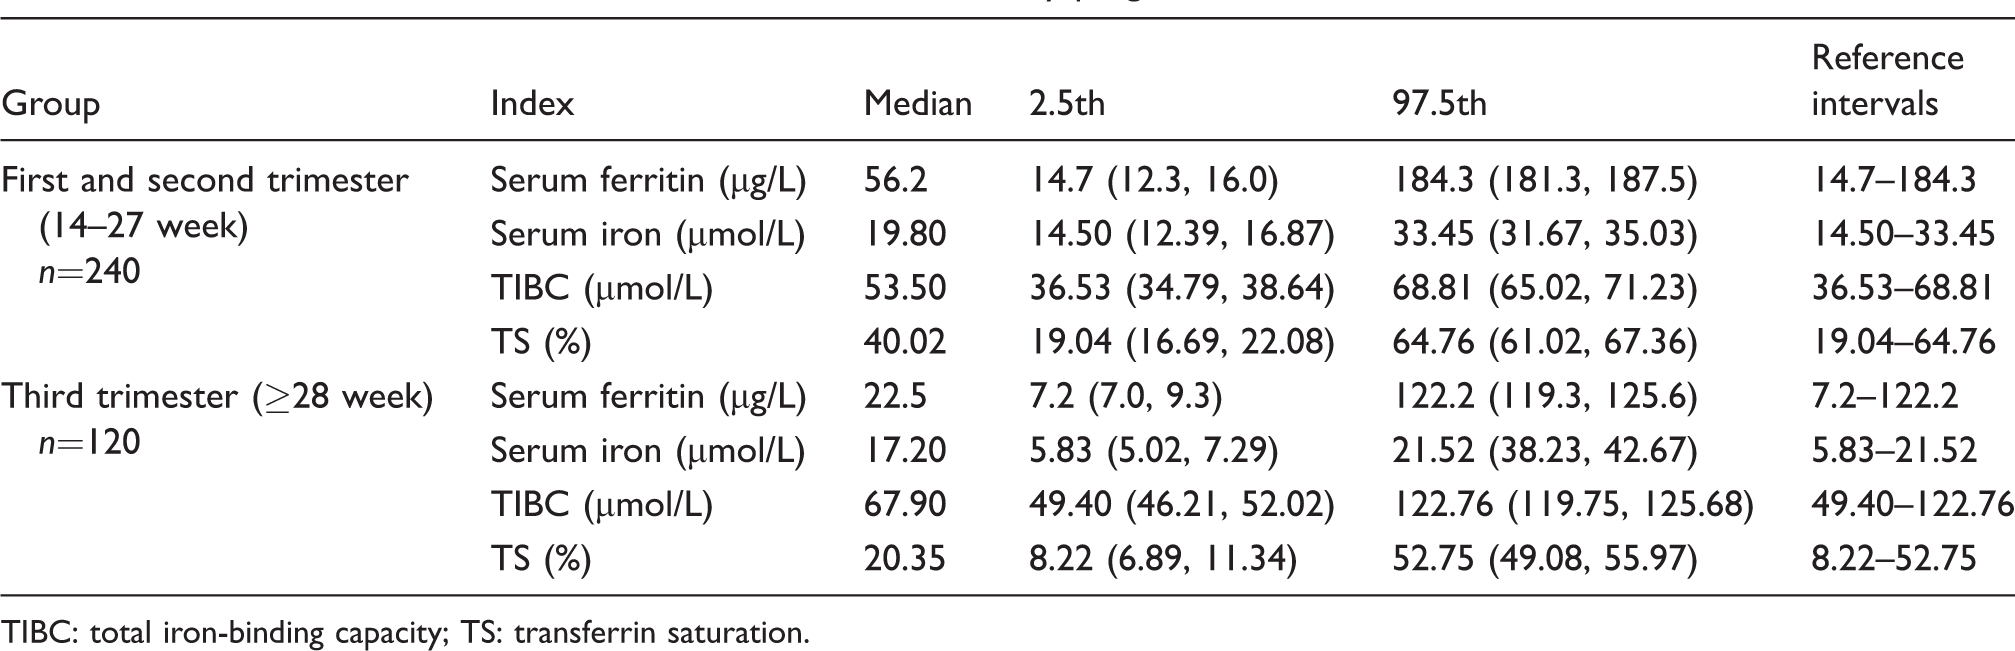
TIBC: total iron-binding capacity; TS: transferrin saturation.
Discussions
Iron deficiency and its associated anaemia, in pregnancy, can cause maternal death, premature delivery, low birth weight and delays in the development and maturation of the fetal central nervous system. Excessive iron supplementation during iron deficiency therapy may, however, be associated with the increasing risk of pre-eclampsia, hypertensive disease, gestational diabetes and low birth weight due to premature deliveries. 3 The laboratory assessment of iron status is therefore important for the health of both pregnant women and fetuses.
Reliable RIs for iron metabolism indices are essential to allow appropriate assessment, guide treatment and to allow effective utilization of medical resources.8–10 However, many of the RIs currently used to assess pregnant women have been established in the general non-pregnant population and do not take into account the unique physiological and biochemical differences between pregnant and non-pregnant women. Although some studies have established RIs for Caucasian pregnant women,11,12 these may not be appropriate for a Chinese population.
The present study was conducted rigorously in accordance with CLSI C28-A3 guidelines for the establishment of RIs in healthy Chinese pregnant women.
In previous studies, RIs for pregnant women have been established (Table 5). The study of Larsson et al. is based on 52 pregnant Scandinavian women. 7 The lower and upper limits of SF are lower in all three trimesters than reported in the present study. Also, the Larsson study has higher upper and lower limits for SI in all three trimesters. Studies from both Liu et al. 12 and Zhang et al. 11 in a Chinese population and with large sample sizes report very different serum iron RIs than reported here. The reasons for these differences remain unclear but may relate to the different measurement methods used. Unlike the present study, neither Liu nor Zhang reported RIs for SF, TIBC and TS. Our study is therefore the first to report RIs for SF, TIBC and TS in pregnant Chinese women.
RIs of iron metabolism indices and 90% CI in different studies.
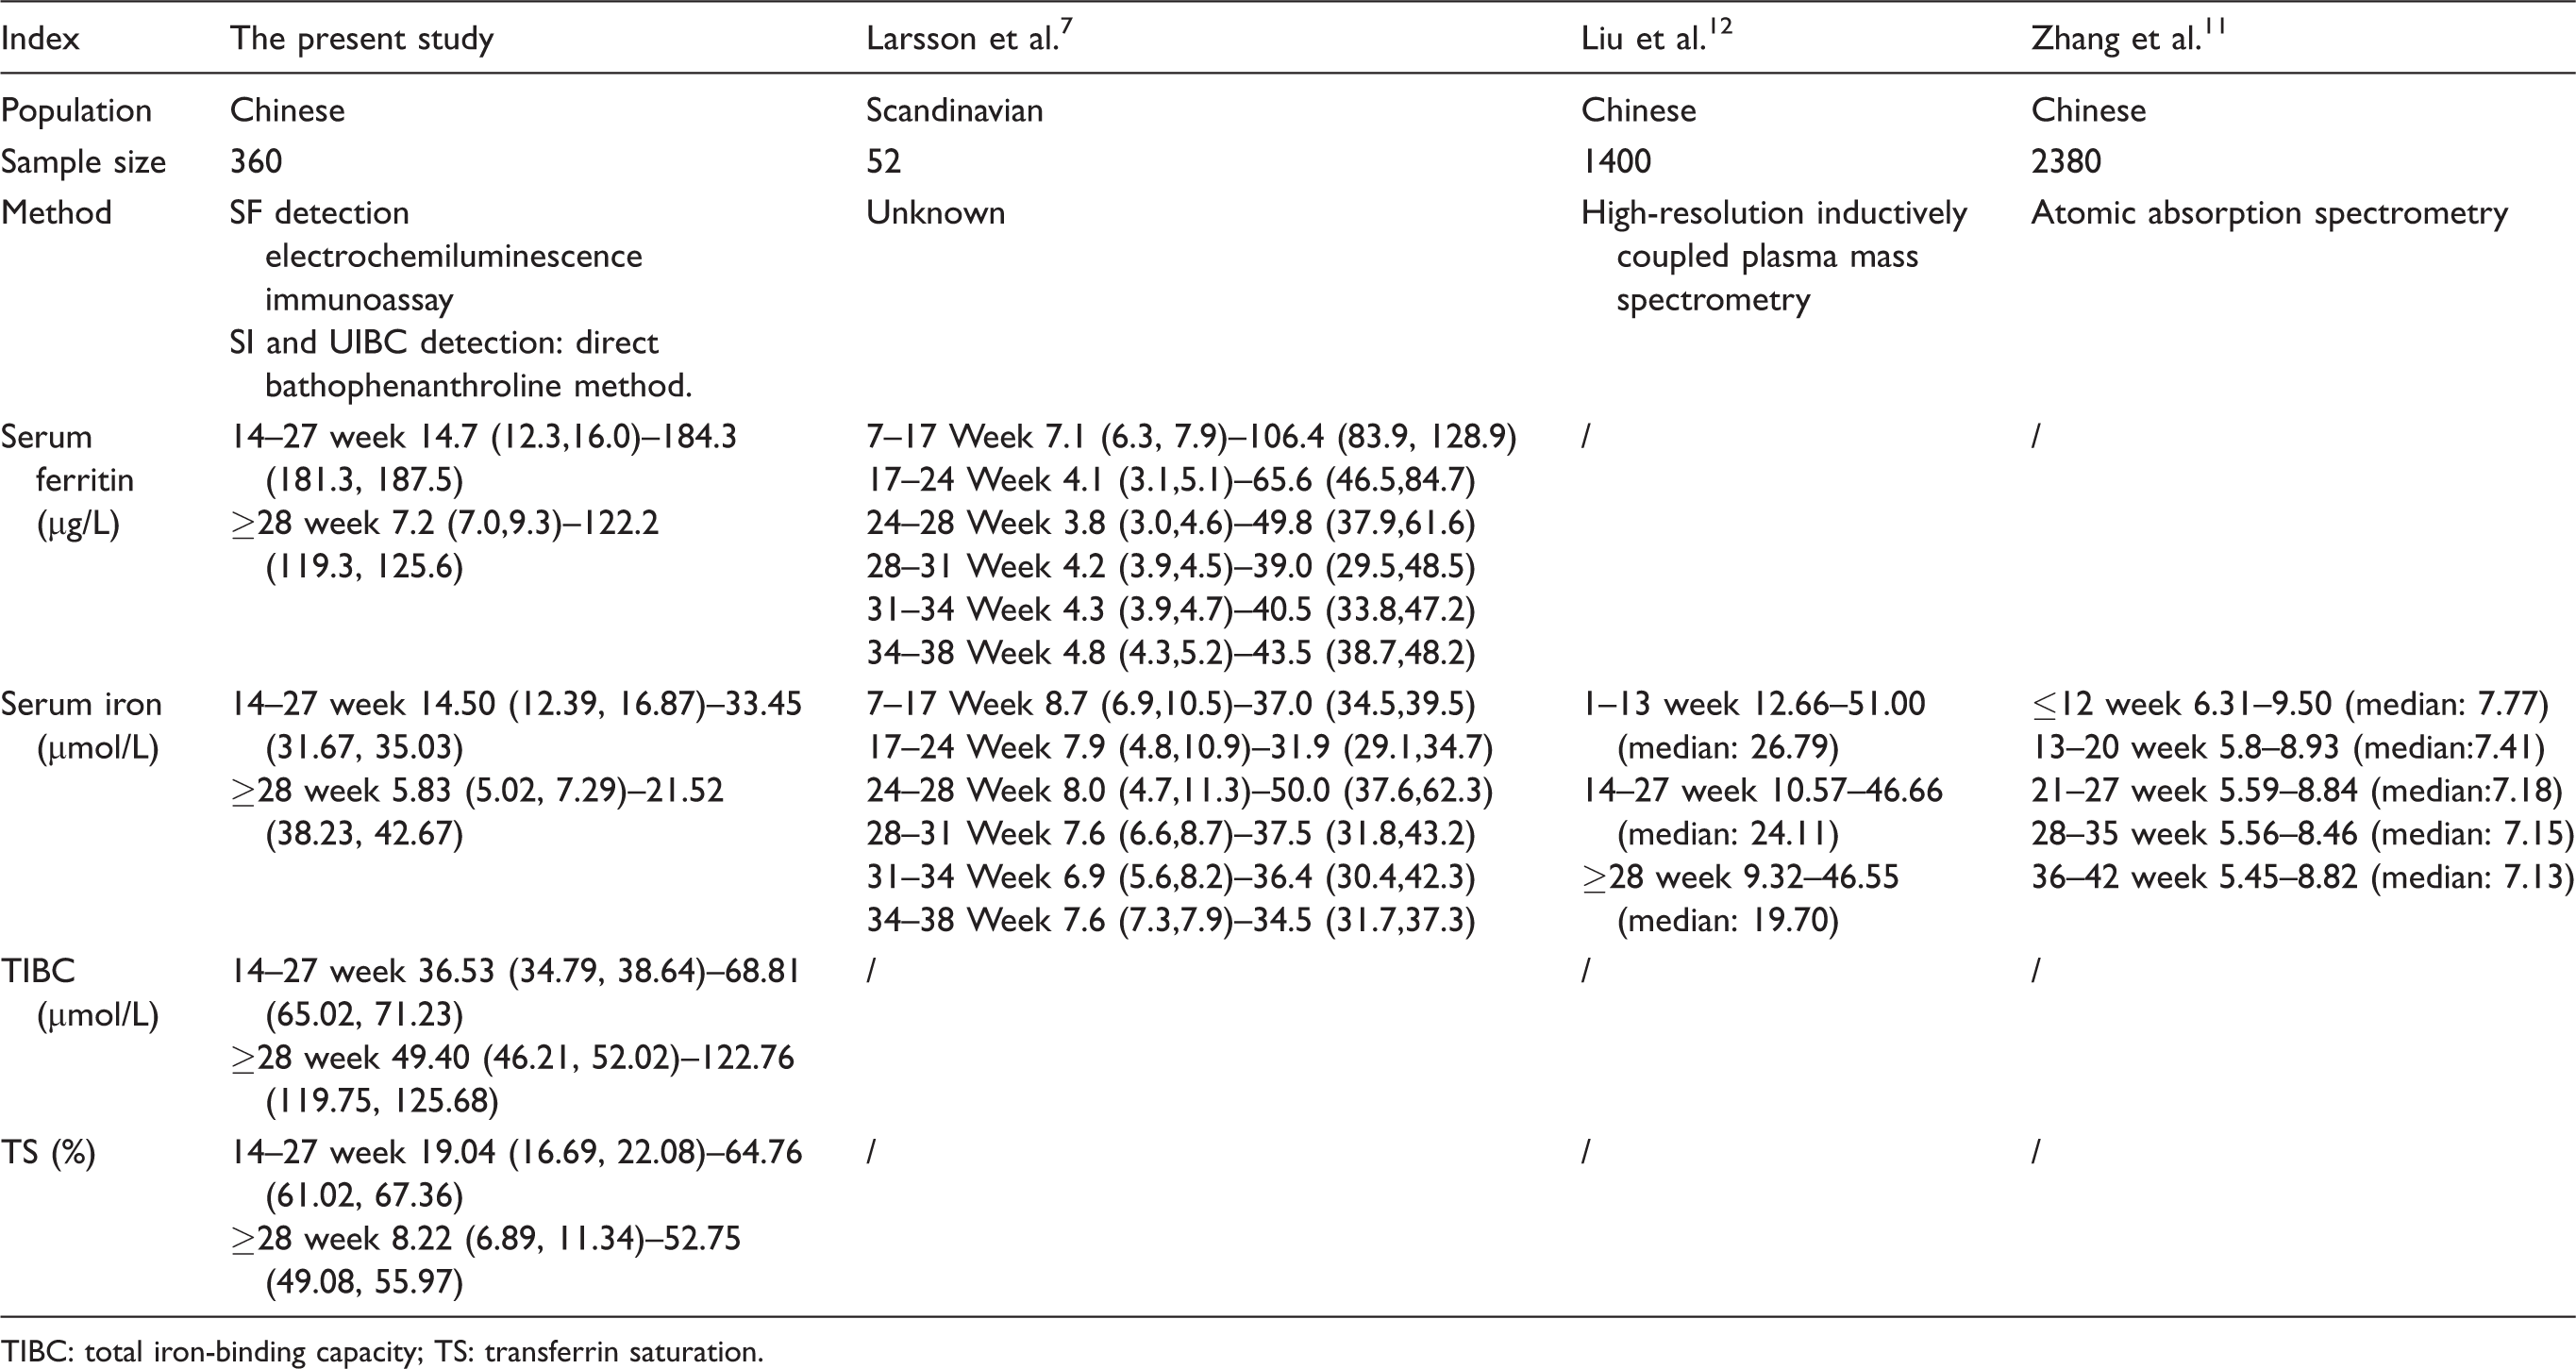
TIBC: total iron-binding capacity; TS: transferrin saturation.
In the present study, SF concentrations decline with gestational age during pregnancy (Figure 1(a)). This reflects the increasing need for iron as pregnancy progresses, which promotes the release of stored iron. The SI concentration rises during pregnancy but declines slightly in second trimester with a further decline in third trimester to a concentration that still higher than that in non-pregnant women (Figure 1(b)). This may reflect release of iron from body stores and increased absorption of iron to meet the needs of pregnancy. We speculate that in the second and third trimesters, the need for iron increases, SI concentrations decline as a result. Liu et al. 12 reported that SI were 26.79 µmol/L, 24.11 µmol/L and 19.70 µmol/L (median), respectively, in first, second and third trimesters. The variation tendency consists with our findings, while Zhang’s study 11 has an opposite trend in which SI were 7.77 µmol/L, 7.41 µmol/L, 7.18 µmol/L, 7.15 µmol/L and 7.13 µmol/L (median), respectively, in ≤12 week, 13–20 week, 21–27 week, 28–35 week and 36–42 week group. Moreover, TIBC rises during pregnancy and continues to rise as gestational age increases (Figure 1(c)). TIBC reflects the concentration of transferrin, and increasing iron needs increase the transferrin concentration. In addition, TS concentrations rise in pregnancy but declined slightly in second trimester and keep declining in third trimester to a level lower than non-pregnant women (Figure 1(d)). TS were calculated as SI/TIBC ratio. Given that iron and transferrin concentrations simultaneously increase in first trimester as well as iron concentration decreasing with an increasing TIBC concentration in second and third trimester, it is not unexpected to find that TS increases slightly in first trimester and decreases in second and third trimesters.
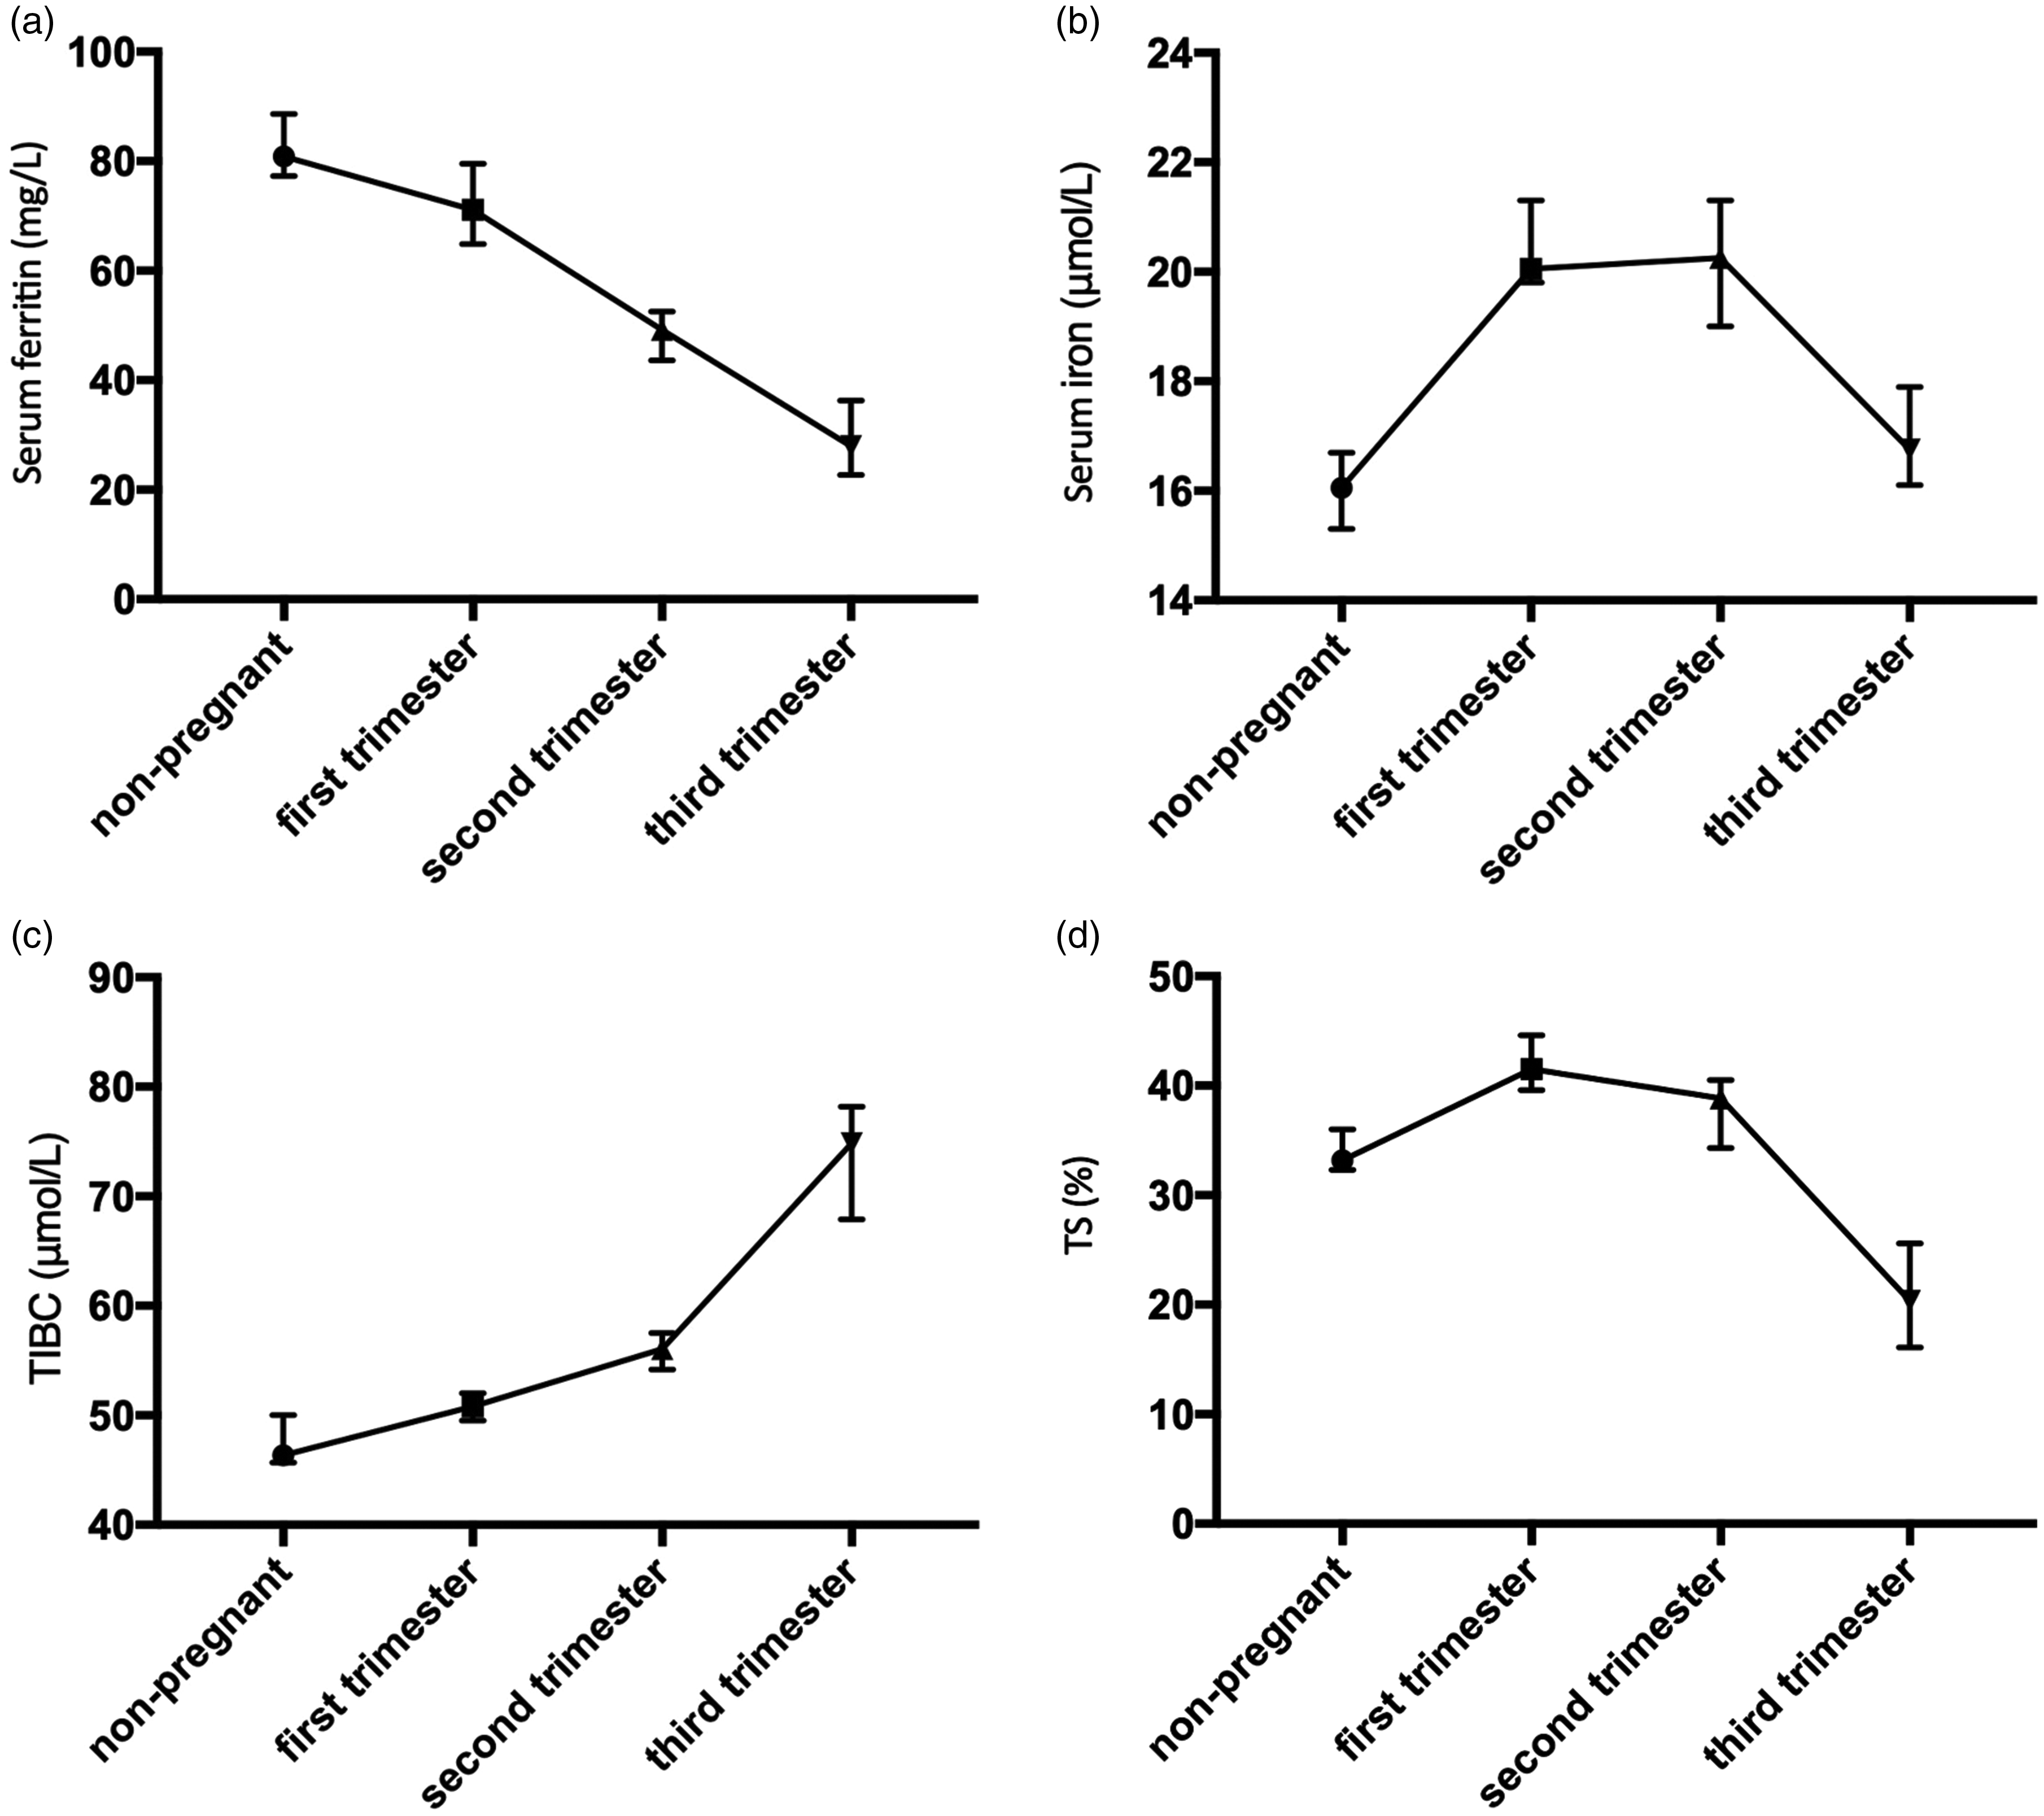
(a) Changes in median serum ferritin concentration in healthy non-pregnant women and healthy pregnant women in different trimesters. (b) Changes in median serum iron concentration (in healthy non-pregnant women and healthy pregnant women in different trimesters. (c) Changes of total iron-binding capacity (median) in healthy non-pregnant women and healthy pregnant women in different trimesters. (d) Changes of transferrin saturation (median) in healthy non-pregnant women and healthy pregnant women in different trimesters.
A limitation of our study was that we did not establish multi-centre RIs. Our reference population was from six representative geographical regions in China. However, there were insufficient participants to enable the establishment of specific RIs for each and every region. A previous study 13 indicated that the prevalence of iron deficiency was higher in East China and Northeast China (57.37% and 53.41%, respectively) and the lowest in Southwest China (30.51%). The prevalence of iron deficiency anaemia in South Central, Northwest and East China was relatively high (21.30%, 16.97% and 17.53%, respectively), while it was the lowest in Southwest China (5.44%). Given these significantly different frequencies of iron deficiency and iron deficiency anaemia between regions, we speculate that the RIs of iron metabolism indices might also vary between regions due to nutritional differences.
In summary, we have established RIs for iron metabolism indices in healthy pregnant Chinese women in accordance with CLSI C28-A3 guidelines. This will be a valuable tool for clinical practice and research.
Footnotes
Acknowledgements
We deeply thank the second Xiangya hospital for supporting this study
Declaration of conflicting interests
The author(s) declared no potential conflicts of interest with respect to the research, authorship, and/or publication of this article.
Funding
The author(s) received no financial support for the research, authorship, and/or publication of this article.
Ethical approval
This study was approved by the ethics committee of the Second Xiangya Hospital of Central South University (reference number: S062).
Guarantor
ZX.
Contributorship
ZX searched literature and conceived the study. RW, HJ, MH and AT involved in protocol development, gaining ethical approval, patient recruitment and data analysis. YY wrote the draft of the article. All authors reviewed and edited the article and approved the final version of the article.