
Abstract
Background
Specimen contamination that goes unnoticed can have many adverse consequences for patients including inappropriate investigations or treatment decisions based on erroneous results. Little is known about UK laboratory practices relating to specimen contamination; therefore, this national survey aimed to gather valuable baseline data.
Methods
An electronic survey consisting of 26 questions was designed to obtain key information relating to specimen contamination including its frequency, how it is identified by laboratories and actions taken in event of confirmed contamination. The survey was circulated to Heads of Departments of all NHS laboratories in the UK.
Results
Fifty-two responses (15%) were received from 353 laboratories surveyed. Recording and extracting specimen contamination data from laboratory IT systems appear to be a challenge for many laboratories. There is potentially a lack of awareness of correct order of draw for venous blood collection which is a factor known to contribute to contamination. There is wide variation in contamination rates (EDTA, citrate and drip arm), and the methods laboratories use to identify it which often rely on professional judgement. Similarly, there is little consensus among senior laboratory professionals on how best to report results on contaminated samples, and record events in risk management systems.
Conclusions
There is a need for greater consensus on laboratories’ approach to specimen contamination, particularly around mechanisms to identify and monitor it, and follow up actions. We make several recommendations to facilitate improvements it this area; however, there is a need to develop consensus guidelines which can aid both clinicians and laboratories.
Introduction
There is now copious evidence that most errors in laboratory medicine occur in the extra-analytical phases of the total testing process and especially during the preanalytical phase. The overall laboratory error rate is approximately 0.3%, of which preanalytical errors contribute around 65%. 1 Major sources of preanalytical errors include incorrect identification, inappropriate specimen volume, poor sample quality and sample handling issues. Factors which most often impact on sample integrity include haemolysis, collection into the wrong container, unwarranted clotting and contamination by infusion fluids or blood tube additives. Despite a relatively low apparent prevalence of contamination errors, given the vast number of samples sent to clinical laboratories, even this small rate may reflect a large absolute number of errors.
The consequence of specimen contamination that goes unnoticed may lead to poor patient safety and experience. Examples include delayed diagnoses, inappropriate investigations undertaken, longer hospital stays or inappropriate treatment decisions based on erroneous results. 2 Some samples are particularly valuable because they are difficult or impossible to repeat, e.g. collected during a hypoglycaemic episode or before a drug is administered and as such contamination may lead to a missed opportunity. Repeat blood sampling is frustrating and is often a source of anxiety for patients and carers alike. The significance of these sorts of problems is that they may apply to any patient and are unpredictable. They may be a particular problem in paediatrics where children are often needle-phobic and patient cooperation with sample collection can be a real issue. It is also a waste of sparse clinical and laboratory resources. Importantly, contamination errors are due to human factors and are preventable.
A 2016 UK-wide survey by the Association for Clinical Biochemistry and Laboratory Medicine Preanalytical Working Group (ACB-WG-PA) observed wide-spread deficiencies across laboratories in collecting regular and comprehensive data on preanalytical error rates. 3 There is a lack of data on UK laboratory practices specifically relating to sample contamination; however, anecdotal evidence suggests that it is a growing problem. With this in mind, the ACB Scientific Committee commissioned a National UK-wide survey on this topic. The main objectives of this were to establish the extent of the problem of sample contamination and explore some of the factors surrounding it. Here, we report on the results of this survey conducted under the auspices of the National Clinical Biochemistry Audit Group (NCBAG) of the ACB. In light of these new data, we also make a number of recommendations which we believe would improve current practice and therefore improve patient safety and experience.
Methods
A survey questionnaire was designed in SurveyMonkey® (San Mateo, California, USA) to obtain information on several themes relating to specimen contamination. The survey consisted of 26 questions and was distributed to the Heads of Department in NHS laboratories, as identified by ACB records. Responses were collected between January and March 2017. A copy of the survey (Supplementary Appendix 1) is available from the corresponding author. Data were analysed using Microsoft Excel® 2007® and Analyse-it® (Microsoft Corporation, Albuquerque, New Mexico, USA). An effort was made to identify duplicate responses from the same laboratory as well as multiple responses from the members of the same network. There was one instance of this, and only the most complete response was included in the analysis.
Results
The first part of the survey gathered some key respondent information and explored some of the general issues around blood collection and specimen contamination.
Respondents
There were 52 responses out of 353 laboratories (15%) surveyed. Fifty-one per cent of respondents’ laboratories were based in a District General Hospital, 36% in a teaching hospital, 11% were part of a local network and 2% were a tertiary referral centre. Eighty-three per cent of those who responded were answering on behalf of their own laboratory only, whereas 17% were responding on behalf of a network.
Patient demographics
Supplementary Table 1 shows a breakdown of the patient demographics of the samples received by the laboratories. The intention was that these data could be used to determine any correlations between specific patient groups and contamination rates or differences in procedures, in order to highlight specific areas for quality improvement. Since only a small proportion of responses were from laboratories that served a relatively large proportion of paediatric and/or neonatal patients, it was difficult to draw firm conclusions regarding this.
Workload
Workload figures were sought to enable calculation of specimen contamination rates. The total number of specimens received in the last three months was 165,604 (248,178) (median, SD) which is equivalent to 1840 specimens per day. The vast majority of these were from adult patients, 96.7% (12.2%), with far fewer specimens received from paediatric patients 2.6% (4.8%) and neonates 0.6% (7.9%).
Venepuncture and order of draw
The majority of blood collection for hospital patients (inpatients and outpatients) is performed by trained phlebotomists (Figure 1); however, doctors and nurses also make a significant contribution to inpatients’ blood collection. In primary care, nurses do slightly more blood collection compared with any other staff groups (Figure 1).
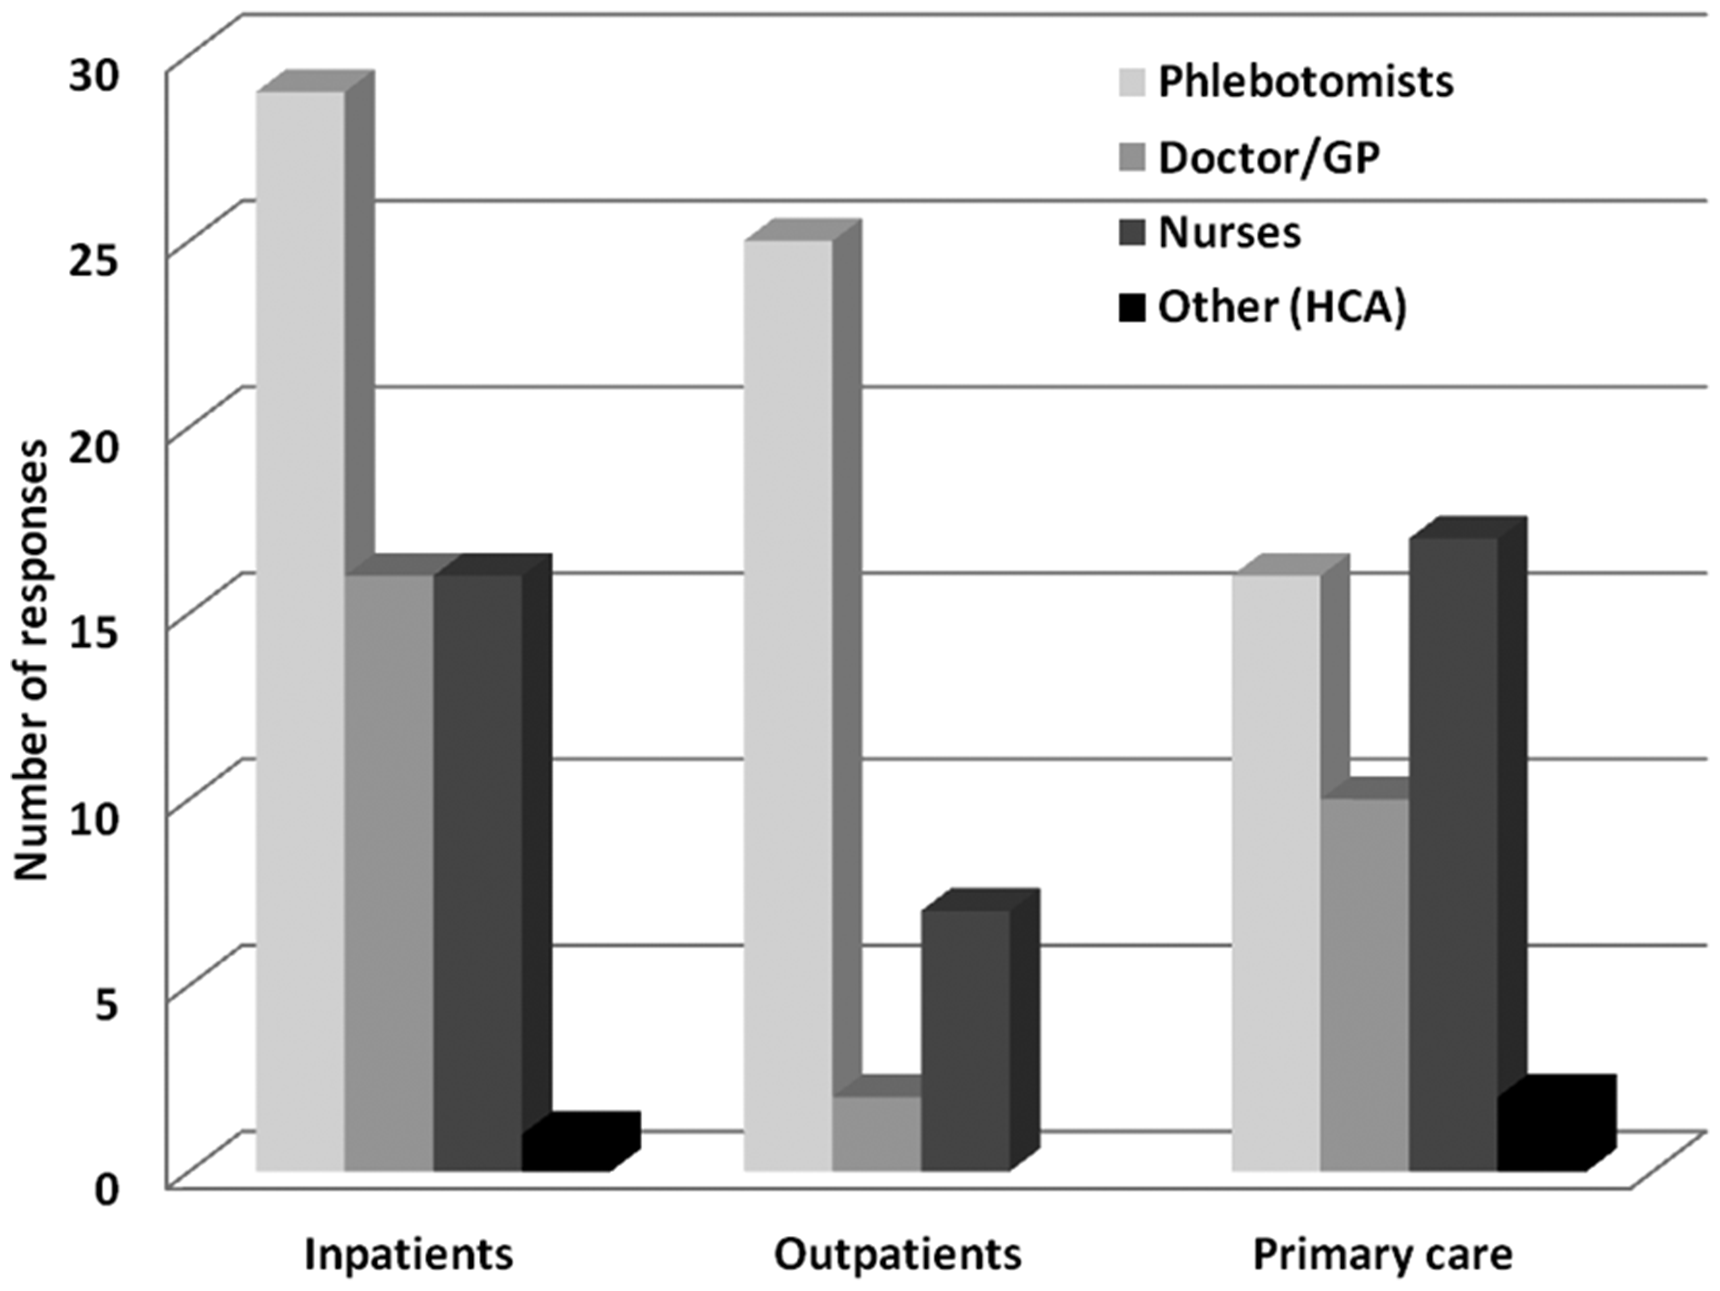
Breakdown of responses of which staff group performs venepuncture for specimens sent to laboratories. ‘Other’ staff group includes Healthcare Assistants (HCA).
Fifty-eight per cent of respondents indicated staff in their hospitals followed recommended order of draw lists provided by their blood tube manufacturer whereas 42% skipped this question.
Blood tubes
The blood tube manufacturers of those who responded were: Becton, Dickinson and Company (BD) (Franklin Lakes, New Jersey, USA), 60%; Sarstedt (Nümbrecht, Germany), 24%; Greiner Bio-One (Kremsmünster, Austria), 10% and Teklab Ltd. (County Durham, UK), 3%.
The primary tube type received for core investigations (e.g. urea and electrolytes, liver function tests, etc.) by the vast majority (90%) of respondents is some form of gel-loaded serum tube. Seven per cent receive plain, clotted serum and 3% receive lithium–heparin plasma.
Eleven respondents indicated the primary blood tube type used differs depending on source of the request. All of these receive gel serum tubes except for the following locations which send lithium–heparin plasma (either gel or non-gel) instead: paediatrics (n = 5), acute receiving areas (n = 4), renal (n = 4), neonatal (n = 2) and critical care (n = 1).
For trace element analysis (either in-house or referred), various blood tubes are currently accepted including a mixture of gel and non-gel tubes (Figure 2).
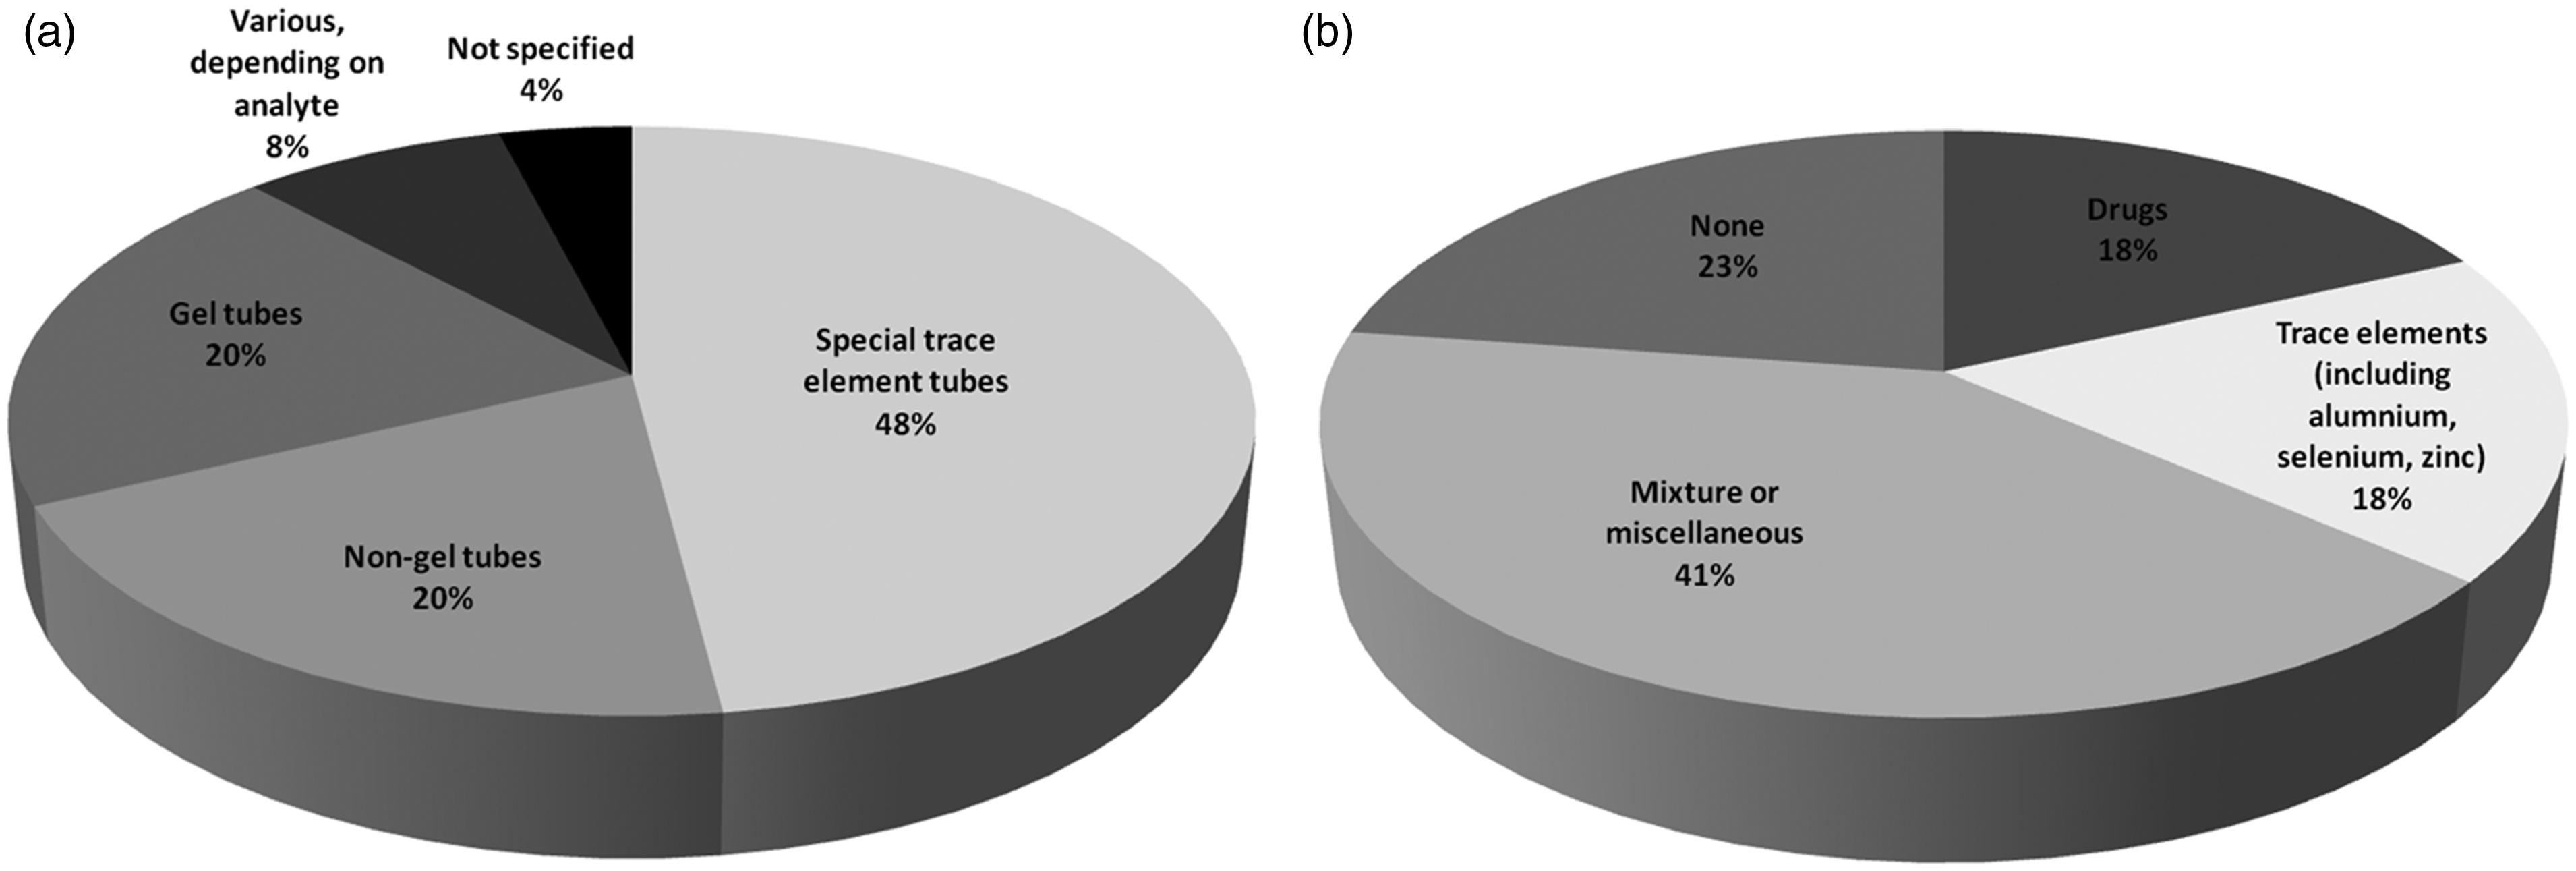
(a) Breakdown of responses of which blood tubes are accepted for trace element analysis. Special trace element tubes include: BD’s serum tube with clot activator or K2EDTA plasma version and Sarstedt’s lithium–heparin plasma tubes and (b) Breakdown of responses of which test(s) the use of gel-loaded tubes is avoided.
A majority of laboratories avoid the use of gel-loaded tubes for certain analytes, especially trace elements, various drugs, or a combination of these and others (Figure 2). However, 23% of respondents do not avoid gel-loaded tubes for any tests.
The second part of the survey examined the extent of the problem of specimen contamination and how laboratories identify it.
Contamination
General
Median number of samples rejected due to any cause of contamination was 35 covering a three-month period; however, there was wide variation (SD, 130). It was evident that it was difficult for many respondents to gather these data; almost two-thirds skipped this question and several comments were along the theme of ‘don’t know’ or too difficult or impossible to obtain these data from the laboratory information management system (LIMS).
The majority (80%) of contaminated samples received by the laboratory appears to originate from inpatients. In contrast, only 12% originate from primary care and 8% from outpatient clinics.
Next, specific types of contamination are examined.
Drip arm contamination
Median number of drip arm samples received was 8.5 (SD 16.1) per quarter. These were universally identified by the pattern of results such as very low potassium and/or urea, unfeasibly high glucose, etc. One respondent stated drip arm contamination is identified by viewing the pattern of results, comparing with previous results, and after discussion with ward/clinic staff.
EDTA contamination
Median number of EDTA-contaminated samples received was 19 (SD 57.6) per quarter. These were identified by the vast majority (25 out of 26) of laboratories by the pattern of results (high potassium, low calcium/magnesium/ALP).
Only one respondent (4%) stated that they have an in-house EDTA assay which they run on Roche Cobas platform (Roche, Basel, Switzerland). EDTA measurement is automatically reflexed onto specimens when thresholds are breached (potassium ≥6.0 mmol/L and/or adjusted calcium ≤1.8 mmol/L; however, it can also be added or cancelled at the discretion of biomedical scientists and the duty biochemist. Significant contamination is locally defined as EDTA ≥0.1 mmol/L at which point all results on that specimen are cancelled.
Subanalysis of the data revealed EDTA contamination is more prevalent in laboratories that receive Sarstedt tubes compared with BD (P < 0.01, Figure 3).
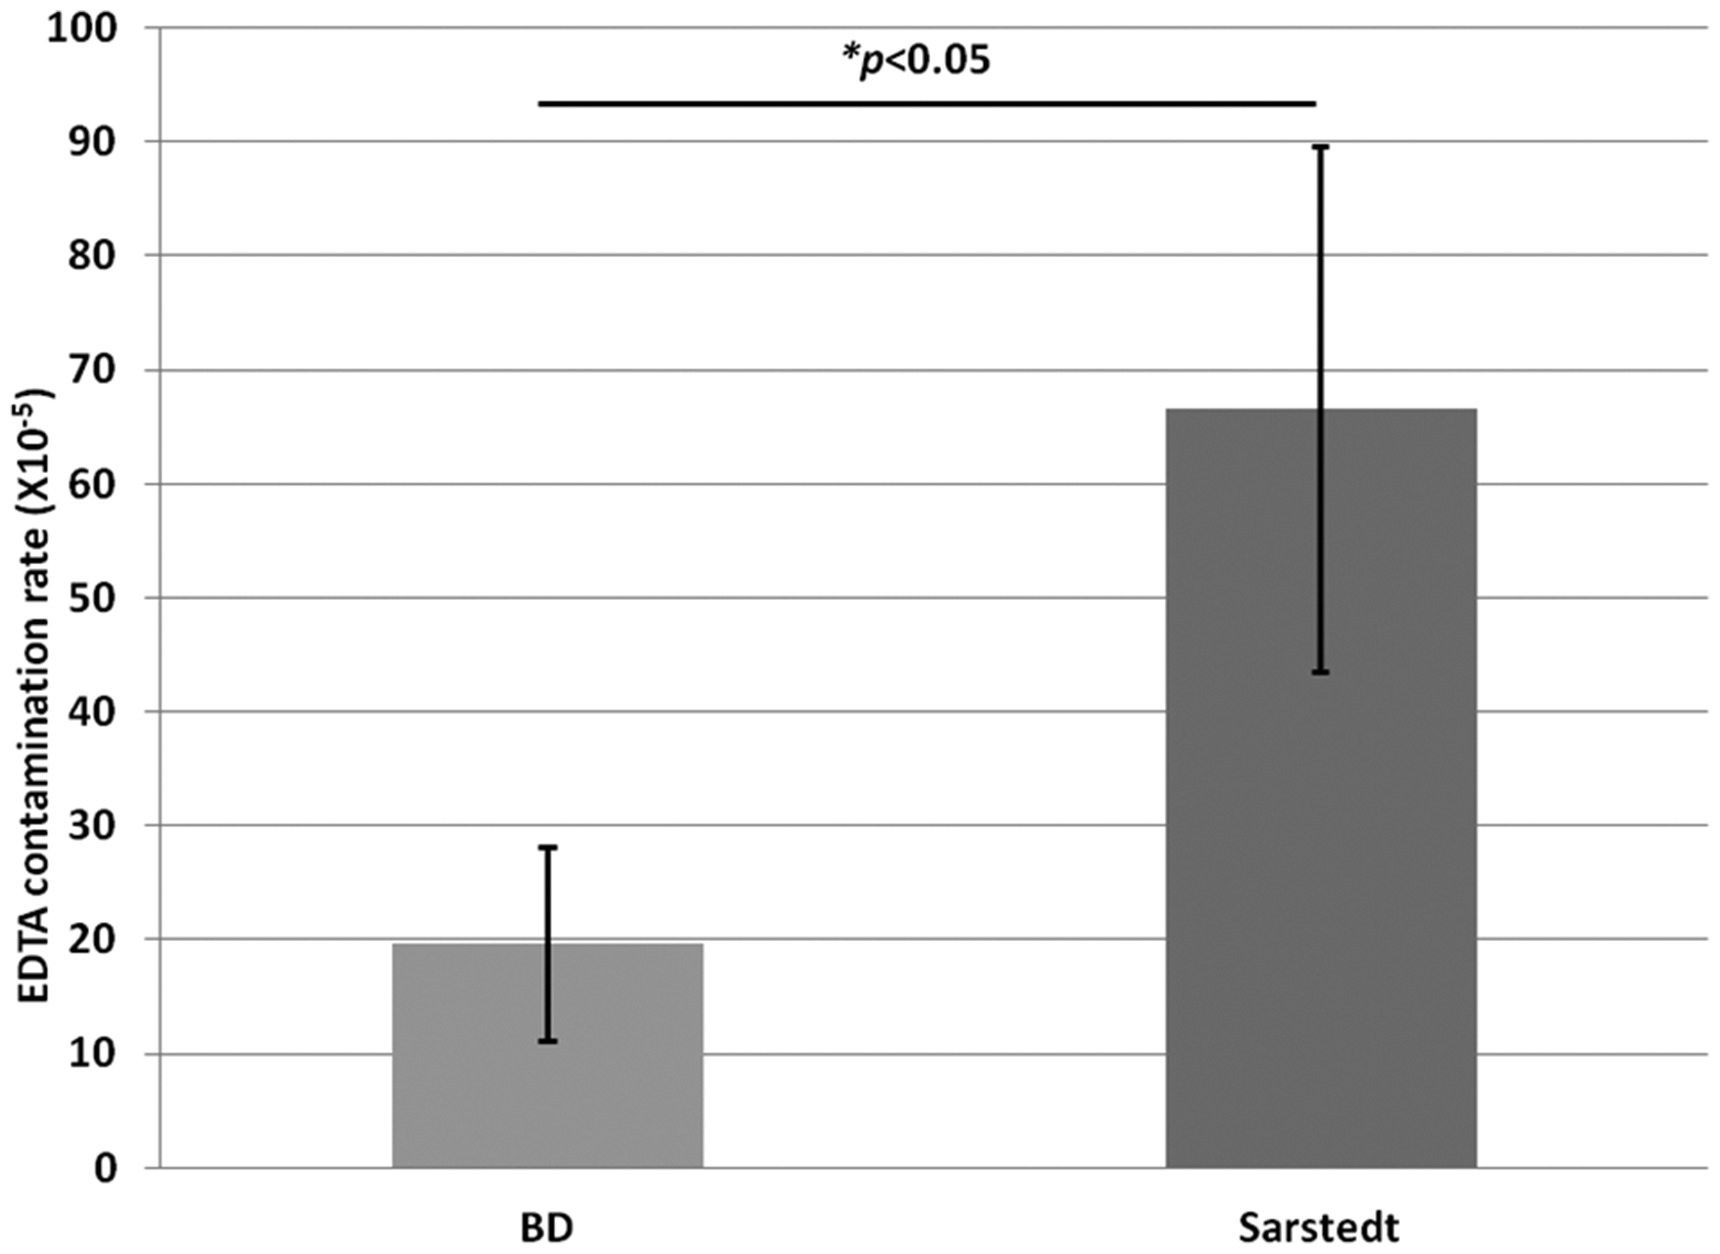
Prevalence of EDTA contamination depending on primary blood tube manufacturer. EDTA contamination rate was calculated by dividing the number of identified EDTA-contaminated samples by the total number of samples received. Groups were compared by Student’s t-test and considered statistically significant when P < 0.05.
Citrate contamination
Only a handful of respondents supplied data on citrate-contaminated samples. Eight laboratories received up to five contaminated specimens (median 1, SD 1.9) in the last quarter, whereas six laboratories identified none. Similar to other types of contamination, these were identified by the majority (15 out of 16) of laboratories by the pattern of results (high sodium, low osmolality and/or chloride). One respondent stated citrate contamination is identified by viewing the pattern of results, comparing with previous results, and after discussion with ward/clinic staff.
Subanalysis of contamination rates (total, drip arm, EDTA and citrate) with independent variables such as patient demographics, or which staff group mainly performs venepuncture, did not reveal any trends (data not shown).
The final part of the survey explored laboratory policy on results reporting in instances of suspected or confirmed contamination.
Reporting of results
There is wide variation in local reporting procedures for instances of suspected contamination (Figure 4). Half of laboratories would simply not report results on contaminated specimens, whereas 42% would contact the requestor immediately to make them aware and perhaps also remove any spurious results. A small proportion (8%) would report results regardless but may append a comment highlighting possible/probable contamination.
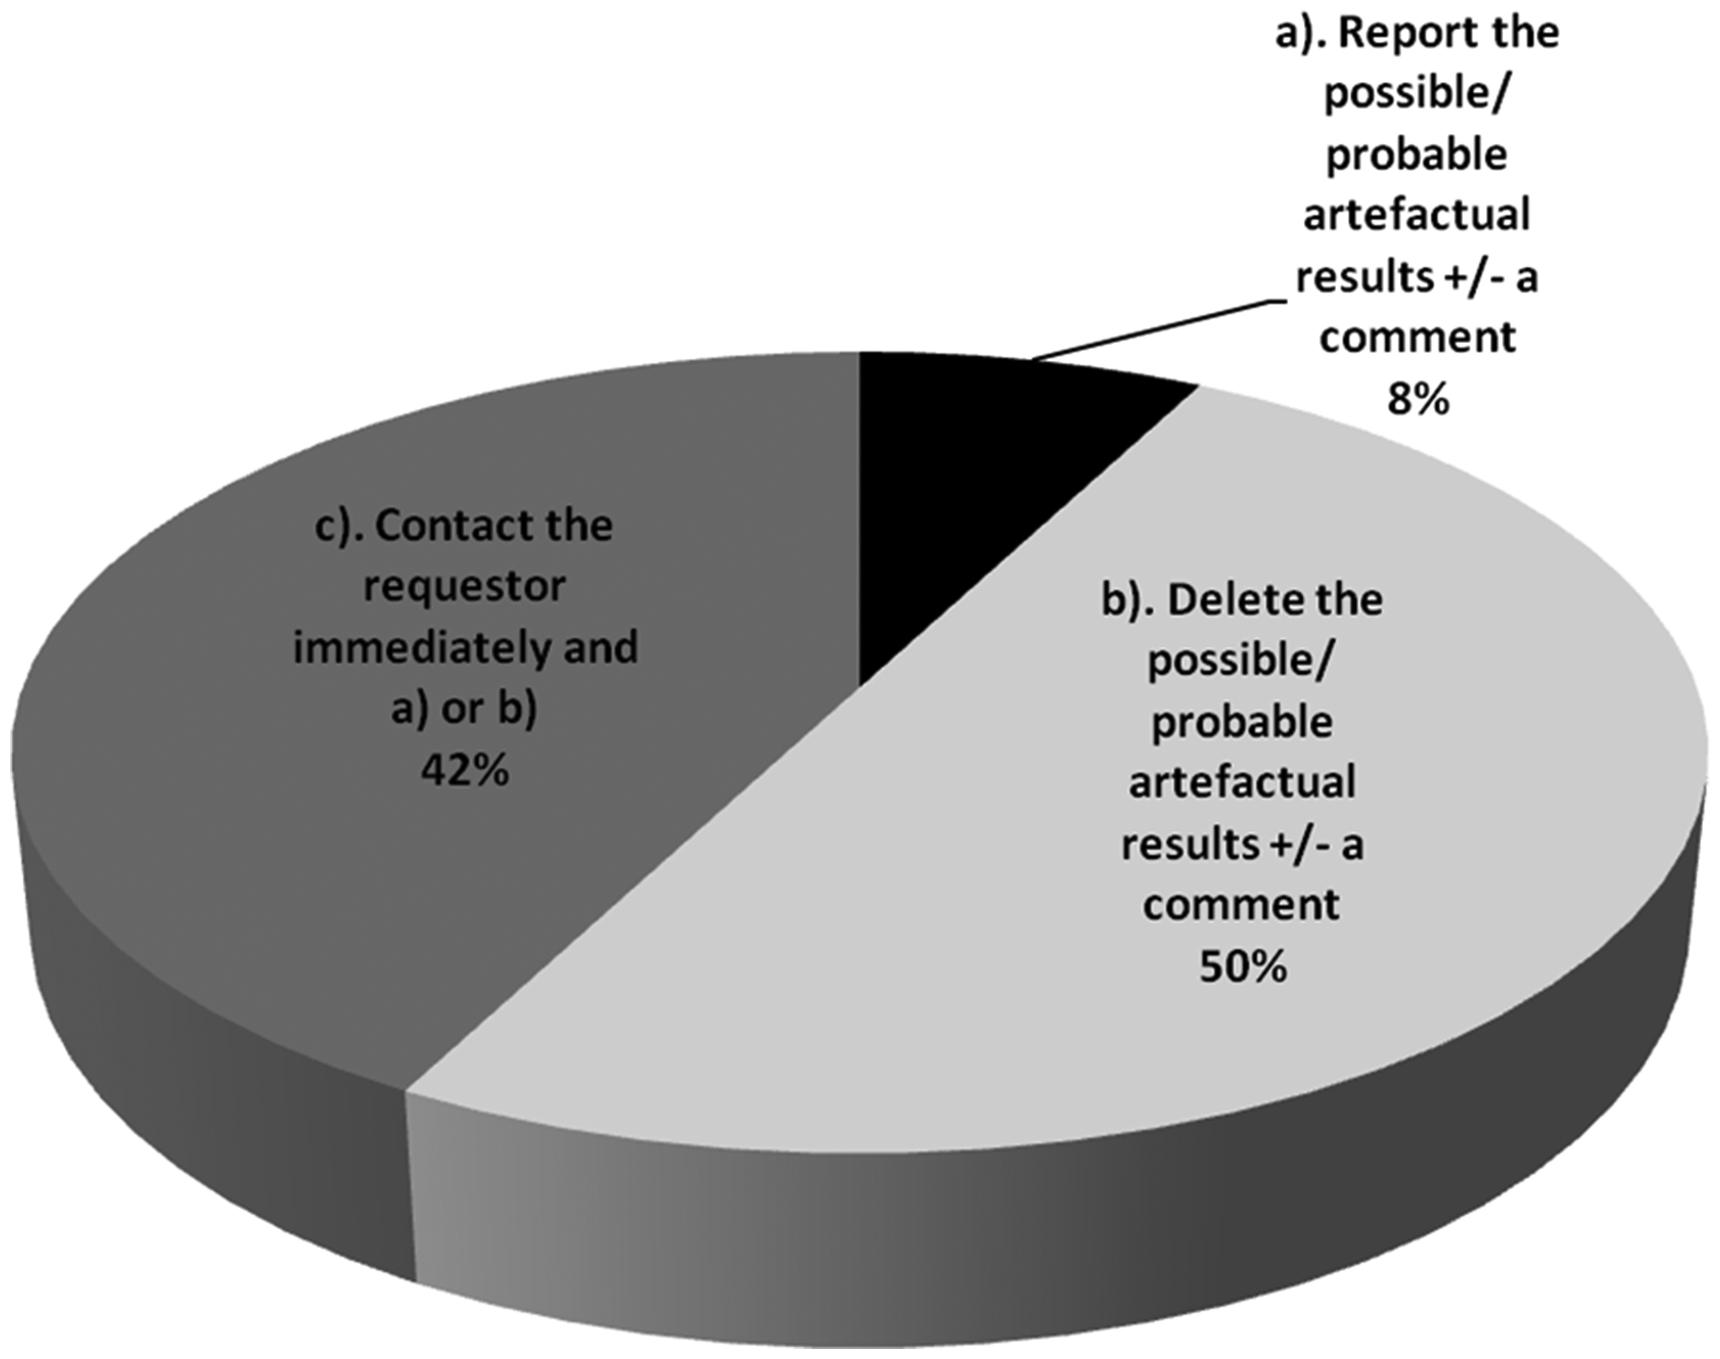
Local procedures for reporting results in cases of suspected specimen contamination.
For laboratories that do not employ EDTA or citrate assays to definitively identify contamination (the vast majority of UK laboratories), and instead base suspicion on other results (e.g. K, Ca and Na), only 26% use defined cut-off values for deleting results. Of those with defined cut-offs, four laboratories use thresholds of K > 10 mmol/L or Ca <0.5 mmol/L, and these are part of the same network with standardized local policy. One laboratory quoted thresholds of Na >160 mmol/L, or 20 mmol/L increase from previous together with Cl <108 mmol/L. Most laboratories (74%) have no clearly defined cut-offs for deleting results, but several respondents described their decision-making process where some key themes emerged (Figure 5).
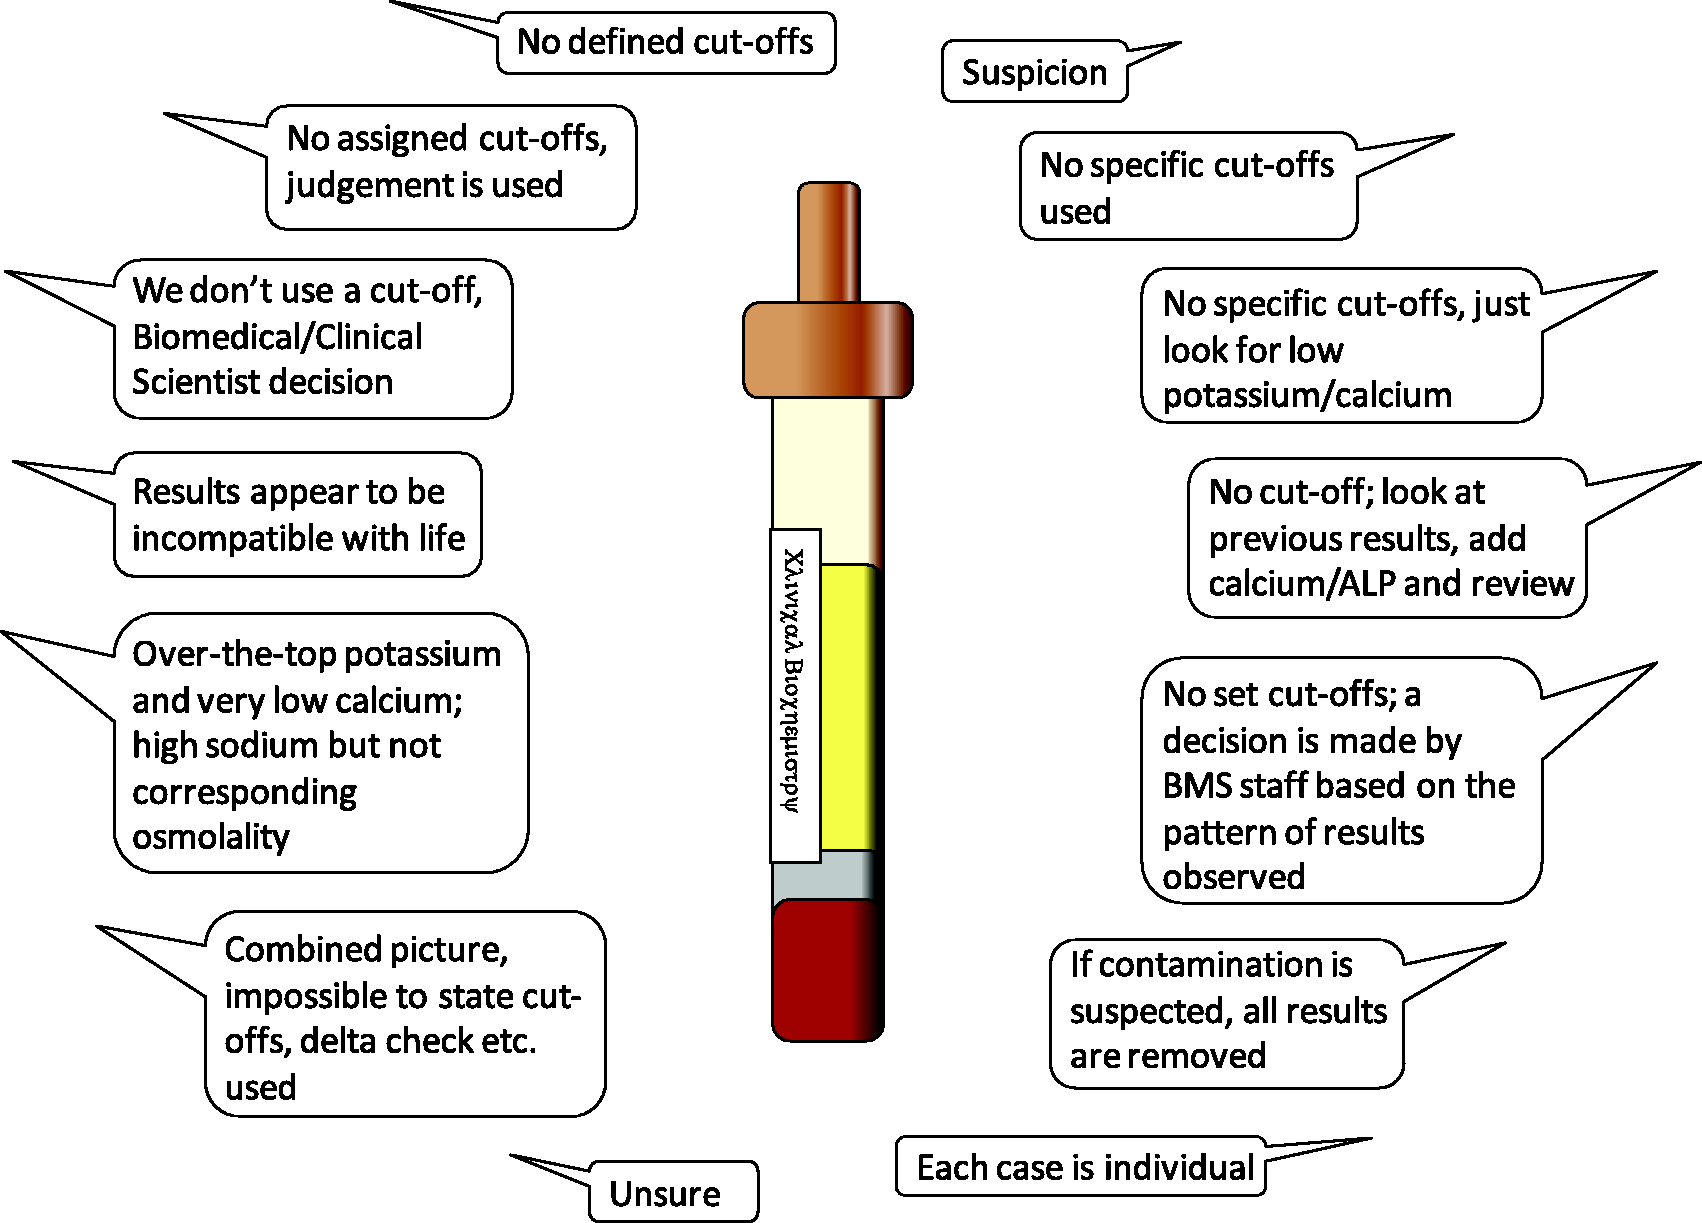
Strategies for identifying K-EDTA or citrate contamination in laboratories that do not have these assays available.
Risk management
Opinions varied widely among respondents on how to grade the issue of sample contamination, and there was no clear consensus (Figure 6).
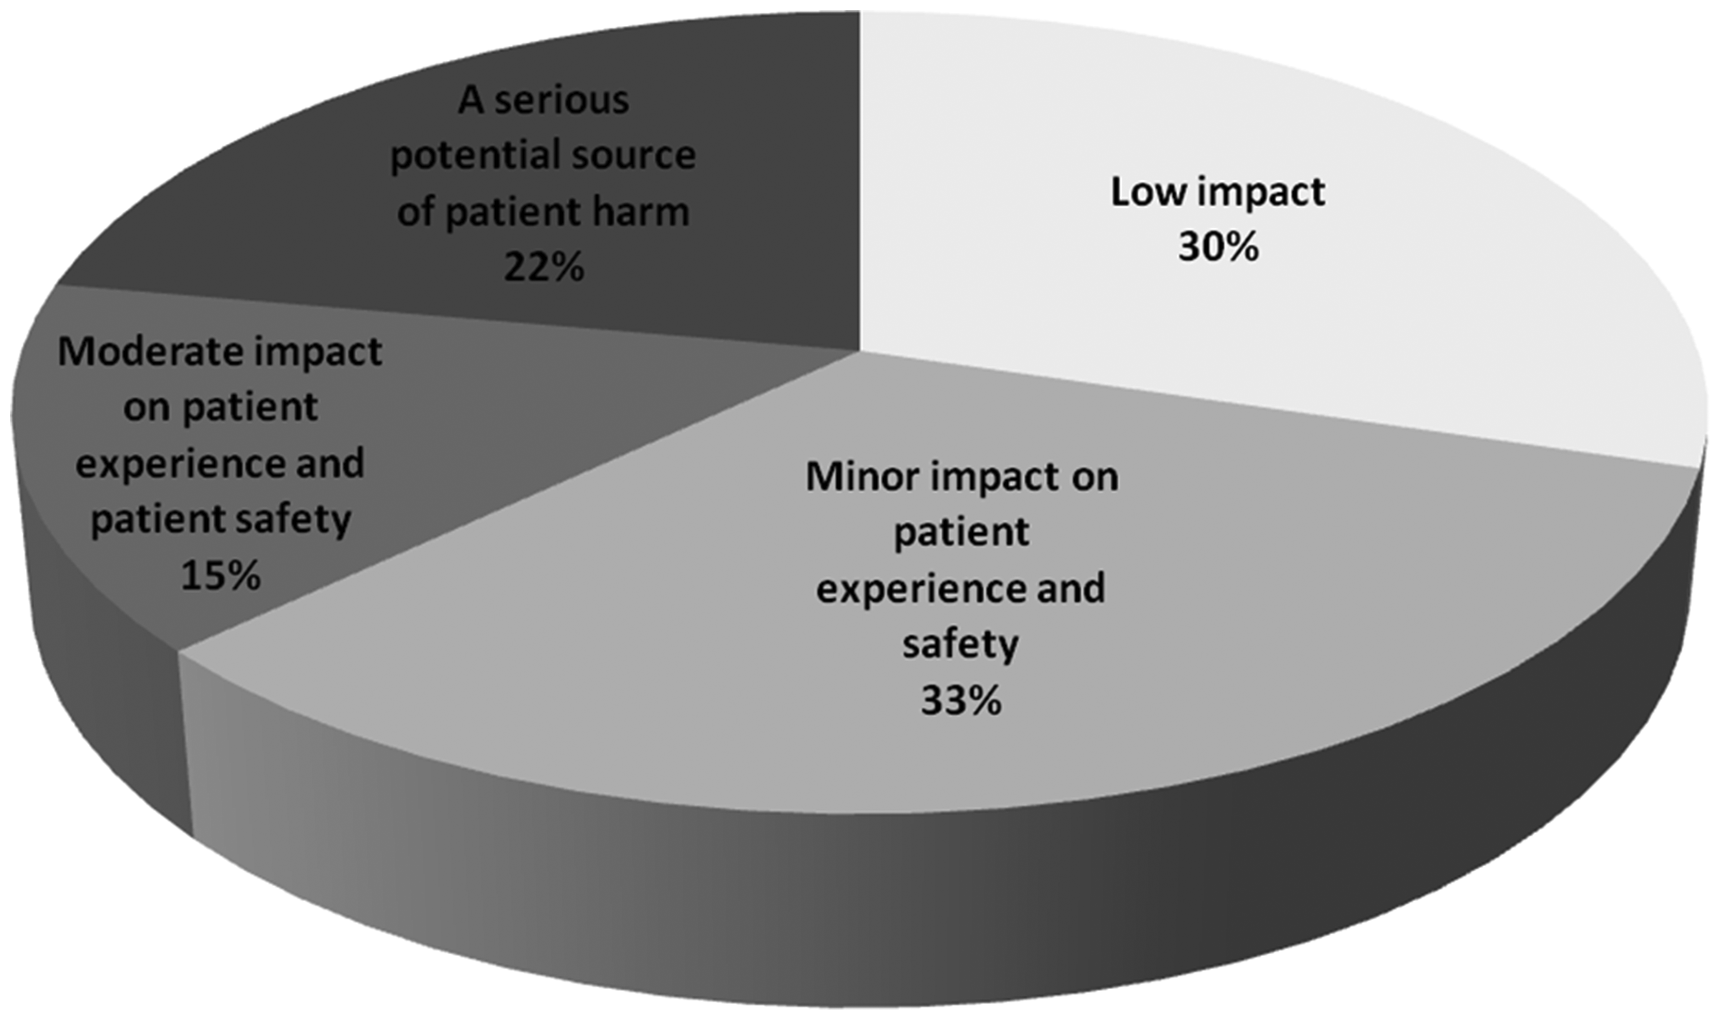
Opinions on the impact of specimen contamination on patient safety.
Only a small minority (16%) of laboratories categorically report suspected or confirmed contamination events in a patient risk management system such as Datix. Almost half of respondents (44%) do not register these in such systems. The remainder of the respondents (40%) stated a variety of ‘free text’ comments among which two key themes emerged. First, some would only report if the erroneous results were not spotted by the laboratory, were clinically authorized, and available to view by ward staff. Second, several suggested that it is the ward’s responsibility to report these for follow-up but could not provide evidence that this actually happens.
Discussion
This survey has highlighted that there is wide variation in how UK laboratories manage specimen contamination and there is opportunity for improvement in this area. Based on participants’ responses and published evidence, we make a number of recommendations.
Identifying specimen contamination in the laboratory
It is not always straightforward to identify instances of specimen contamination and it is likely that many cases go unnoticed. Obtaining definitive information regarding phlebotomy errors from the point of care is often difficult if not impossible. There is a lack of consensus and professional guidance on how best to identify it. In a multicentre study, identifying EDTA contamination in the laboratory using surrogate markers alone missed half of cases. 4 Furthermore, contamination by blood tube additives may be more common than many of us are aware. In a study by Cornes et al., approximately 25% of ‘hyperkalaemic’ samples had a significant amount of EDTA present when assayed directly. 5 Perhaps more worrying, genuine cases of hypokalaemia may be masked as normokalaemia in EDTA-contaminated samples and may be missed using surrogate markers. 6 By the same analogy, true cases of hypercalcaemia and hypomagnesaemia may be missed.
Sodium citrate contamination is characterized by hypernatraemia with disproportionately low serum chloride and a negative osmolar gap. In addition, a lower sodium concentration by direct ISE than indirect ISE measurement may be another feature of sodium citrate contamination. 7 Although often helpful, none of these surrogate markers alone are completely reliable and the effects may be subtle.
The issue of specimen contamination by blood tube additives is not restricted to clinical chemistry. Contamination of citrated blood by EDTA may generate a significant bias in routine clotting assays which has significant implications for patient safety and management. 8 There are potential dilution effects on any analyte due to pouring one sample containing additives into another sample.
Despite a potential role for assay of blood tube additives (e.g. EDTA and citrate) to help identify contamination, the present data show that their use is not widespread in the UK at present. We speculate reasons for this might include lack of awareness of the issue, lack of availability of assays by the main automated equipment suppliers, and/or difficulties incorporating these into existing workflows. Validation of EDTA measurement in routine testing has been previously described
9
and may be a useful starting point towards implementation.
Recommendation 1: Laboratories should have protocols including simple algorithms to help BMS and Clinical Scientist/Chemical Pathologists identify specimen contamination.
Recommendation 2: Where possible, laboratories should consider application of local EDTA and citrate assays in protocols to help identify and confirm contamination from these anticoagulants.
Monitoring specimen contamination
Traditionally, relatively little attention has been paid to samples before they reach the laboratory, and preanalytical errors are often under-reported. It is well established that a narrow approach to process monitoring, which overlooks pre- and postanalytical errors, may be an important source of patient harm.
10
The move to ISO15189:2012 by UK Accreditation Service (UKAS) has extended the scope of laboratory quality management into the extra-analytical phases; however, there is no specific reference to contaminated samples in these standards. There have been several international attempts to raise the profile of the preanalytical phase which includes monitoring sample contamination. A recent survey by the ACB-PA-WG highlighted non-standardized, mainly manual approaches to monitoring such errors by UK laboratories, which has undoubtedly hindered progress in this area.
3
In the absence of harmonized approaches to monitoring sample contamination, it is difficult to set quality ‘goals’ or targets for laboratories to strive towards. Indeed, the large variation in specimen contamination rates observed in the present survey is probably due, at least in part, to variation in local protocols (or lack of) for identifying and confirming specimen contamination alongside mechanisms to record and retrieve these. There is no simple solution, but the best approaches will require close collaboration with LIMS and other IT software experts. Lack of universal guidance in this area should not be a barrier to laboratories deriving local protocols to monitor specimen contamination, and attempt to minimize it, on a regular basis. It is encouraging that the recent survey
3
highlighted most UK laboratories are keen to implement automated methods but perhaps have simply not had the guidance to do so. The ACB-PA-WG is leading in this area and plans to provide guidance on how to implement automated methods for data collection in the near future. The intention is to include online learning resources, e.g. e-learning packages and meetings, to facilitate implementation.
Recommendation 3: Laboratories should endeavour to devise automated method(s) for recording specimen contamination that is easily retrievable and can be monitored by laboratory management at regular intervals as defined in agreed protocols.
Recommendation 4: Laboratories should be aware of the most common types and sources of contamination and seek quality improvement initiatives to minimise it.
Preventing specimen contamination
National and international (WHO, EFLM, CLSI) guidelines recommend that the order of draw of blood during phlebotomy should be blood culture/sterile tubes, then plain tubes/gel barrier tubes, then tubes containing additives. 11 This prevents contamination of specimen tubes with various additives (e.g. K-EDTA, Na-citrate, heparin, etc.) from previous tubes that could cause spurious results, especially during suboptimal phlebotomy conditions. Of these, spurious hyperkalaemia is the most clinically serious and is most likely to lead to patient mismanagement. When a closed-loop blood collection system is used following the manufacturer’s instructions, order of draw is seemingly not important. However, an observational study in a UK emergency department demonstrated 52% of samples were taken in an open-syringe method and often the EDTA tube was filled first. 12 Failure to follow the order of draw has been observed in other large-scale studies. 13 Awareness campaigns highlighting the order of draw among those collecting blood have been shown to be effective in reducing specimen contamination by up to 75% but do not eliminate it.14,15 Rapid turnover of staff in some healthcare settings necessitates that training and education in this area must be part of an ongoing process. Recent guidance from EFLM on ‘best practice’ venous blood collection conditions is a welcome step towards improving sample quality. 16 Of note, the document offers practical guidance on how to implement these recommendations locally.
We believe blood tube manufacturers have an important role to play to help overcome these issues. Since syringe filling is common practice, better blood tube design is needed to help prevent cross contamination. Alternatively, a review of liquid versus powder coating with anticoagulant is required.
Apart from anticoagulants, there are many other potential contaminants that may be introduced before, during or after sample collection. These have been comprehensively reviewed elsewhere
17
and will not be covered in detail here. A good example is that the concentration of some therapeutic drugs (e.g. phenytoin) in specimens stored for extended periods might be artificially decreased as a result of interaction with polymeric gel barriers and measurements would then be clinically misleading.
18
Gel separators are also known to causing interfering peaks in some mass spectrometry assays. In addition, clot activators, tube stoppers, tube walls, lubricants and surfactants can also have an effect on laboratory results. These types of interferences may selectively affect some manufacturer’s assays but not others
19
and might explain the mixed response in the present survey for whether gel tubes are avoided for particular analytes. Alternatively, lack of awareness of these issues could explain the variation in current practice. Furthermore, the current quality control and external quality assessment programmes in UK laboratories are not sensitive to these types of errors creating even more of a challenge. Blood tube manufacturers are aware of some of these issues and are actively working towards minimising these effects
20
; however, laboratory professionals must remain vigilant.
Recommendation 5: Laboratories should play a key role in promoting best ‘order of draw’ practice among all clinical staff involved in phlebotomy as defined in international guidelines.
Recommendation 6: Blood tube manufacturers have a responsibility to ensure optimal blood tube design to help prevent cross contamination of anticoagulants.
Recommendation 7: Laboratories should have a clear policy on which specimen types are suitable for trace element analysis and have strict acceptance criteria in order to prevent contamination from blood tube components, gel barriers, preservatives etc.
Reporting of results
There is little consensus from the data collected on whether and how best to report results on specimens suspected of contamination. There are probably two main reasons for this. The evidence base in this area, focusing on outcomes for patients, is weak, leading to a lack of guidance from professional bodies. In addition, every scenario is different and it appears that clinical judgement from laboratory staff and Clinical Biochemists currently has a large role in the decision-making process. Indeed there is a strong rationale for reflective rather than absolute, cut-off-based decision-making criteria. The decision to report result(s) on contaminated samples should ideally be analyte-specific since some are more sensitive than others. However, it would be prudent for laboratories to develop simple protocols covering the most frequent types of contamination, that take into consideration the index of suspicion, which is often multifactorial.
Recommendation 8: Laboratories should have protocols defining which circumstances it is safe to report results on specimens that are or might be contaminated, and those in which results should not be reported.
Risk management
Incident reporting is a fundamental aspect of improving patient safety and experience. The NHS has a well-developed clinical incidents reporting system which is a tool by which patient safety issues can be identified and addressed to reduce their occurrence. However, there is good quality evidence that clinical incidents resulting from preanalytical errors are underreported. 21 Consistent with this, the survey established that a large proportion of contamination events are not being reported by UK laboratories. Barriers to incident reporting include fear of reprisals, loss of reputation, extra work or poor understanding of the process of reporting. 22 Furthermore, it was evident that some believe that it is not laboratories’ responsibility to report contamination events which is unsatisfactory if these are being completely ignored. Once logged, responses to investigation of errors are likely to be heterogeneous, some of which have the opportunity for learning and quality improvement.
Efforts to minimize sample contamination ought to be directed towards clinical areas which struggle with it most. Respondents perceive this to be a greater issue for inpatients compared with outpatients or primary care and there is some evidence in the literature to support this. In a study by Sharratt and colleagues, proven EDTA-contaminated samples originated from inpatients (68%), outpatients (19%) and primary care (13%) 6 which is not dissimilar to the present survey findings. While trained phlebotomists perform most venous blood collection in UK hospital inpatients, the survey demonstrated that nurses and doctors also contribute significantly. Consequently, training and education plans such as reinforcing correct of order draw should be developed locally, involve laboratories, and be directed towards the main staff group(s) responsible for phlebotomy.
Finally, there is a perception by many that specimen contamination has only low or minor impact on patient safety and experience. While that might be true most of the time, the potential for unnecessary referrals, investigations and treatment is real.
Recommendation 9: In partnership with hospital management, laboratories and clinical staff should be clear on responsibilities for recording and following up episodes of specimen contamination in patient risk management systems.
Recommendation 10: There should be continuous dialogue between laboratory professionals and clinical colleagues to highlight specimen contamination as a potential source of poor patient experience or harm.
Conclusions
In summary, despite the well-recognized negative effects of specimen contamination for patients, this survey highlights several deficiencies in identifying and managing the issue in UK laboratories. Specimen contamination creates a unique challenge for laboratories as it mostly occurs before the specimen even reaches the laboratory. These data and recommendations are intended to form the basis for ‘best practice’ guidance in this area of laboratory practice in which several gaps remain. In particular, a clear description of logical approaches to identifying, recording and monitoring contamination is now required. However, by working in partnership with clinical colleagues and including other key stakeholders we believe laboratory professionals can and should take a lead in quality and safety improvement in this area.
Footnotes
Acknowledgements
We thank members of the NCBAG for their input into the survey questionnaire. We would also like to thank Mike Lester and Ashley Shalloe of the ACB main office, for their assistance in organising circulation of the survey and coordinating responses. We also thank all those who took time to complete the questionnaire.
Contributorship
CC conceived the survey. JJL and CC designed the survey and received input from the National Clinical Biochemistry Audit Group (NCBAG). JJL analysed the data and wrote the first draft. JJL and CC reviewed and edited the article. Both authors approved the final version of the article.
Declaration of conflicting interests
The author(s) declared no potential conflicts of interest with respect to the research, authorship, and/or publication of this article.
Funding
The author(s) received no financial support for the research, authorship, and/or publication of this article.
Ethical approval
Not applicable.
Guarantor
JJL.