
Abstract
Background
Short-chain fatty acids are primarily absorbed through the portal vein during lipid digestion, which is utilized as the energy source, as well as prevent type 2 diabetes and some cancers. However, reports on the determination of these short-chain fatty acids in human serum are limited.
Methods
Blood samples from human subjects (n = 547, male/female = 246/301, age 58.85 ± 12.57) were collected. Saponification was applied to obtain total fatty acid. After derivatization by 2-nitrophenylhydrazine, fatty acid 4:0 and fatty acid 6:0 were measured by liquid chromatography-mass spectrometry.
Results
The developed method exhibited good linearity (R2 = 0.9996 for both). All the coefficients of variation of reproducibility and accuracy for fatty acid 4:0 and fatty acid 6:0 ranged 3.0%−6.1%, with the average recoveries of 87.8%−102.4% and 92.2%−98.2%, respectively. In all the samples, the concentration of fatty acid 4:0 (162.4 ± 76.4 μmol/L) was significantly higher than fatty acid 6:0 (2.0 ± 2.5 μmol/L, P < 0.001). Furthermore, the esterified form was predominant in both fatty acid 4:0 and fatty acid 6:0 (98.2% and 82.4% of total fatty acids, respectively). Besides, short-chain fatty acids showed no significant differences with regard to sex or age differences.
Conclusion
This developed liquid chromatography-mass spectrometry method is convenient and reliable, which might be useful for monitoring the variations of short-chain fatty acids in blood.
Introduction
Short-chain fatty acids (SCFAs), also referred to as volatile fatty acids (VFAs), are widely known as the end products of bacterial metabolites generated via the fermentation of dietary fibers. 1 Approximately 90% of the SCFAs in the human body are absorbed in the colon and transported to the liver through the hepatic vein, while the residual amount is excreted through the faeces.2,3 In recent years, there is an increasing trend that recognizes SCFAs as mediators of the local gut and systemic health, 4 along with the growing studies on their positive physiological effects.5,6 Taking butyrate as an example, evidence has shown the uptake of butyrate by the colonic epithelium, confirming that butyrate is preferentially utilized by colonocytes as the primary energy source. 7 After absorbed, butyrate is involved in various types of therapeutic effects, such as the improvement of type 2 diabetes,4,8 the reduction of cholesterol production,2,9 the prevention of colon cancer 10 and the limiting of intestinal inflammation. 1 Furthermore, among SCFAs, butyrate serves as the most potent promoter of intestinal regulatory T cells in vitro and the only one that showed the niacin receptor 1 (NIACR1) ligand. 11
It should be noted that the esterified fatty acid (EFA) and free fatty acid (FFA) show different physiological characteristics. For example, tricaproin (TG 6:0/6:0/6:0) induces radical production of oxygen in neutrophils, while the free caproic acid (FFA 6:0) exerts no clear such effect. 12 Moreover, it is known that long chain FFA can affect gene expression of macrophages, adipocytes or endothelial cells, 13 and the elevation of its concentration is associated with most of the metabolic disorders, including impaired glucose utilization, impaired insulin secretion, dyslipidaemia, pro-thrombotic, etc.14,15 But there is a quite limited study on the effect of short-chain FFA. The bioactivity difference between EFA and FFA demands us for the attention on both of them. Thus, for SCFA determination, it is necessary to determine not only its esterified but also its free form.
Most of the studies on SCFA determination relied on gas chromatography (GC), combined with either flame ionization detector (FID) or mass spectrometry (MS).16–19 High-performance liquid chromatography (HPLC) is a good alternative method for SCFA analysis, the greatest advantage of which over GC is the use of lower running temperatures.17,20 In terms of HPLC, approaches with derivatization could improve the separation and sensitivity. One of the derivatization-based methods, using acidic 2-nitrophenylhydrazine hydrochloride (2-NPH·HCl) with or without saponification, has been described for the determination of both FFA and EFA in biological materials. 21 The author 21 demonstrated that the developed method was simple, rapid and reliable. And this method has been applied in our laboratory for determining medium-chain fatty acid (MCFA) and long-chain fatty acid (LCFA) of their total and free forms in various samples, ranging from the clinical blood sample to the commercial milk.22–24 However, the strategy of HPLC with NPH-derivatization was not applicable for SCFAs in our laboratory, due to the poor resolution and the interference in chromatography.
Liquid chromatography-mass spectrometry (LC-MS) is considered as an ideal approach for analysing targets in the complex matrix, like biological samples, as it provides chromatographic separation along with highly sensitive and selective detection. Derivatization for LC-MS can help enhancing the ionization efficiency, as well as increasing the retention time and m/z, which avoid potential suppression effects. Also, an ingenious derivatization will be a strategy for controlling fragmentation in MS. 25 But to the best of our knowledge, there is no study that reports SCFA determination by LC-MS/MS and NPH-derivatization.
Therefore, the aims of the present study are to develop a practical NPH-derived LC-MS/MS method for the determination of SCFAs in the blood sample and to apply the developed method to clinical samples. The butanoic acid (FA 4:0) and caproic acid (FA 6:0) were treated as our targets, and their contents of both free and esterified forms were investigated.
Materials and methods
Chemicals
LC/MS grade methanol, n-hexane and water were purchased from Wako Pure Chemical (Osaka, Japan). Ammonium acetate was purchased from Sigma-Aldrich (St. Louis, MO, USA). Other chemicals and reagents were of analytical grade and purchased from Kanto Chemical Industry (Tokyo, Japan) unless specified.
FA 4:0, FA 6:0 and the internal standard (ISTD) undecanoic acid (FA 11:0) were purchased from Sigma-Aldrich, while NPH of these FA was previously synthesized in our laboratory. 22 The FA NPH-derivatization kit, which contains 2-NPH·HCl, N-(3-dimethylaminopropyl)-N′-ethylcarbodiimide hydrochloride (EDC·HCl), potassium phosphate buffer (pH 4.6), was provided by YMC Co., Ltd (Kyoto, Japan).
Specimens and serum collection
Ethical approvals for this study were obtained, and informed consent was obtained from all individuals. Fasting blood sample was collected from 547 Japanese volunteers (246 males, mean age ± SD: 58.4 ± 12.6 years; 301 females, mean age ± SD: 59.1 ± 12.4 years; shown in Figure S1 of Supplemental Material). All the volunteers were inform the Suttsu District, Hokkaido, Japan (42°47′N, 140°14′E). All the serum samples were separated by centrifugation within 30 min of collection, and then stored at –80°C until tested.
Sample preparation
The serum sample preparation procedure was done in accordance to Shrestha et al. as previously reported. 23 In brief, a portion of serum (25 μL for total FA, 100 μL for free FA) was spiked with the ISTD FA 11:0 (2 nmoL). For the total FA determination, saponification was performed by mixing the serum with 100 μL of 0.3 M KOH-EtOH and heating at 80°C for 45 min. Then, derivatization was performed by adding 2-NPH·HCl and EDC·HCl and incubating at 60°C for 20 min. FA-NPH derivatives were obtained by potassium phosphate buffer and n-hexane extraction, followed by vacuum drying of the n-hexane layer. Finally, the residue was dissolved in 200 mL of methanol and stored at −80°C before injection.
LC-MS/MS analysis
LC-MS/MS was performed using a Surveyor HPLC system and a TSQ Quantum Access MAX mass spectrometer with a heated electrospray ionization (H-ESI) probe (Thermo Fisher Scientific Inc., Waltham, MA, USA). LC was carried out on an Ascentis® Express Phenyl-Hexyl column (5 cm × 2.1 mm I.D., 2.7 μm, Supelco, Inc., Bellefonte, PA, USA) at 45°C. The injection volume was set at 1.0 μL. The mobile phase consisted of 5 mM aqueous ammonium acetate (A), isopropanol (B) and methanol (C) at a flow rate of 200 μL/min. The following gradient elution was applied: 0.0−0.5 min 65% A and 35% C; 0.5–1.0 min 30% A, 20% B, 50% C; 1.0−4.5 min 5% A, 30% B, 65% C; 4.5–5.0 min 33% B, 67% C; this ratio was maintained for 8.0 min; 8.0–10.0 min returned to initial gradient for re-equilibration.
The selected reaction monitoring (SRM) under negative mode was utilized for MS detection, and the main parameters were optimized. Spray voltage was set at 3000 V. Nitrogen was used as the sheath gas and the auxiliary gas (set at 50 psi and 10 psi, respectively). The vaporizer temperature and the capillary temperature were set at 350°C and 200°C, respectively. Collision gas (argon) pressure was set at 1.8 mTorr. Quantification was conducted by the workstation Thermo Xcalibur 2.1 software (Thermo Fisher Scientific, Inc., Waltham, MA, USA).
Method validation
Stock solutions (200 μmol/L) of FA 4:0, FA 6:0 and FA 11:0 were prepared in methanol by measuring their dry weight on an ultrasensitive electro-balance (Cubis® ultra micro balance, Sartorius Inc., Göttingen, Germany), and stored at −40°C. To determine linearity, the FA 4:0 and FA 6:0 standard solutions with amounts of 0.25, 0.5, 1.5, 2.5, 5, 10 nmoL and 3.125, 6.25, 10, 25, 50, 200 pmoL were prepared, respectively. Each standard solution contained 2 nmoL of the ISTD FA 11:0. The integration of the peak area and the plotting of each calibration curve were performed by Xcalibur. The limit of quantification (LOQ) was defined as the level of signal-to-noise ratio ≥10. Both reproducibility and recovery assays were tested in six replicated analyses for the independently prepared serum samples. Recovery was calculated with the following formula

Statistics
Statistical analysis was conducted using the unpaired two-tailed t-test, one-way and two-way ANOVA (using the Tukey post-hoc test), which was performed by Prism 6.0 (GraphPad Software, Inc., La Jolla, CA, USA). P < 0.05 was considered to be statistically significant. All the shown data are presented as the means ± standard deviation (SD). Pearson’s correlation coefficient was performed with JMP 10.0 (SAS Institute Inc., Cary., NC, USA).
Results and discussion
Optimization of LC-MS/MS
The optimized SRM conditions of FA-NPH together with their acquired chromatograms are shown in Figure 1. All the three analytes showed identical sharp peaks of similar retention times in both standard mixture solutions and serum samples, respectively, indicating the acceptable interference by matrix effect. Besides, all the analytes (ISTD included) could be eluted in less than 5 min, and the total run time for one injection could be controlled within 10 min by this method, suggesting it as convenient, commercial and capable of testing a large number of samples.
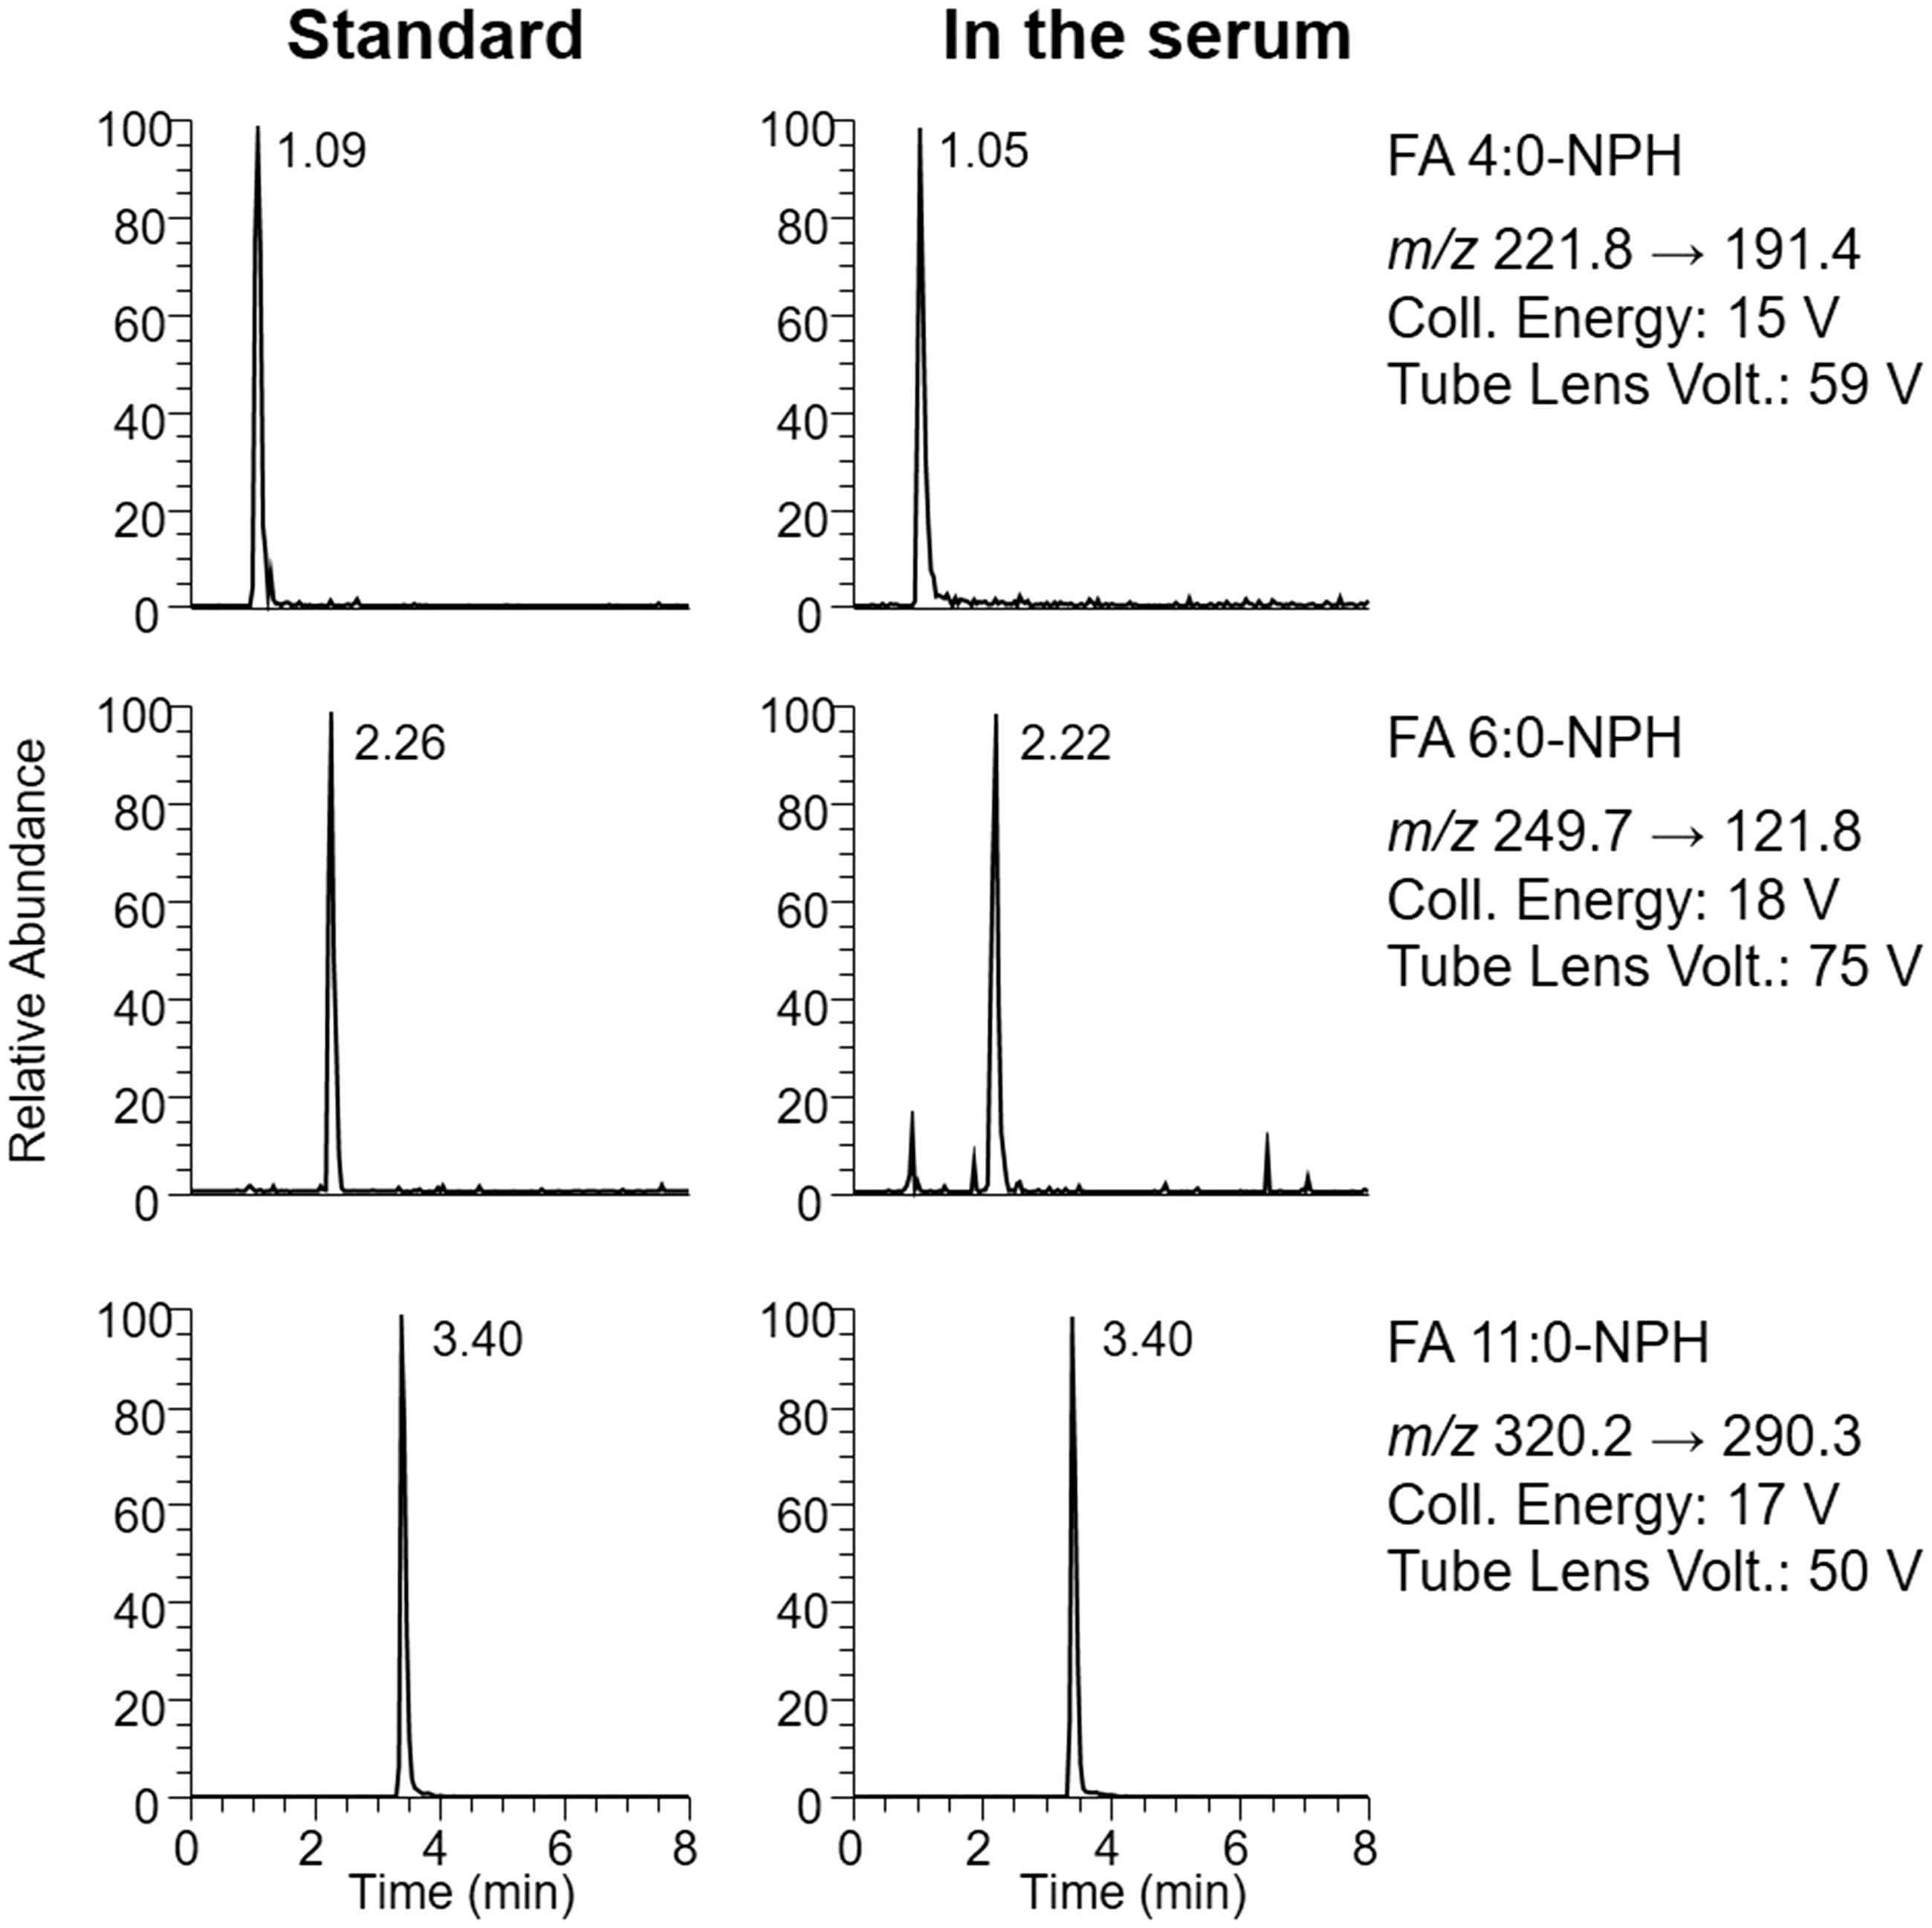
The representative SRM chromatograms of FA-NPH in standard mixture solutions (left) and in the serum sample (right).
Method validation
The calibration curve was constructed by plotting the FA 4:0-NPH or FA 6:0-NPH to FA 11:0-NPH peak area ratio (y) against the amount of corresponding FA (x, nmoL). Both the calibration curves showed good linearity and acceptable ranges (for FA 4:0, y = 0.0058x−0.0006, R2 = 0.9996; for FA 6:0, y = 0.1715x−0.0004, R2 = 0.9996; shown in Figure S2 of Supplemental Material). The LOQs were 5 pmoL and 0.12 pmoL for FA 4:0 and FA 6:0, respectively.
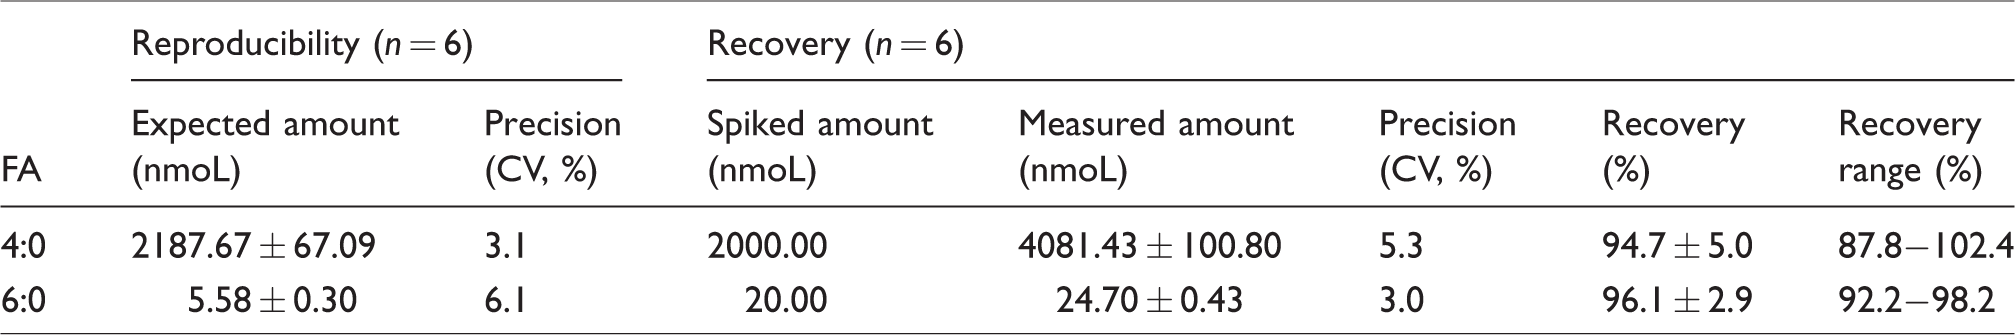
The reproducibility and recovery of the present method were determined by analysing the serum of volunteers added to the certain concentration of FA 4:0 and FA 6:0 in six replicates, respectively (shown in Table 1). For FA 4:0, the coefficient of variation (CV) of reproducibility and recovery was 3.1% and 5.3%, respectively, while for FA 6:0, the values were 6.1% and 3.0%, respectively, suggesting the favourable precision. The average recoveries of them were 94.7 ± 5.0% and 96.1 ± 2.9%, respectively. From these results, the developed method was confirmed to show sufficient performance to determine the two SCFA species in clinical specimens.
Reproducibility and accuracy of FA 4:0 and FA 6:0 in serum.
Comparison of the total, free and esterified SCFAs in human serum
Serum samples collected from 547 subjects were measured for FA 4:0 and FA 6:0 of both total and free forms by the developed LC-MS/MS method. And the esterified FA content was calculated as the difference in total FA minus free FA. The concentrations among FA 4:0 and FA 6:0 of their total, free and esterified form exhibited significant difference (P < 0.05, shown in Figure 2). The amount of FA 4:0 was significantly higher than that of FA 6:0 (162.39 ± 76.36 and 1.97 ± 2.51 μmol/L, respectively, P < 0.001), suggesting FA 4:0 to be the major SCFA in this study. In terms of FA forms, the average concentrations of free and esterified FA 4:0 were 2.63 ± 0.83 and 159.39 ± 76.79 μmol/L, respectively, while for FA 6:0, the concentrations were 0.35 ± 0.16 and 1.62 ± 2.49 μmol/L, respectively. The results showed that the esterified form was the predominant form in both FA 4:0 and FA 6:0 and accounted for 98.2% and 82.4% of its corresponded total form, respectively (Figure 2).
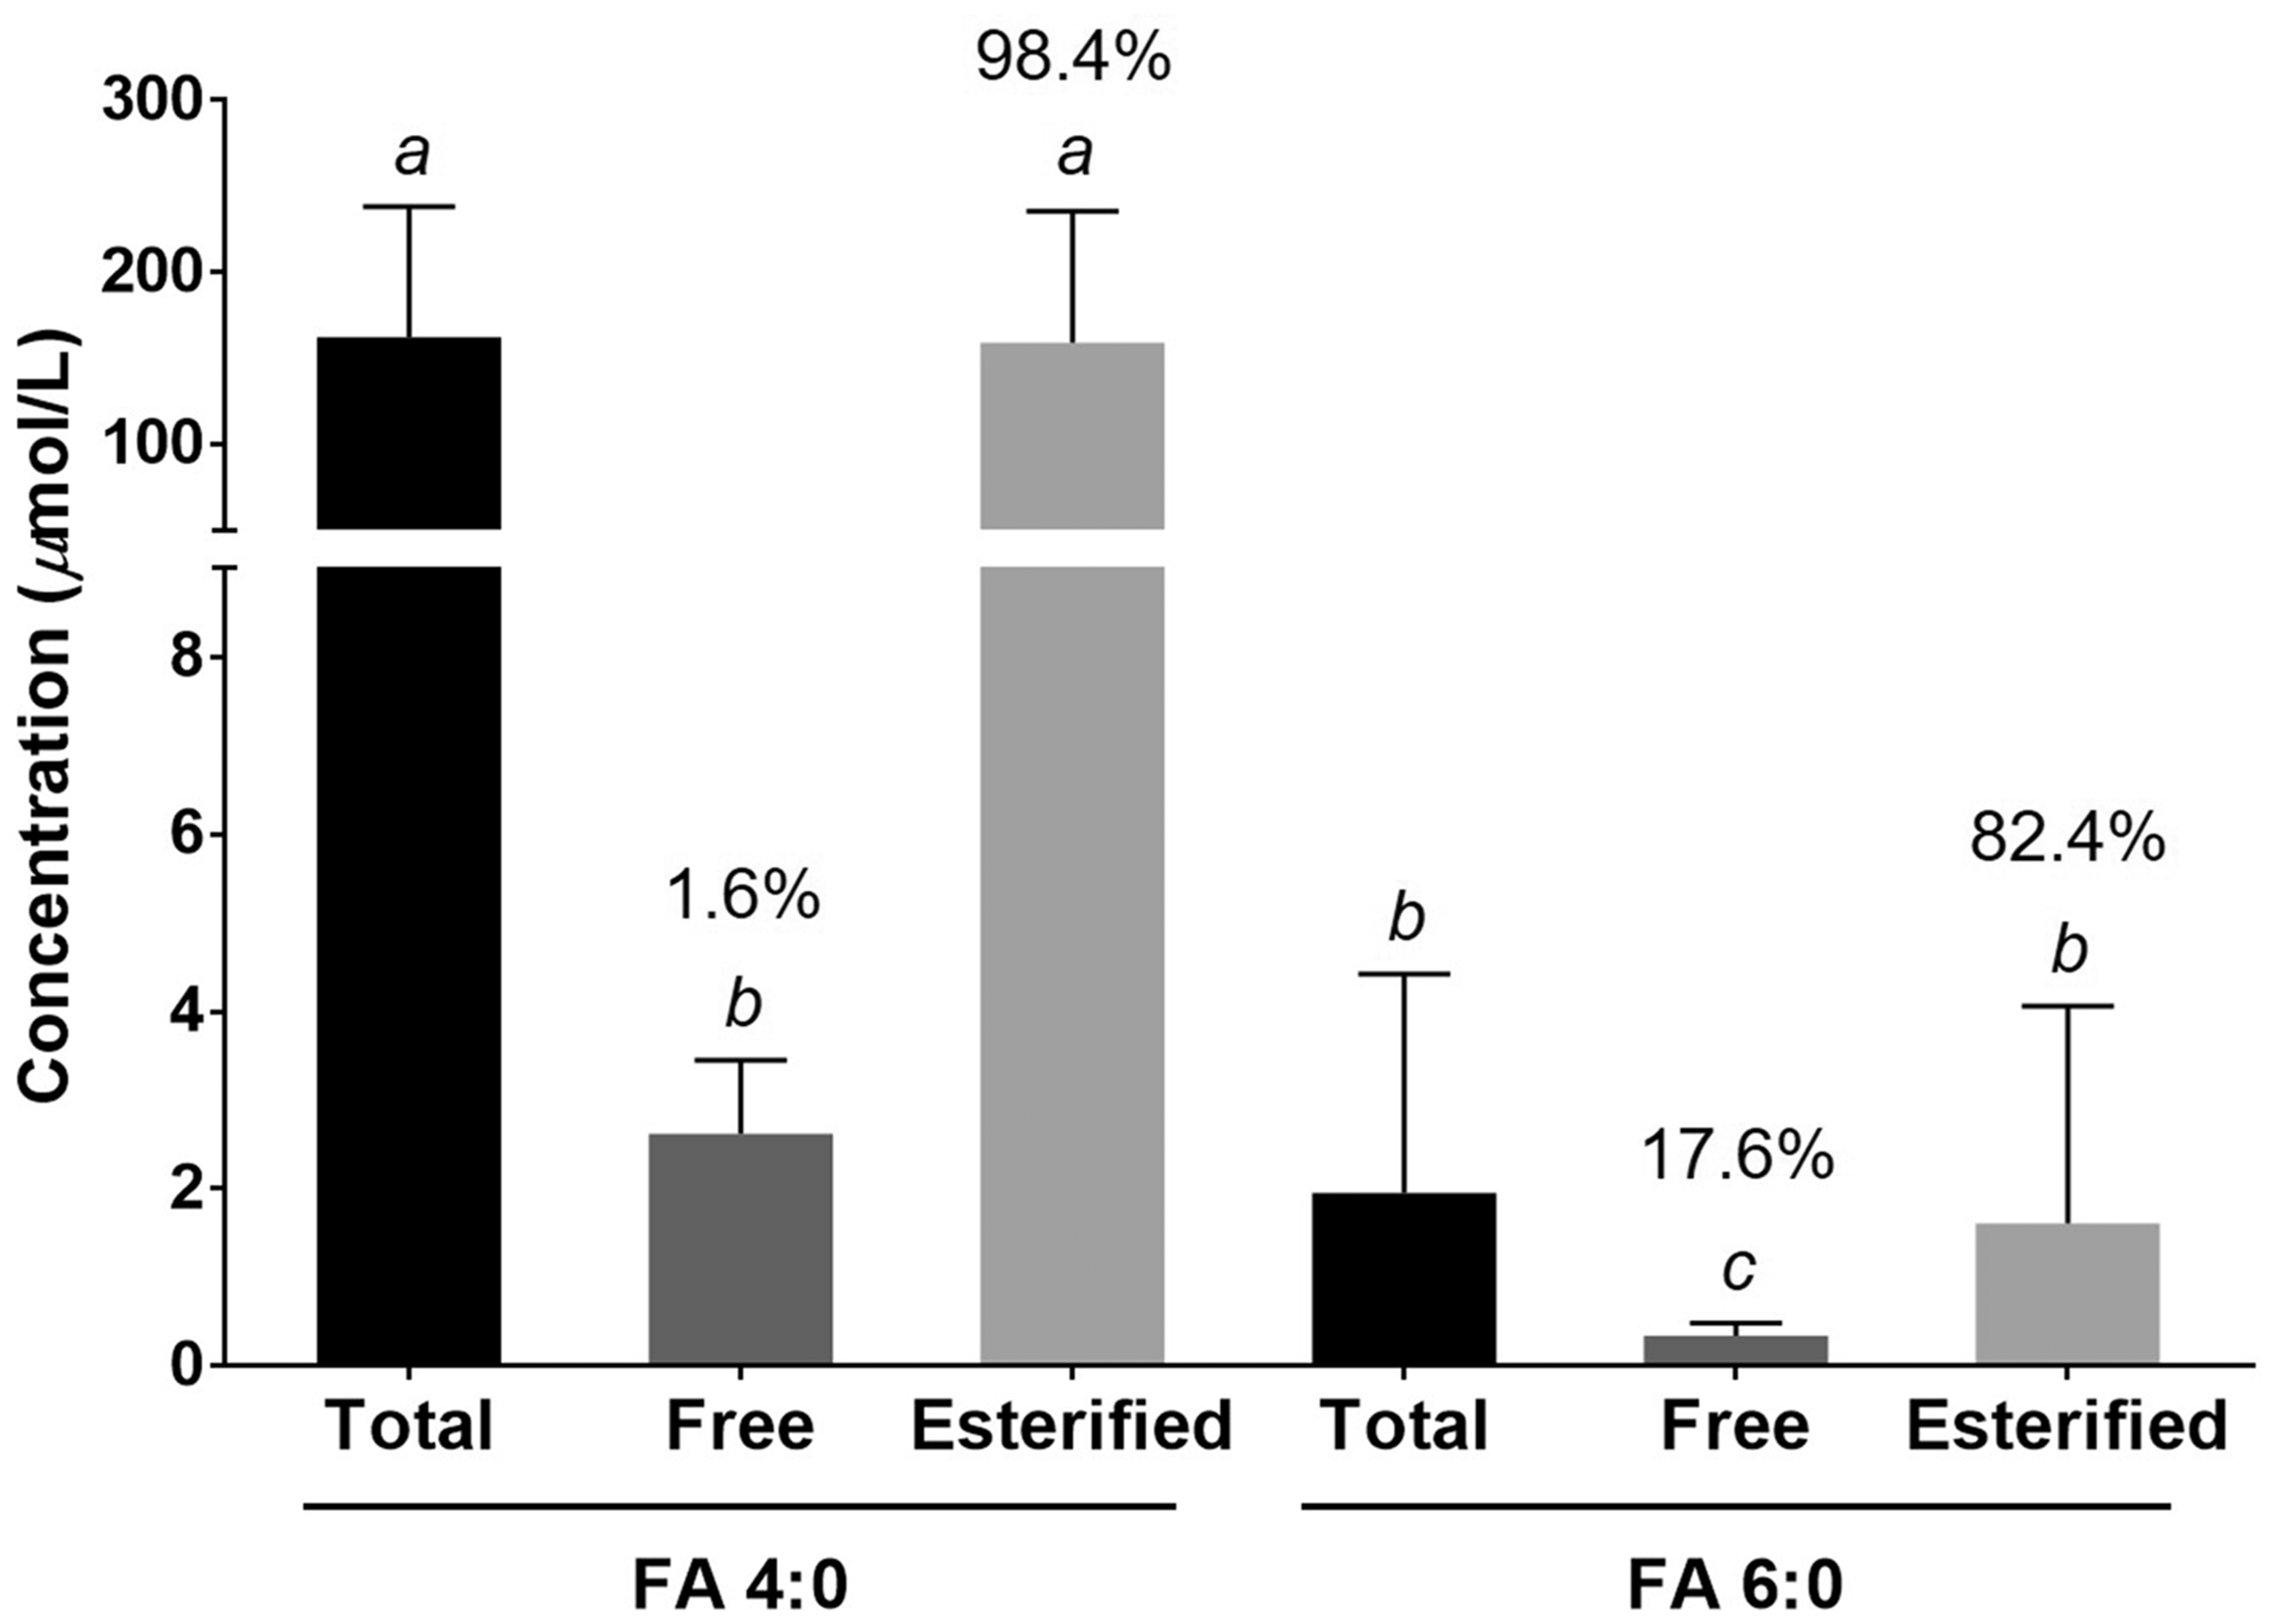
The average concentrations of FA 4:0 and FA 6:0 with their total, free and esterified forms. Bars without a common letter represent significant difference at the 0.001 probability level. Values above bars represent percentages of the corresponding total forms.
Most of the previous studies on FA 4:0 and FA 6:0 quantitation were performed by GC, with the sample preparation method including distillation, organic solvent extraction, or hollow fibre supported liquid membrane extraction,16,18,26,27 while van Eijk et al. measured SCFAs via LC-MS with the pretreatment of methanol extraction. 28 All the above studies seemed to be targeting free SCFAs due to their pretreatment procedures. In our experiment, the concentrations of free FA 4:0 and free FA 6:0 were similar to their results (FA 4:0 varied from 0.9 ± 0.2 μmol/L to 2.5–29.6 μmol/L, and FA 6:0 ranged from 1.4−9.7 μmol/L to 4.1 ± 0.8 μmol/L).
Furthermore, in the present work, the total and esterified forms of FA 4:0 and FA 6:0 were also investigated. Based on the concentration of total, free and esterified forms of FA 4:0 and FA 6:0, respectively, the Pearson’s correlation coefficients were calculated, and the scatter plots are generated in Figure 3. A very strong correlation between the amount of total and its esterified form was observed (for the total and esterified FA 4:0, r = 0.9999, P < 0.0001, Figure 3(a); for the total and esterified FA 6:0, r = 0.9984, P < 0.0001, Figure 3(b)). However, there was no correlation between free and esterified form, or total and free form (r < 0.15 for all in Figure 3(c) to (f)).
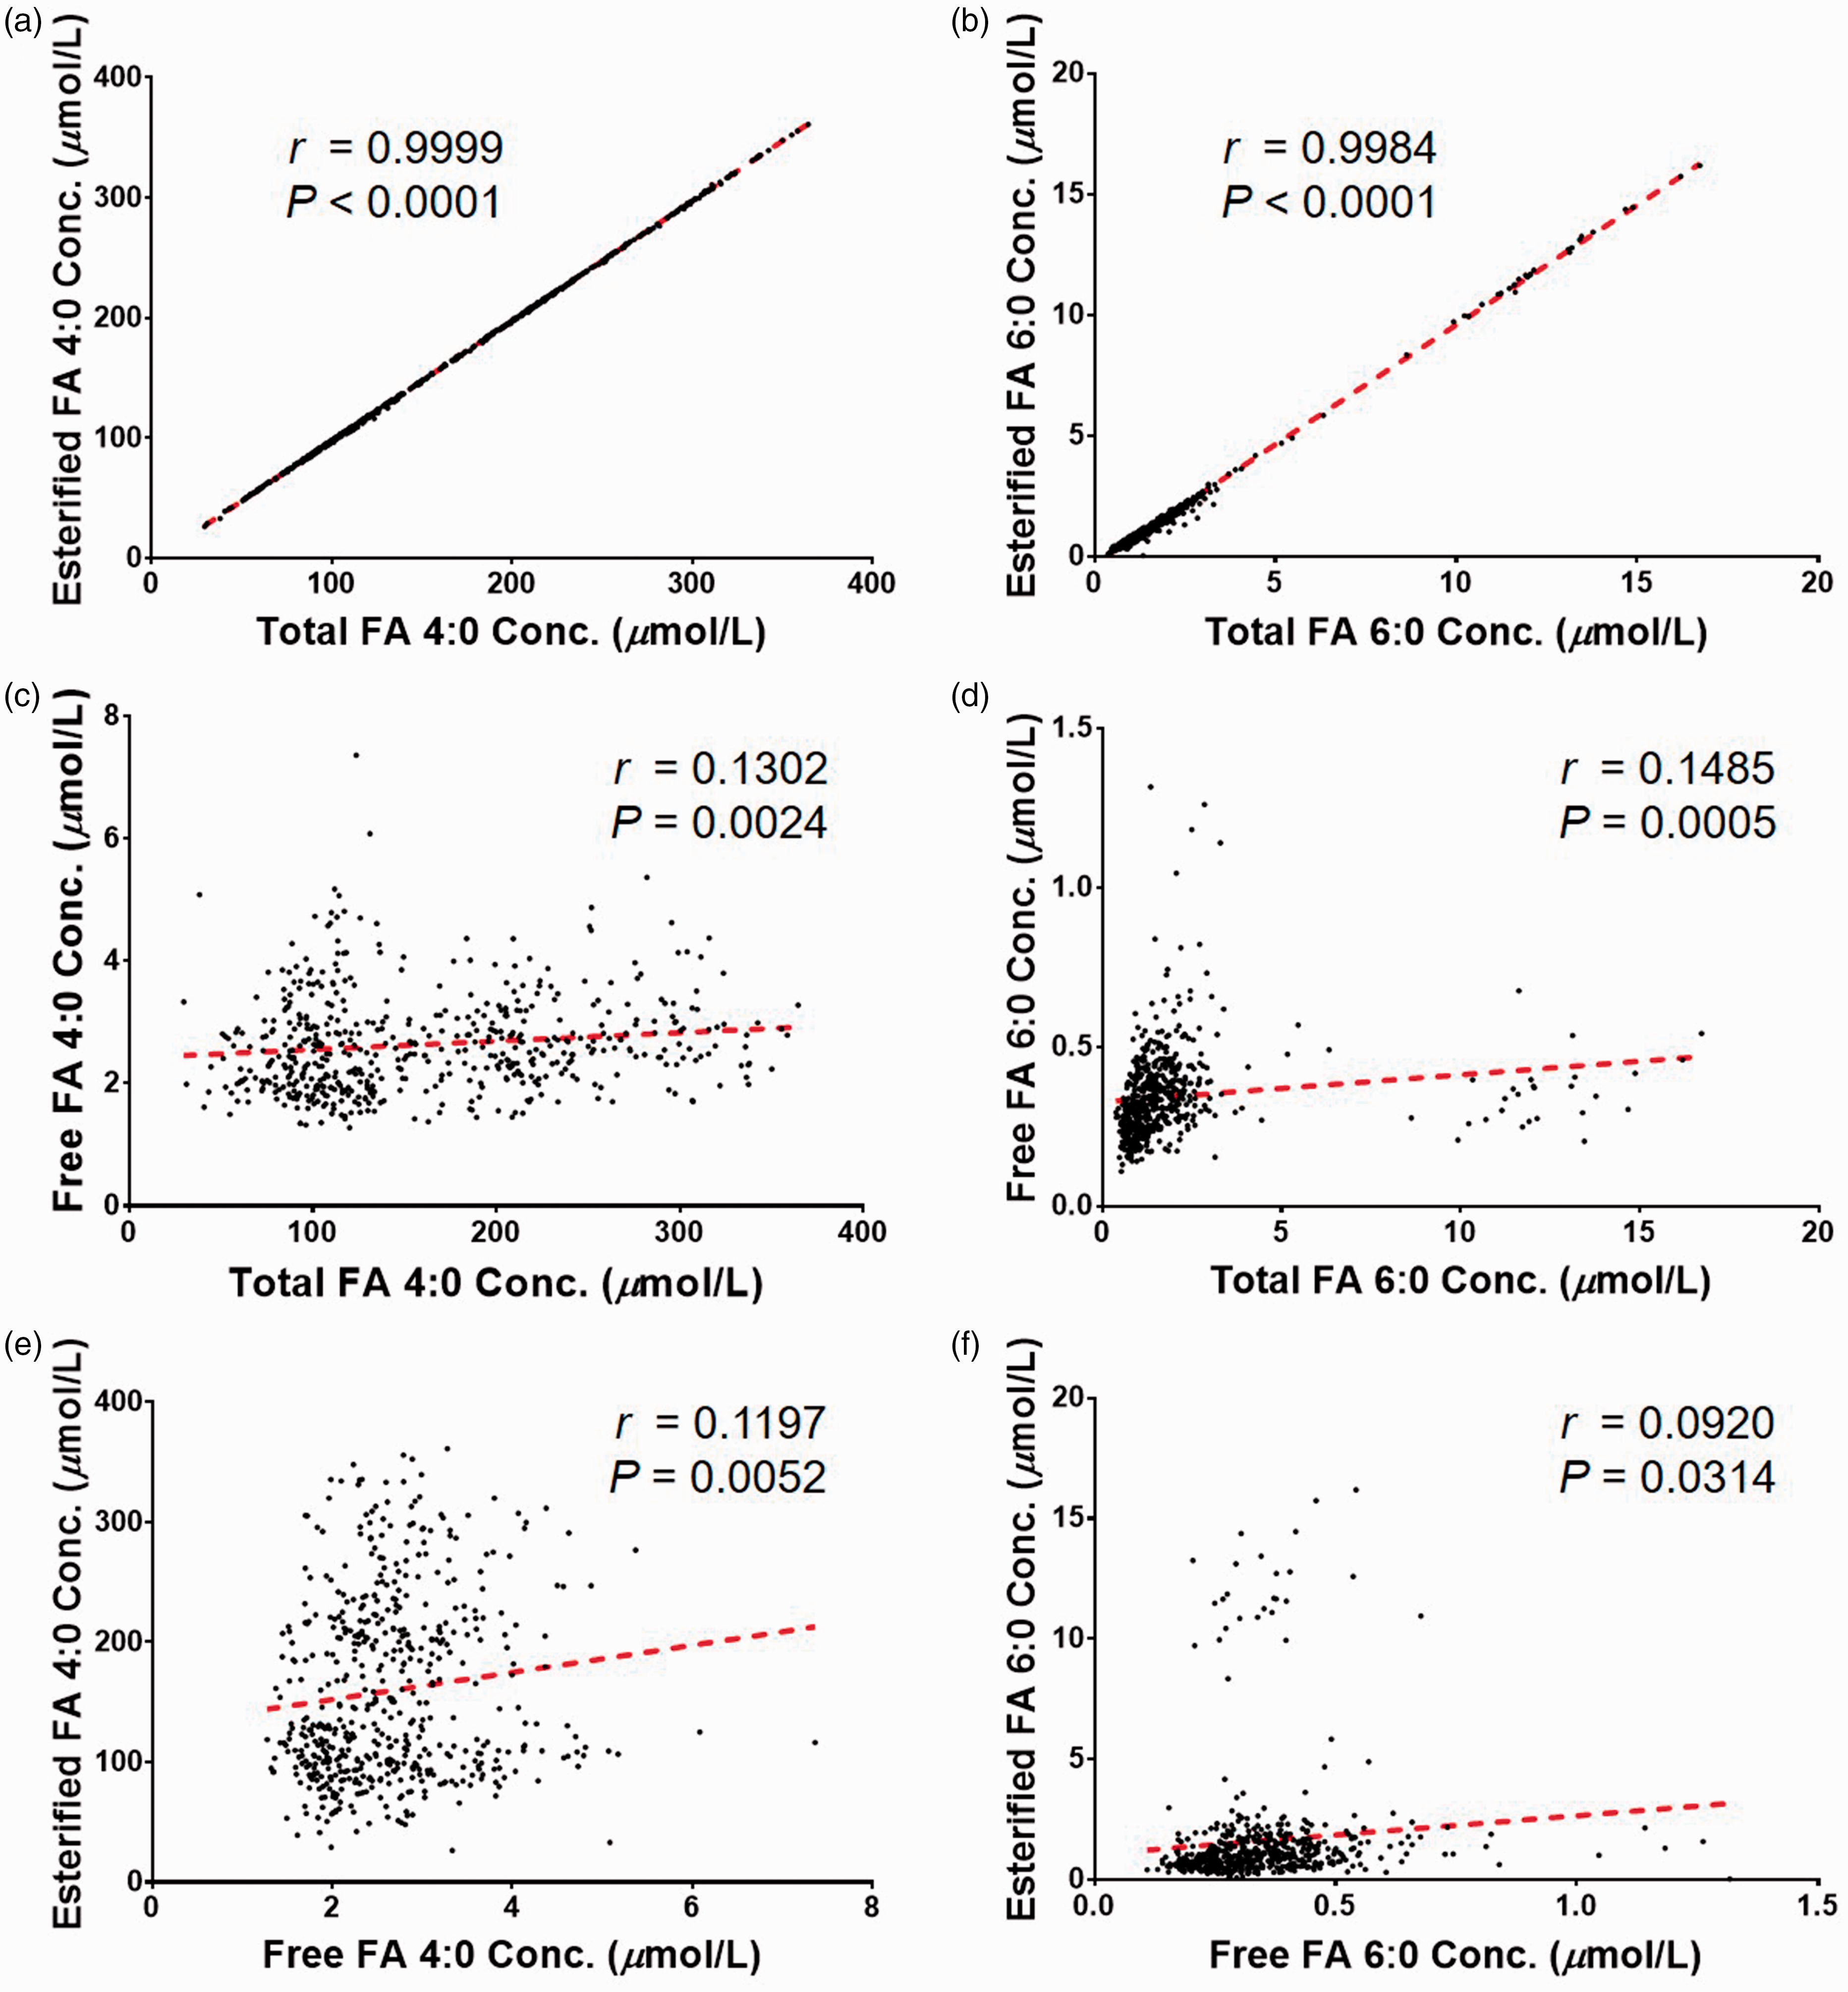
Pearson’s correlation coefficient among the total, esterified and free forms of FA 4:0 (a, c, e) and FA 6:0 (b, d, f).
Studies showed that the elevation of plasma FFA leads to a shift from unsaturated to saturated fatty-acyl chains in membrane phospholipids, which promotes the physical attractive van der Waals interactions between phospholipid acyl chains, increasing the stiffness of both erythrocyte and endothelial membranes, and finally resulting in vascular and neurological lesions, and a various metabolic diseases. 29 However, as the free SCFA does not directly construct or reconstruct the cell membrane, its content variation might affect the body health through other ways, such as cell signalling or enzymatic reaction.
SCFA variation with sex and ages
The variation of SCFAs between male and female of different ages (grouped as 30−39, 40−49, 50−59, 60−69 and 70−79 years old) was compared (shown in Figure 4). For total FA 4:0 in male, the concentration ranged from 184.47 ± 73.99 μmol/L (50−59 group) to 138.93 ± 67.12 μmol/L (70−79 group), while in female, the concentration ranged from 183.76 ± 81.08 μmol/L (40−49 group) to 142.73 ± 75.02 μmol/L (30−39 group) (Figure 4(a)). For total FA 6:0, the highest and lowest concentrations in male were presented in 60−69 group (2.05 ± 2.42 μmol/L) and 40−49 group (1.58 ± 2.15 μmol/L), respectively, while in female, they were presented in 40−49 group (2.27 ± 3.37 μmol/L) and 30−39 group (1.42 ± 0.74 μmol/L), respectively (Figure 4(b)). There was no significant difference between male and female, or among different ages (P > 0.05 for all the comparison), suggesting the limited influence from sex and age factors to these two SCFAs in the human serum. Besides, as the quite large deviations have shown, it might be indicated that serum SCFA content especially for FA 6:0, varies along with individual differences, which might include multiple factors, including hormone, dietary, sports, etc. Moreover, the similar trend could be observed in free FA 4:0, free FA 6:0, esterified FA 4:0 and esterified FA 6:0 (Figure 4(c) to (f)).
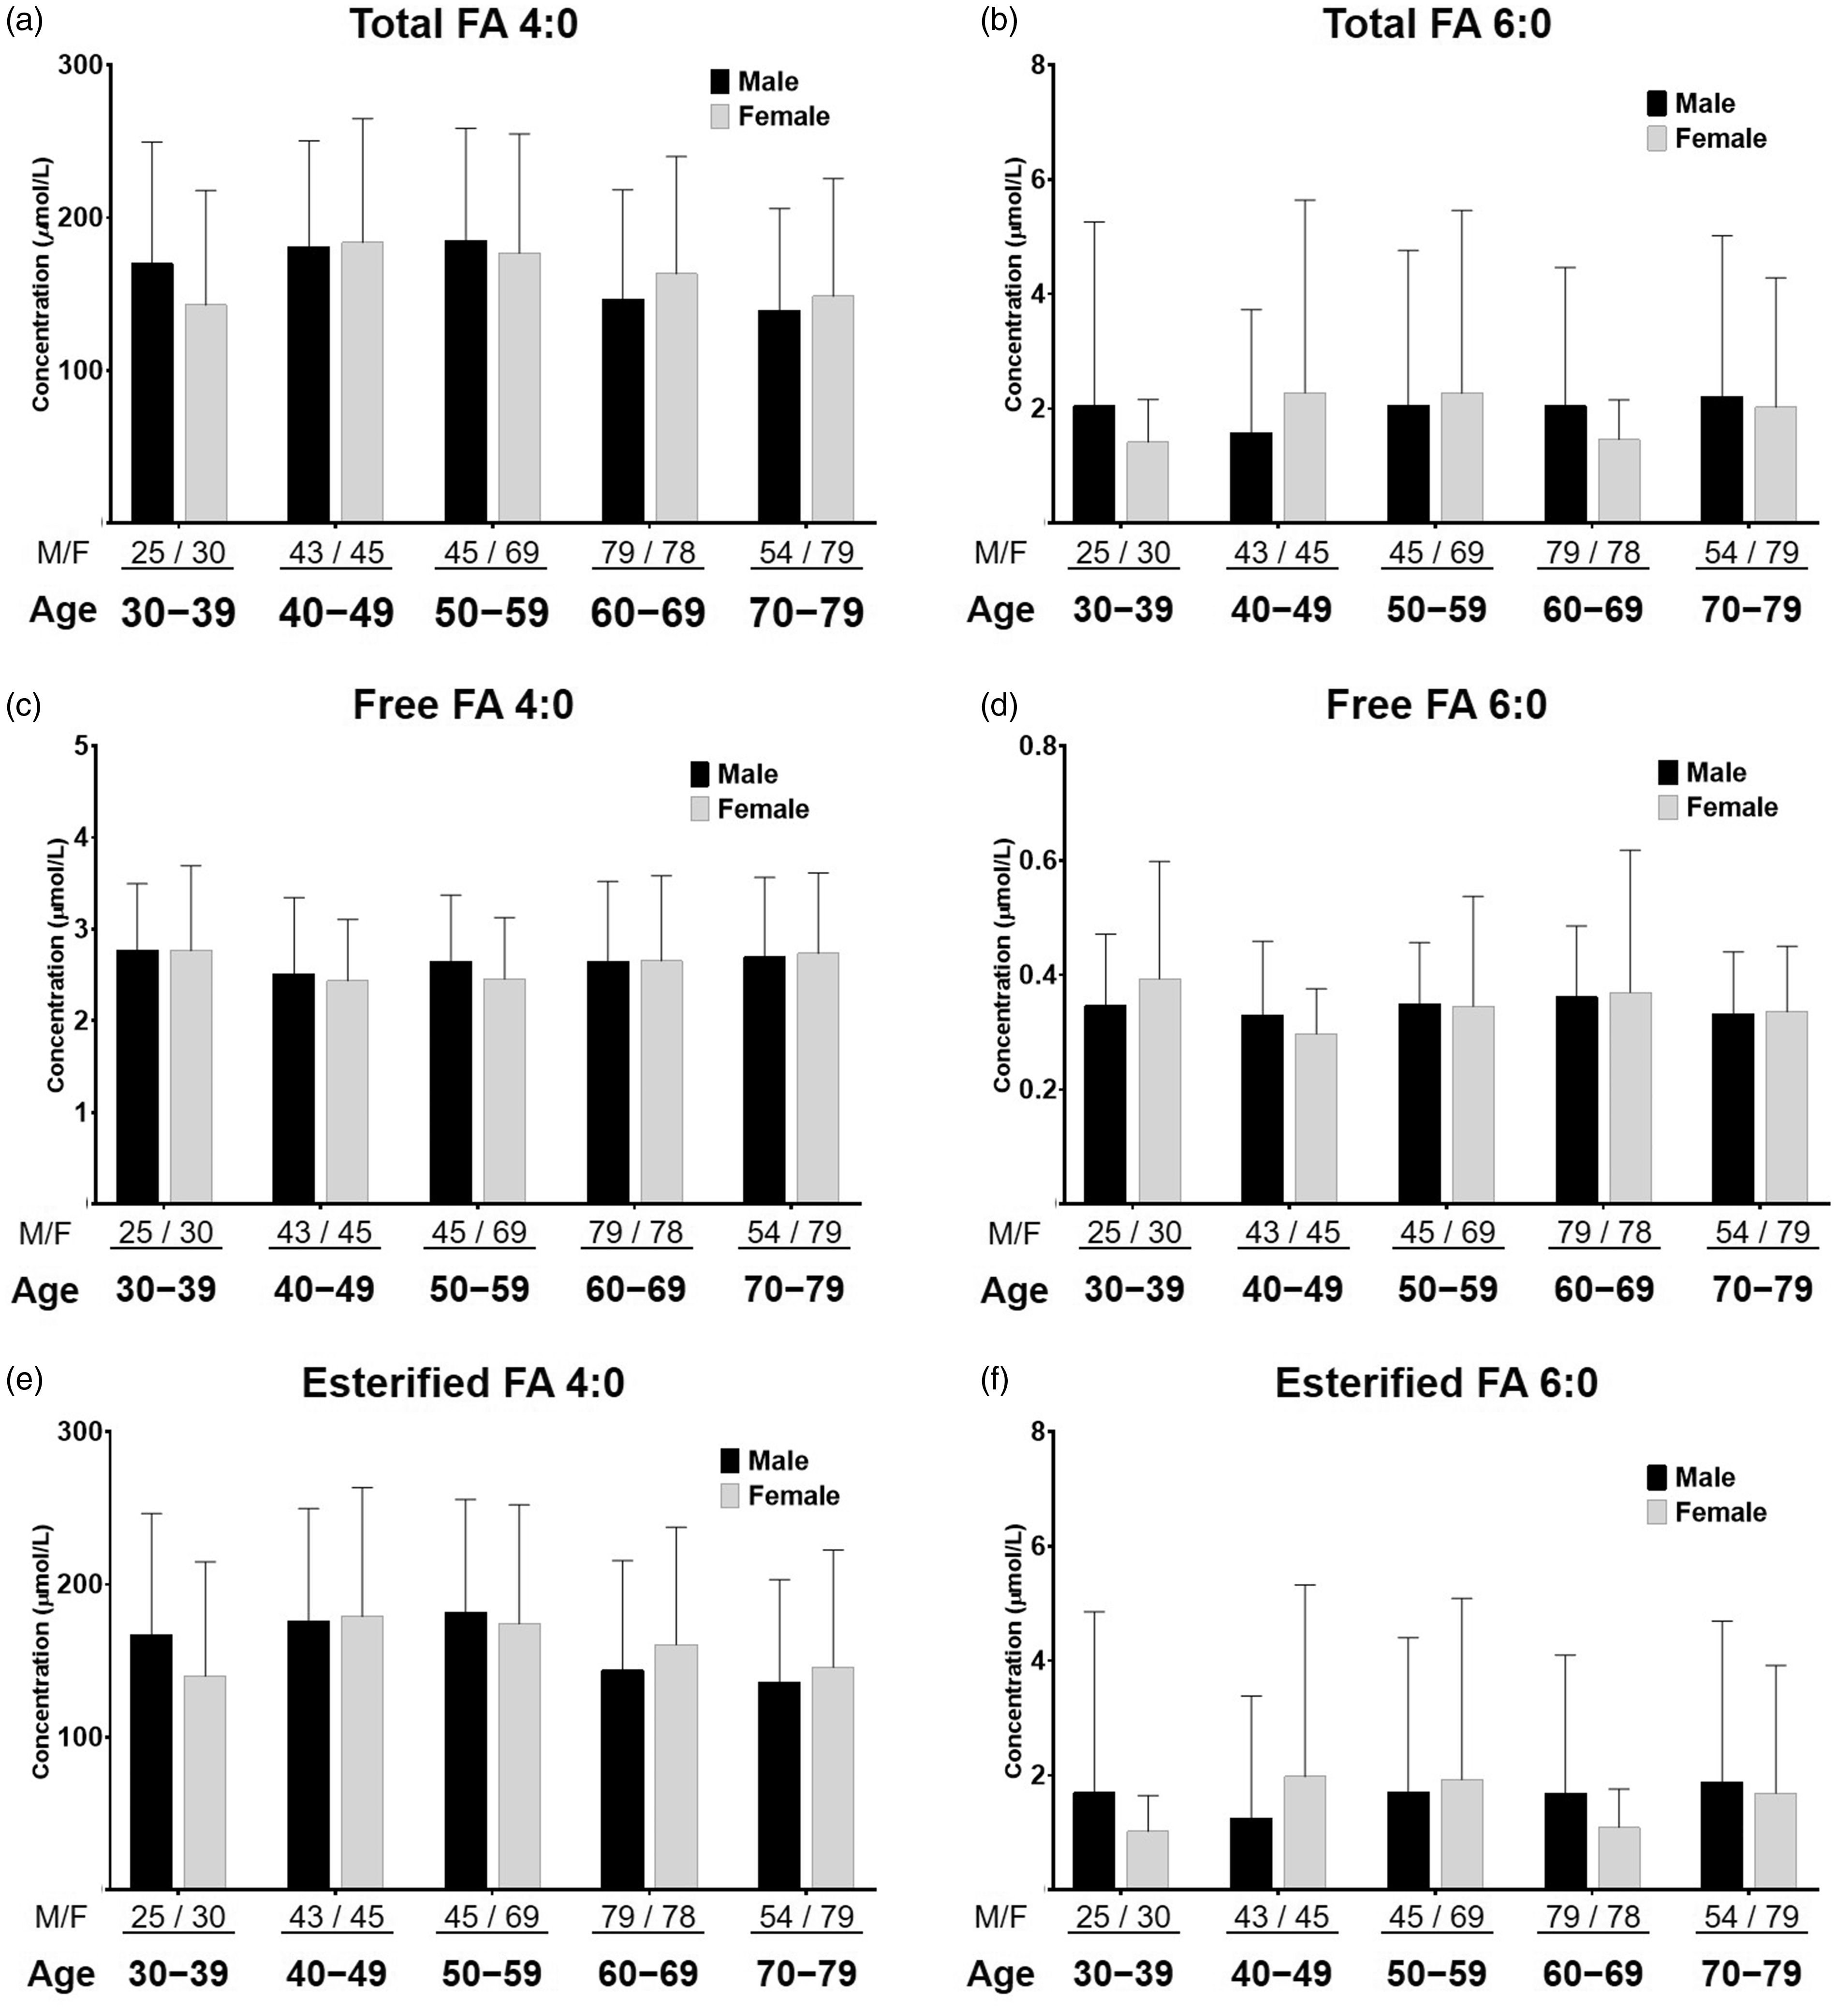
Variations of FA 4:0 and FA 6:0 with total, free and esterified forms between male and female of different ages. Sample numbers are presented as M/F (male/female).
According to the review by Lohner et al., the LCFA in plasma total lipid, such as FA 20:4 n-6 and FA 20:5 n-3, showed significantly lower contribution in men than in women. 30 And Asciutti-Moura et al. demonstrated that the older people have less circulating essential fatty acids (such as FA 18:2 n-6 and FA 20:4 n-6) due to diet and metabolism. 31 These polyunsaturated FAs exert the biological actions, including maintaining cell-membrane fluidity, inhibiting inflammatory processes, decreasing secretion of proinflammatory cytokines by monocytes/macrophages, etc., 32 which are different from SCFAs. That might be likely the explanation why the trend of SCFA content is not obvious in relation to sex or ages.
Conclusion
In the present work, a simple, precise and accurate method for determining SCFAs by LC-MS/MS was developed and applied to a large scale of human serum. The developed method might be useful for monitoring both free and esterified SCFA variations in clinical samples. For the future study, SCFA profile will be combined with biological information of subjects, to reveal the relationship between SCFA changes and lifestyle-related diseases.
Supplemental Material
Supplemental material for Determination of total, free and esterified short-chain fatty acid in human serum by liquid chromatography-mass spectrometry
Supplemental material for Determination of total, free and esterified short-chain fatty acid in human serum by liquid chromatography-mass spectrometry by Zhen Chen, Yue Wu, Rojeet Shrestha, Zijun Gao, Yaoyao Zhao, Yusuke Miura, Akiko Tamakoshi, Hitoshi Chiba and Shu-Ping Hui in Annals of Clinical Biochemistry
Footnotes
Acknowledgments
The authors would like to thank the Central Research Laboratory, Faculty of Health Sciences, Hokkaido University for kindly providing work space and equipment.
Declaration of conflicting interests
The author(s) declared no potential conflicts of interest with respect to the research, authorship, and/or publication of this article.
Funding
The author(s) disclosed receipt of the following financial support for the research, authorship, and/or publication of this article: This study was financially partially supported by (1) the Regional Innovation Strategy Support Program, Sapporo Health Innovation ‘Smart-H’, of The Ministry of Education, Culture, Sports, Sciences and Technology, Japan and (2) JSPS KAKENHI Grant Number JP16K1535306.
Ethical approval
Ethics review boards of Faculty of Health Sciences, Hokkaido University (No. 16-10) and of Graduate School of Medicine, Hokkaido University (No. 16-007) approved this study protocol.
Guarantor
S-PH.
Contributorship
S-PH and HC conducted the study design and discussion. AT, S-PH and HC were involved in sample collection. ZC, YW, and RS performed the sample preparation. ZC, YW and ZG operated the LC-MS/MS and data process. YZ and YM advised statistics. S-PH and HC reviewed the relevant literature. ZC wrote the first draft of the manuscript. YZ, ZG and WY helped correcting the mistakes. All the authors reviewed and edited the manuscript, and approved the final version of the manuscript.
References
Supplementary Material
Please find the following supplemental material available below.
For Open Access articles published under a Creative Commons License, all supplemental material carries the same license as the article it is associated with.
For non-Open Access articles published, all supplemental material carries a non-exclusive license, and permission requests for re-use of supplemental material or any part of supplemental material shall be sent directly to the copyright owner as specified in the copyright notice associated with the article.