
Abstract
Background
3-epi-25-hydroxyvitamin D3 (3-epi-25OHD3) interferes in most liquid chromatography-tandem mass spectrometry (LC-MS/MS) assays for 25-hydroxyvitamin D (25OHD). The clinical significance of this is unclear, with concentrations from undetectable to 230 nmol/L reported. Many studies have quantified 3-epi-25OHD3 based on 25OHD3 calibrators or other indirect methods, and we speculated that this contributes to the observed variability in reported 3-epi-25OHD3 concentrations.
Methods
We compared continuous MS/MS infusions of 3-epi-25OHD3 and 25OHD3 solutions, spiked both analytes into the same serum matrix and analysed patient samples to assess the effect of three different quantitation methods on 3-epi-25OHD3 concentration. Experiments were performed on an LC-MS/MS system using a phenyl column which does not resolve 3-epi-25OHD3, and a modified method utilizing a Zorbax SB-CN column that chromatographically resolves 3-epi-25OHD3 from 25OHD3.
Results
A greater 3-epi-25OHD3 signal, compared with 25OHD3, was observed during equimolar post-column continuous infusion of analyte solutions, and following analysis of a serum pool spiked with both analytes. 3-epi-25OHD3 signal enhancement was dependent on mobile phase composition. Compared with 3-epi-25OHD3 calibrators, indirect quantitation methods resulted in up to 10 times as many samples having 3-epi-25OHD3 concentrations ≥ 10 nmol/L, and an approximately fourfold increase in the maximum observed 3-epi-25OHD3 concentration to 95 nmol/L.
Conclusions
Enhanced 3-epi-25OHD3 signal leads to overestimation of its concentrations in the indirect quantitation methods used in many previous studies. The enhanced signal may contribute to greater interference in some 25OHD LC-MS/MS assays than others. We highlight that equimolar responses cannot be assumed in LC-MS/MS systems, even if two molecules are structurally similar.
Introduction
There is interference from 3-epi-25-hydroxyvitamin D3 (3-epi-25OHD3) in most liquid chromatography-tandem mass spectrometry (LC-MS/MS) 25-hydroxyvitamin D (25OHD) assays. The clinical significance of this is unclear, with some studies reporting concentrations up to 230 nmol/L, 1 but others that 3-epi-25OHD3 forms a minor proportion of total 25OHD3.2,3 This may reflect patient selection, since 3-epi-25OHD3 has been reported to be higher in infants than adults.
Some studies assume that equimolar 3-epi-25OHD3 and 25OHD3 produce equal signals in LC-MS/MS assays. 3-epi-25OHD3 quantitation has been based on 25OHD3 calibrators 1 or the difference in 25OHD3 results between an assay which chromatographically separates the epimers and one that does not. 4 We noticed high 3-epi-25OHD3 recovery in our routine 25OHD LC-MS/MS assay and speculated that 3-epi-25OHD3 produces a greater signal than 25OHD3, enhancing interference in LC-MS/MS assays and overestimating 3-epi-25OHD3 in assays lacking dedicated calibrators.
To investigate this, we spiked 3-epi-25OHD3 and 25OHD3 into serum, compared analyte infusions and analysed patient samples to assess different 3-epi-25OHD3 quantitation methods. We used two LC-MS/MS methods: our routine ‘co-elution method’ in which 25OHD3 and 3-epi-25OHD3 co-elute, and a ‘resolving method’ that chromatographically separates the epimers.
Materials and methods
Materials
25OHD3 monohydrate, 3-epi-25OHD3, methanol, ammonium acetate and zinc sulphate heptahydrate were from Sigma-Aldrich (St Louis, MO, USA). 26,26,26,27,27,27-d6-25OHD3 was from Synthetica (Oslo, Norway). Ethanol was from VWR International (Radnor, PA, USA). Isopropanol and formic acid were from Fisher Scientific (Waltham, MA, USA). All solvents were LC-MS grade. Deionized water was taken from an ELGA Purelab Option-Q15BP water deionizer (ELGA Process Water, Marlow, UK) with a resistivity reading of 18.2 MΩ-cm.
Master solutions of 25OHD3 and 3-epi-25OHD3 at a concentration of 2.5 mmol/L were prepared in ethanol. The master solution was diluted 1/250 in ethanol to produce stock solutions of approximately 10 µmol/L. Concentrations of stock 3-epi-25OHD3 and 25OHD3 solutions were determined from their absorbances at 264 nm using a molar extinction coefficient ɛ0 = 18,200 L mol−1 cm−1, 2 a UVIKON spectrophotometer (NorthStar Scientific, Potton, UK) and quartz cuvettes. 25OHD-deficient human serum pools were prepared from surplus patient samples with total 25OHD < 10 nmol/L. Dedicated 3-epi-25OHD3 calibrators were prepared in-house from 25OHD-deficient serum spiked with 3-epi-25OHD3. ChromSystems 3PLUS1® Calibrator Set (Chromsystems, Munich, Germany) was used unmodified for 25OHD3 calibration. ChromSystems MassCheck 25-hydroxyvitamin D2/D3 serum controls (Level I and II) were used as quality control (QC) material for 25OHD2 and 25OHD3. For 3-epi-25OHD3, QC material was prepared by spiking 3-epi-25OHD3 into a human serum pool.
Specimen processing
Samples underwent semi-automated solid phase extraction (SPE) 5 and analysis on a Waters ACQUITY UPLC-TQD (Waters, Milford, MA, USA). Briefly, 150 µL sample was mixed with 20 µL 26,26,26,27,27,27-d6-25OHD3 internal standard and proteins precipitated using ZnSO4 and methanol. Following centrifugation, 600 µL of supernatant was transferred to a pre-conditioned Oasis HLB (30 µm) µElution plate (Waters, Milford, MA, USA). Sample cleanup on the µElution plate was via the use of aqueous methanol solutions. Analytes were eluted by 5% isopropanol/95% methanol into 96-well polypropylene plates (Waters, Milford, MA, USA). The 96-well plate was heat-sealed, vortexed and centrifuged before analysis.
MS parameters
Analytes underwent positive electrospray ionization and detection by multiple reaction monitoring. The 25OHD3 and 3-epi-25OHD3 response was the 401.3 > 159.1 peak area (collision energy 28 eV) relative to the d6-25OHD3 internal standard 407.3 > 159.1 peak area (collision energy 28 eV). The 401.3 > 365.2 transition at a collision energy of 10 eV was used as a qualifier transition for both 25OHD3 and 3-epi-25OHD3. For infusion experiments, we also monitored the 401.3 > 383.5 transition at a collision energy of 10 eV. The cone voltage was set at 22 V and the capillary voltage at 2.5 kV for all 25OHD3 and 3-epi-25OHD3 transitions.
Chromatography
Mobile phase A was water and mobile phase B was methanol, each supplemented with 2 mmol/L ammonium acetate and 0.1% (v/v) formic acid.
The co-elution method used a Waters ACQUITY UPLC BEH Phenyl column (1.7 µm, 2.1 × 50 mm) (Waters, Milford, MA, USA) with mobile phase B increasing from 65% to 98% over 3.6 min at 0.45 ml/min followed by re-equilibration at 65% B. Analytes co-eluted at 2.7 min with a runtime of 5 min. The limit of quantitation was 7 nmol/L based on a signal-to-noise ratio of 10. Inter-batch % coefficient of variation (%CV) for 25OHD3 was < 10% at 42 nmol/L and 97 nmol/L. Recoveries of 25OHD3 spiked into serum were within 20% of target.
The resolving method used an Agilent Zorbax SB-CN column (1.8 µm, 2.1 × 50 mm) (Agilent Technologies, Santa Clara, CA, USA) with mobile phase B held at 55% for 24 min at 0.4 mL/min to resolve 25OHD3 (retention time 17.0 min) from 3-epi-25OHD3 (retention time 19.6 min). The column was washed at 98% B and reequilibrated at 55% B. The limit of quantitation was 10 nmol/L based on a signal-to-noise ratio of 10. Inter-batch %CVs were < 10% at 42 nmol/L and 91 nmol/L for 25OHD3, and 7.8% at 15 nmol/L and 11.7% at 50 nmol/L for 3-epi-25OHD3. Recoveries of 25OHD3 and 3-epi-25OHD3 spiked into serum were within 20% of target.
Spiking experiments
For spiking experiments, 25OHD-deficient serum was spiked with either 25OHD3 or 3-epi-25OHD3. In the co-elution method, the response for both sets of samples was the combined (25OHD3 + 3-epi-25OHD3) peak area divided by the d6-25OHD3 internal standard peak area, as 25OHD3 and 3-epi-25OHD3 co-eluted. The concentration was calculated as the concentration measured in the base pool (9 nmol/L) plus the concentration of 25OHD3 or 3-epi-25OHD3 spiked in the sample.
In the resolving method, the response for 25OHD3 spiked serum was the 25OHD3 peak area divided by the d6-25OHD3 internal standard peak area, and the concentration was the 25OHD3 concentration measured in the base pool (10 nmol/L), plus the concentration of 25OHD3 spiked in the sample. The response for 3-epi-25OHD3 was the 3-epi-25OHD3 peak area divided by the d6-25OHD3 internal standard peak area, and the concentration was the 3-epi-25OHD3 concentration spiked (3-epi-25OHD3 was not detected in the base pool).
Infusion experiments
For infusion experiments, 1 µmol/L 3-epi-25OHD3 and 25OHD3 solutions were prepared by dilution of stock solutions with 80:20 methanol:isopropanol and infused post-column with mobile phase.
Analysis of patients’ samples
Samples were analysed from 341 patients, of which 211 were randomly selected and 130 were chosen from children (<18 years) or because they had 25OHD concentrations > 50 nmol/L. The study included 227 female and 113 male patients (gender unknown for one subject). Seven subjects were aged < 1 year (youngest 8 days), 87 aged 1–18 years, and 247 aged > 18 years (oldest 88 years). Quantification of 3-epi-25OHD3 was performed:
using dedicated calibrators in the resolving method; using 25OHD3 calibrators in the resolving method; as the difference between 25OHD3 results in the co-elution and resolving methods.
Results
Equimolar 3-epi-25OHD3 gave a greater response than 25OHD3 when the same serum pool was spiked with either compound, being approximately 60% greater in the co-elution method, and 20% greater in the resolving method (Figure 1). This was also true when analytes were quantified using the 401.3 > 365.2 transition (data not shown).
Measured response for 25OHD-deficient serum spiked with 25OHD3 and 3-epi-25OHD3 in (a) the co-elution method and (b) the resolving method.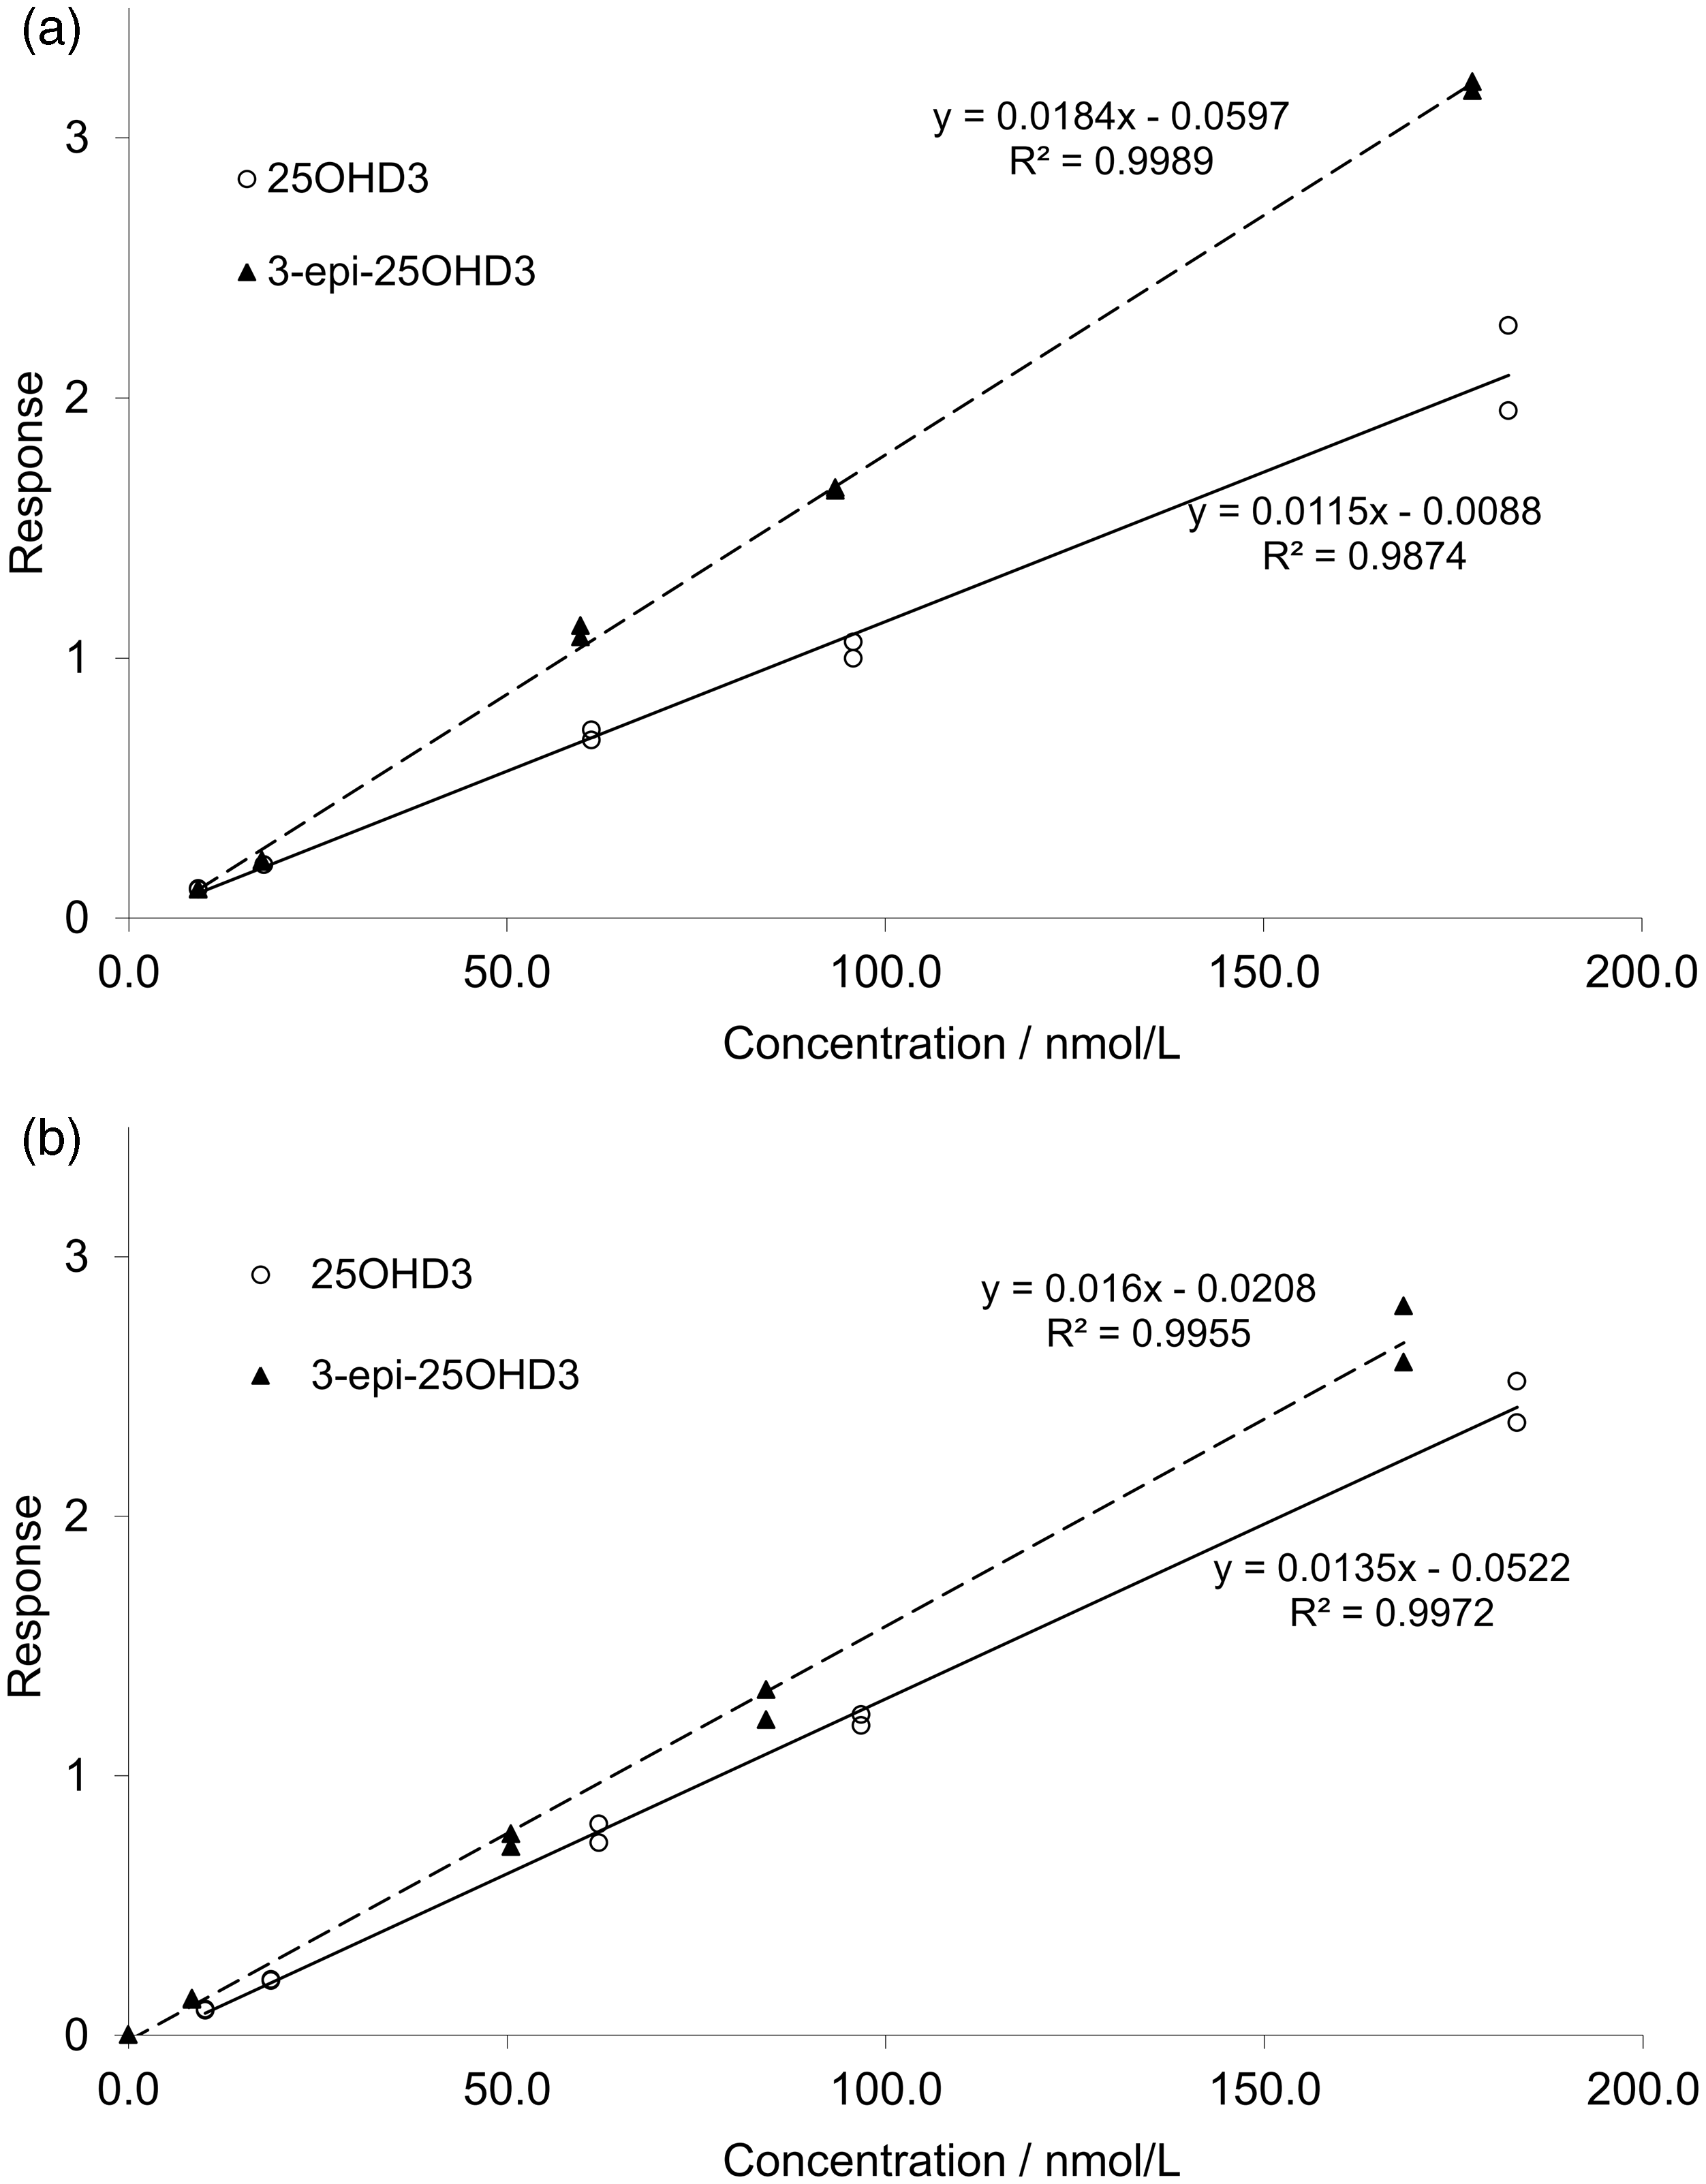
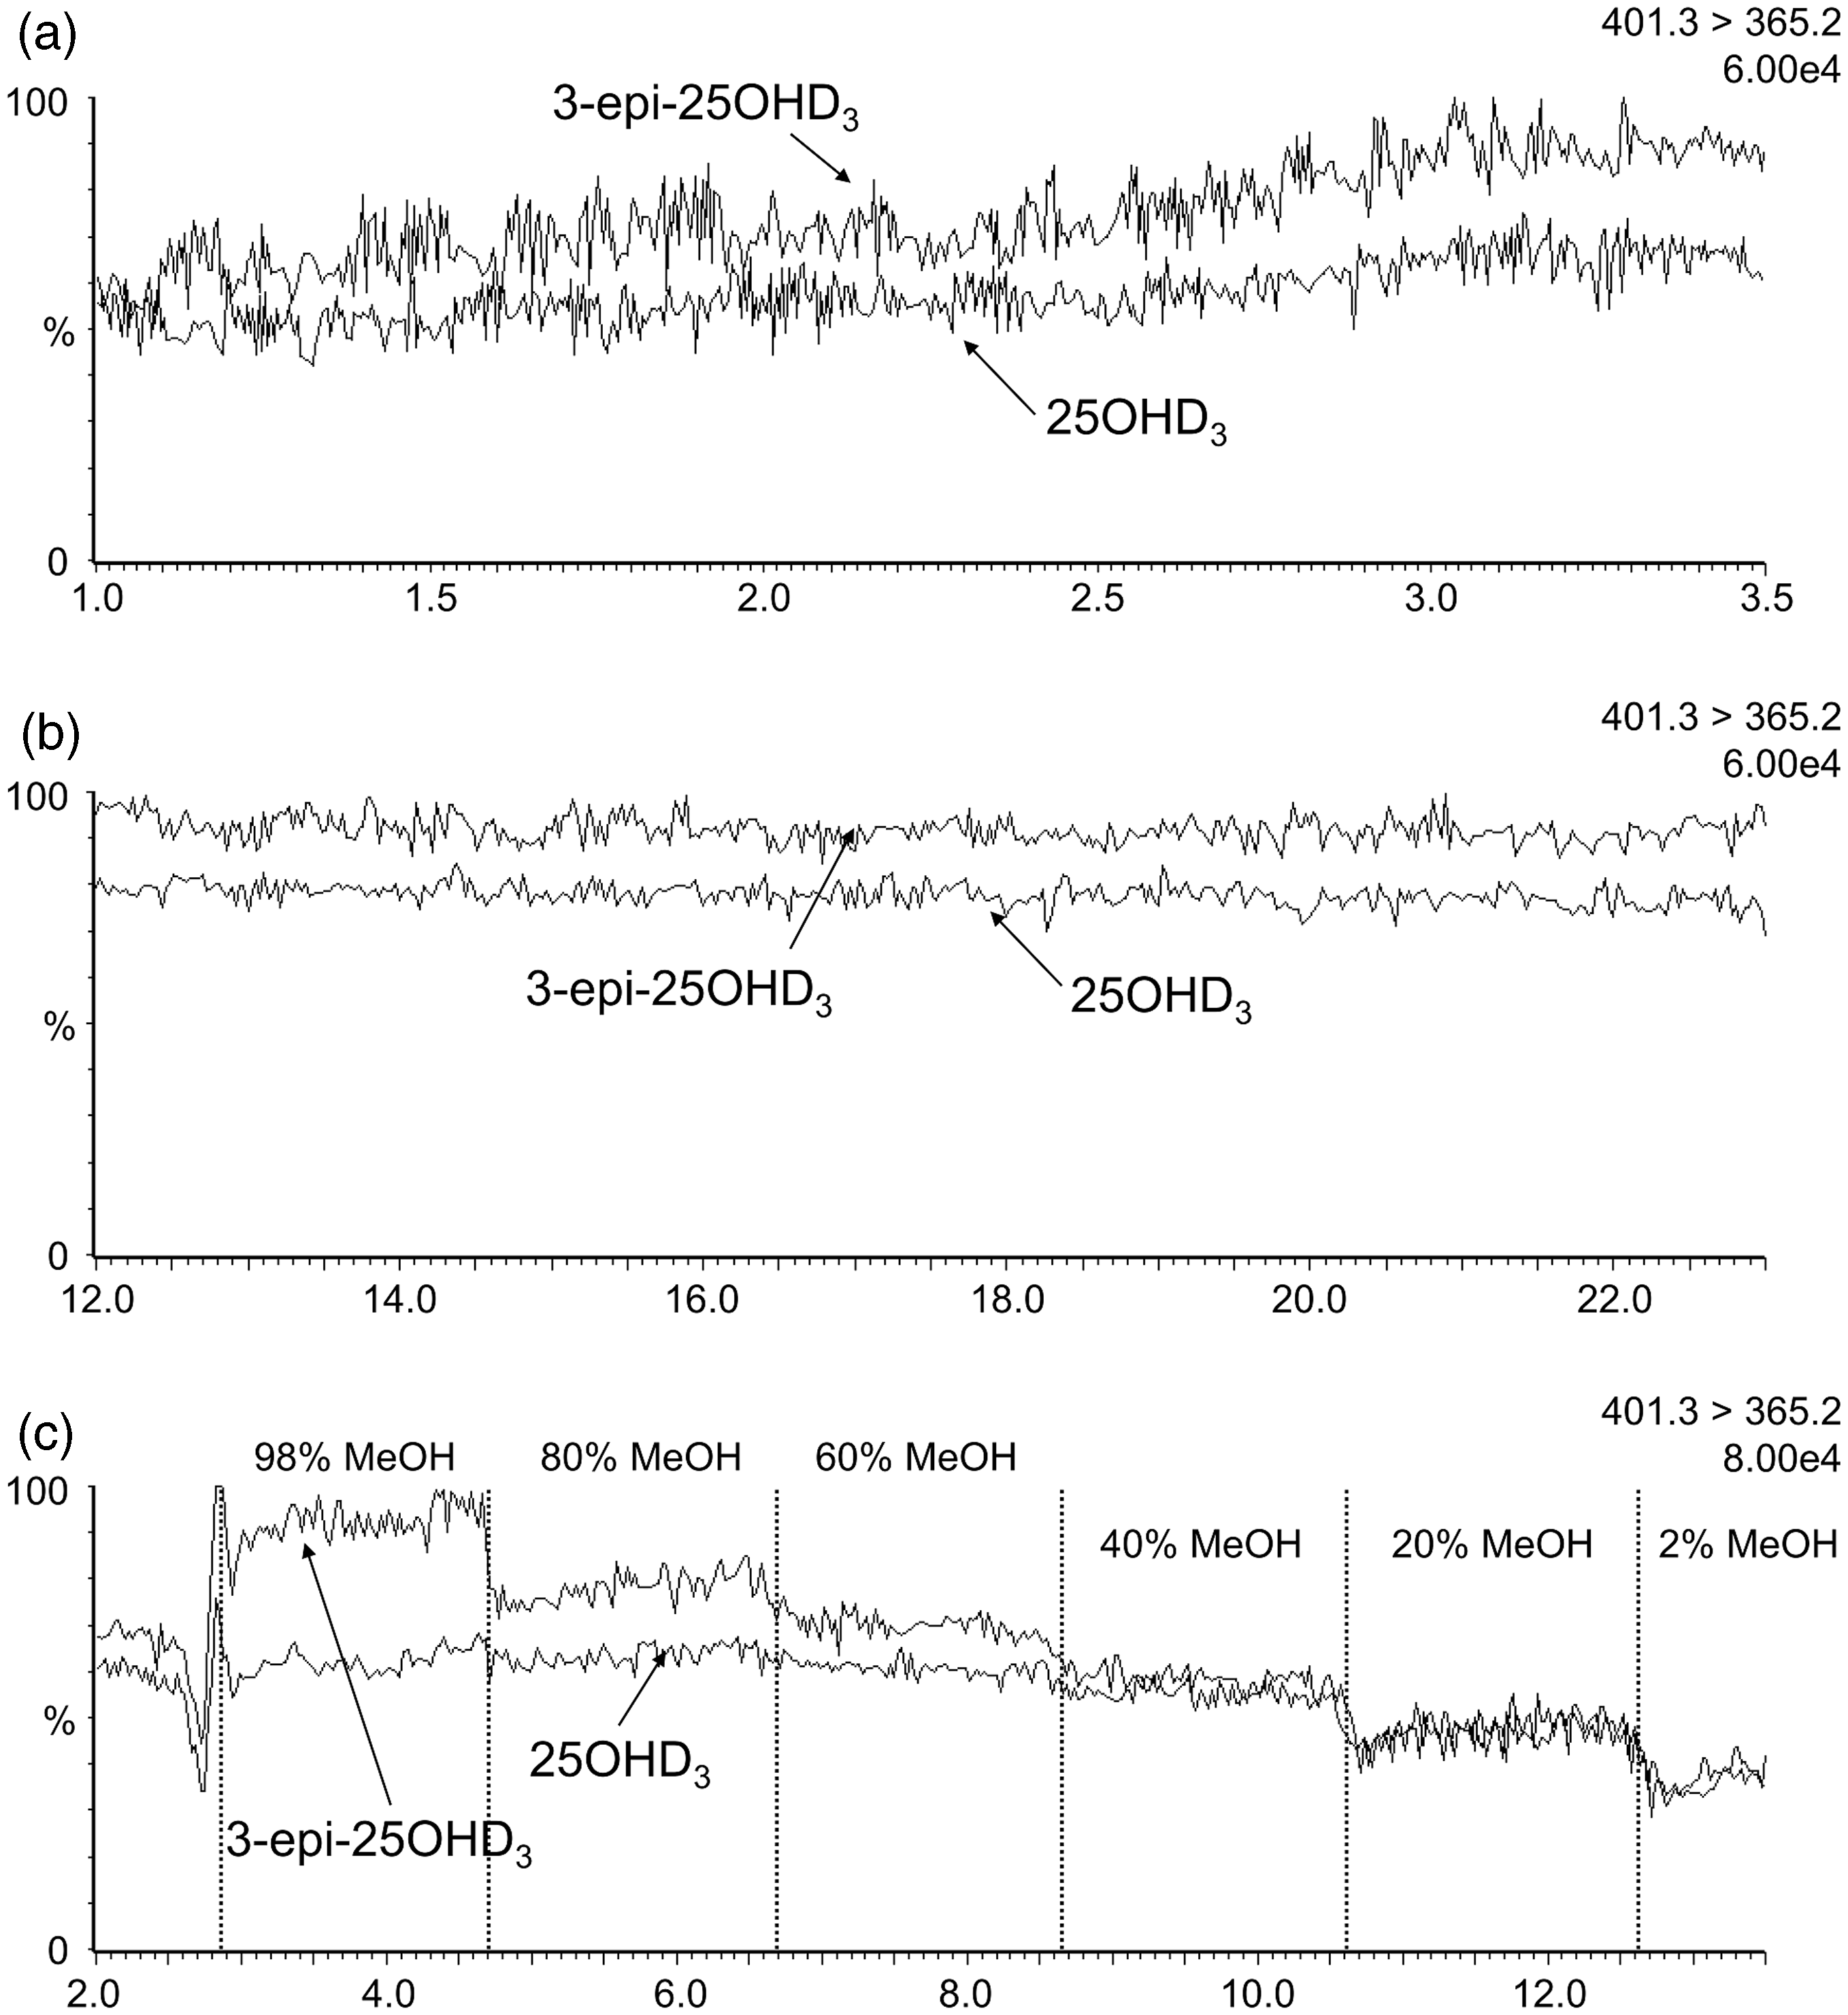
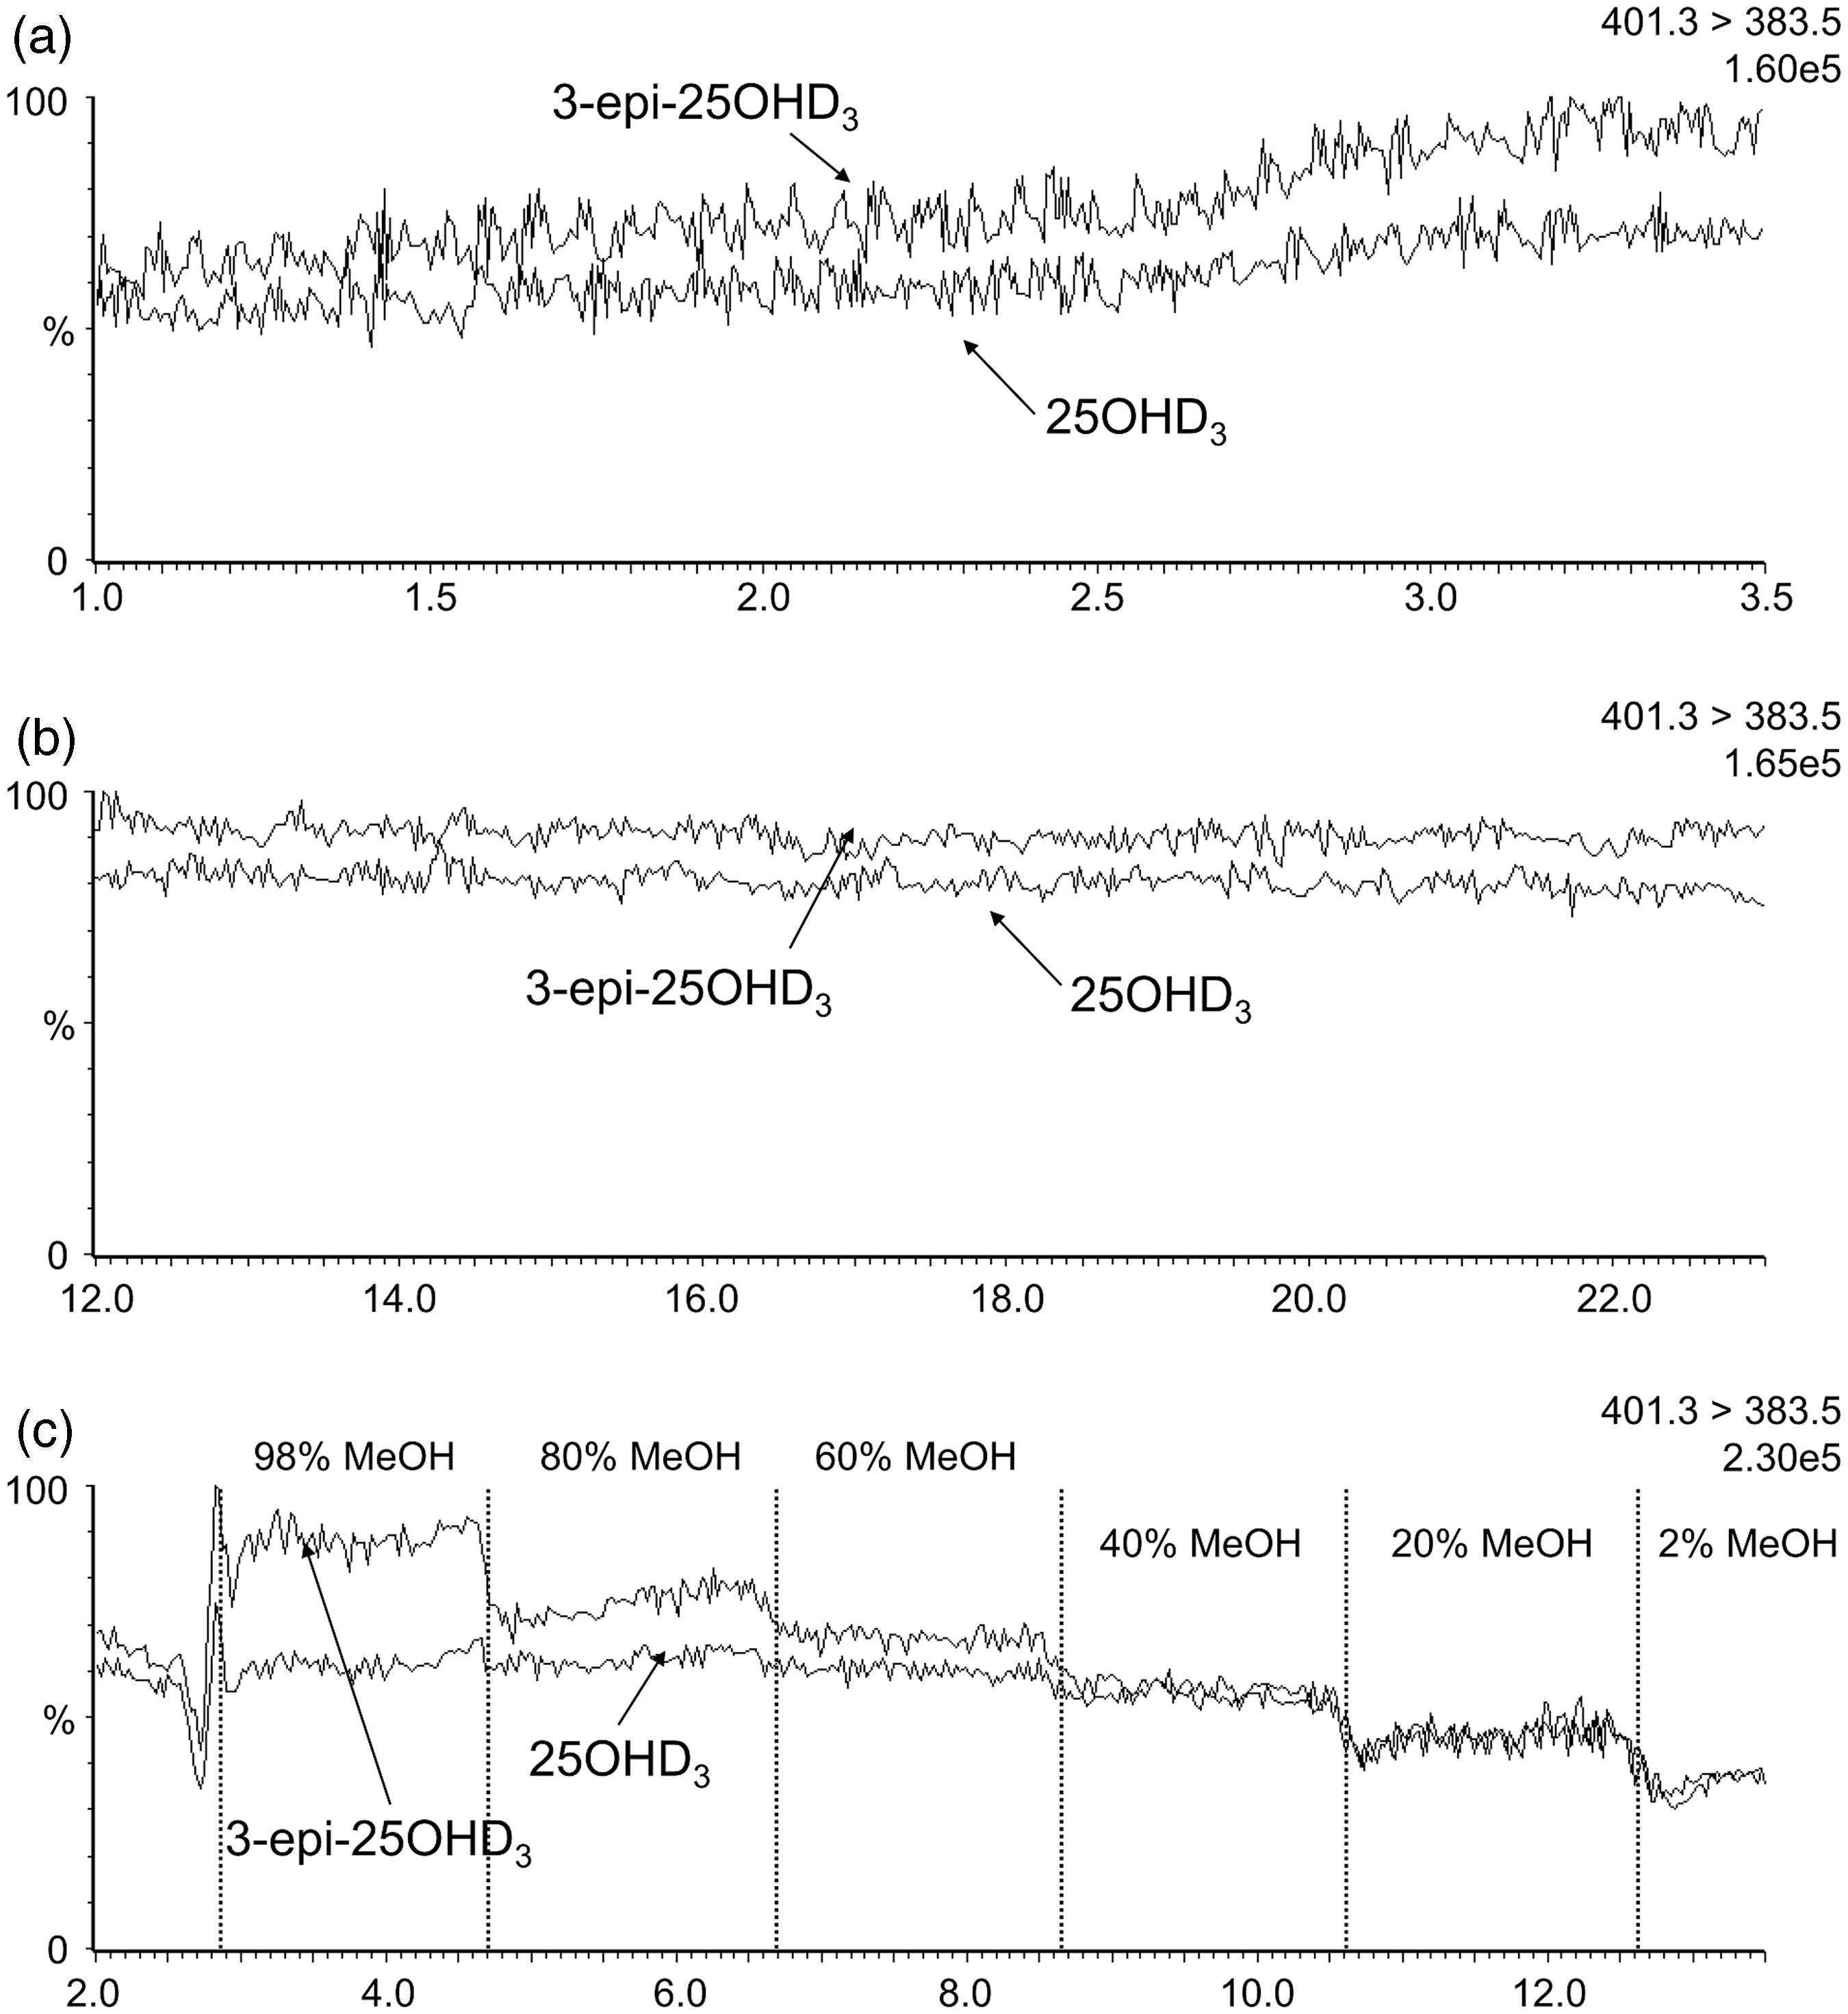
When infusing equimolar solutions into the MS, the 3-epi-25OHD3 signal was greater than 25OHD3 for the 401.3 > 159.1 transition (Figure 2). The epimer signal enhancement during analyte elution (∼2.7 min) in the co-elution method (Figure 2(a)) was double the signal enhancement seen in the isocratic resolving method (Figure 2(b)). This was verified on a second independently prepared set of infusion solutions. Increasing methanol concentrations increased the difference between epimer signals (Figure 2(c)). The same pattern was observed when infusions were monitored with either 401.3 > 365.2 (Figure 3) or 401.3 > 383.5 (Figure 4) transitions.
Chromatographs for the 401.3 > 159.1 transition during infusions of equal concentrations of 3-epi-25OHD3 and 25OHD3. (a) Infusion with the co-elution method chromatography conditions; (b) Infusion with the resolving method chromatography conditions; (c) Infusions where the mobile phase composition was changed in regular intervals. Signal intensity is given as a percentage of the ion count shown in the top right of each panel. Chromatographs for the 401.3 > 365.2 transition during infusions of equal concentrations of 3-epi-25OHD3 and 25OHD3. (a) Infusion with the co-elution method chromatography conditions; (b) Infusion with the resolving method chromatography conditions; (c) Infusion where the mobile phase composition was changed in regular intervals. Signal intensity is given as a percentage of the ion count shown in the top right of each panel. Chromatographs for the 401.3 > 383.5 transition during infusions of equal concentrations of 3-epi-25OHD3 and 25OHD3. (a) Infusion with the co-elution method chromatography conditions; (b) Infusion with the resolving method chromatography conditions; (c) Infusion where the mobile phase composition was changed in regular intervals. Signal intensity is given as a percentage of the ion count shown in the top right of each panel.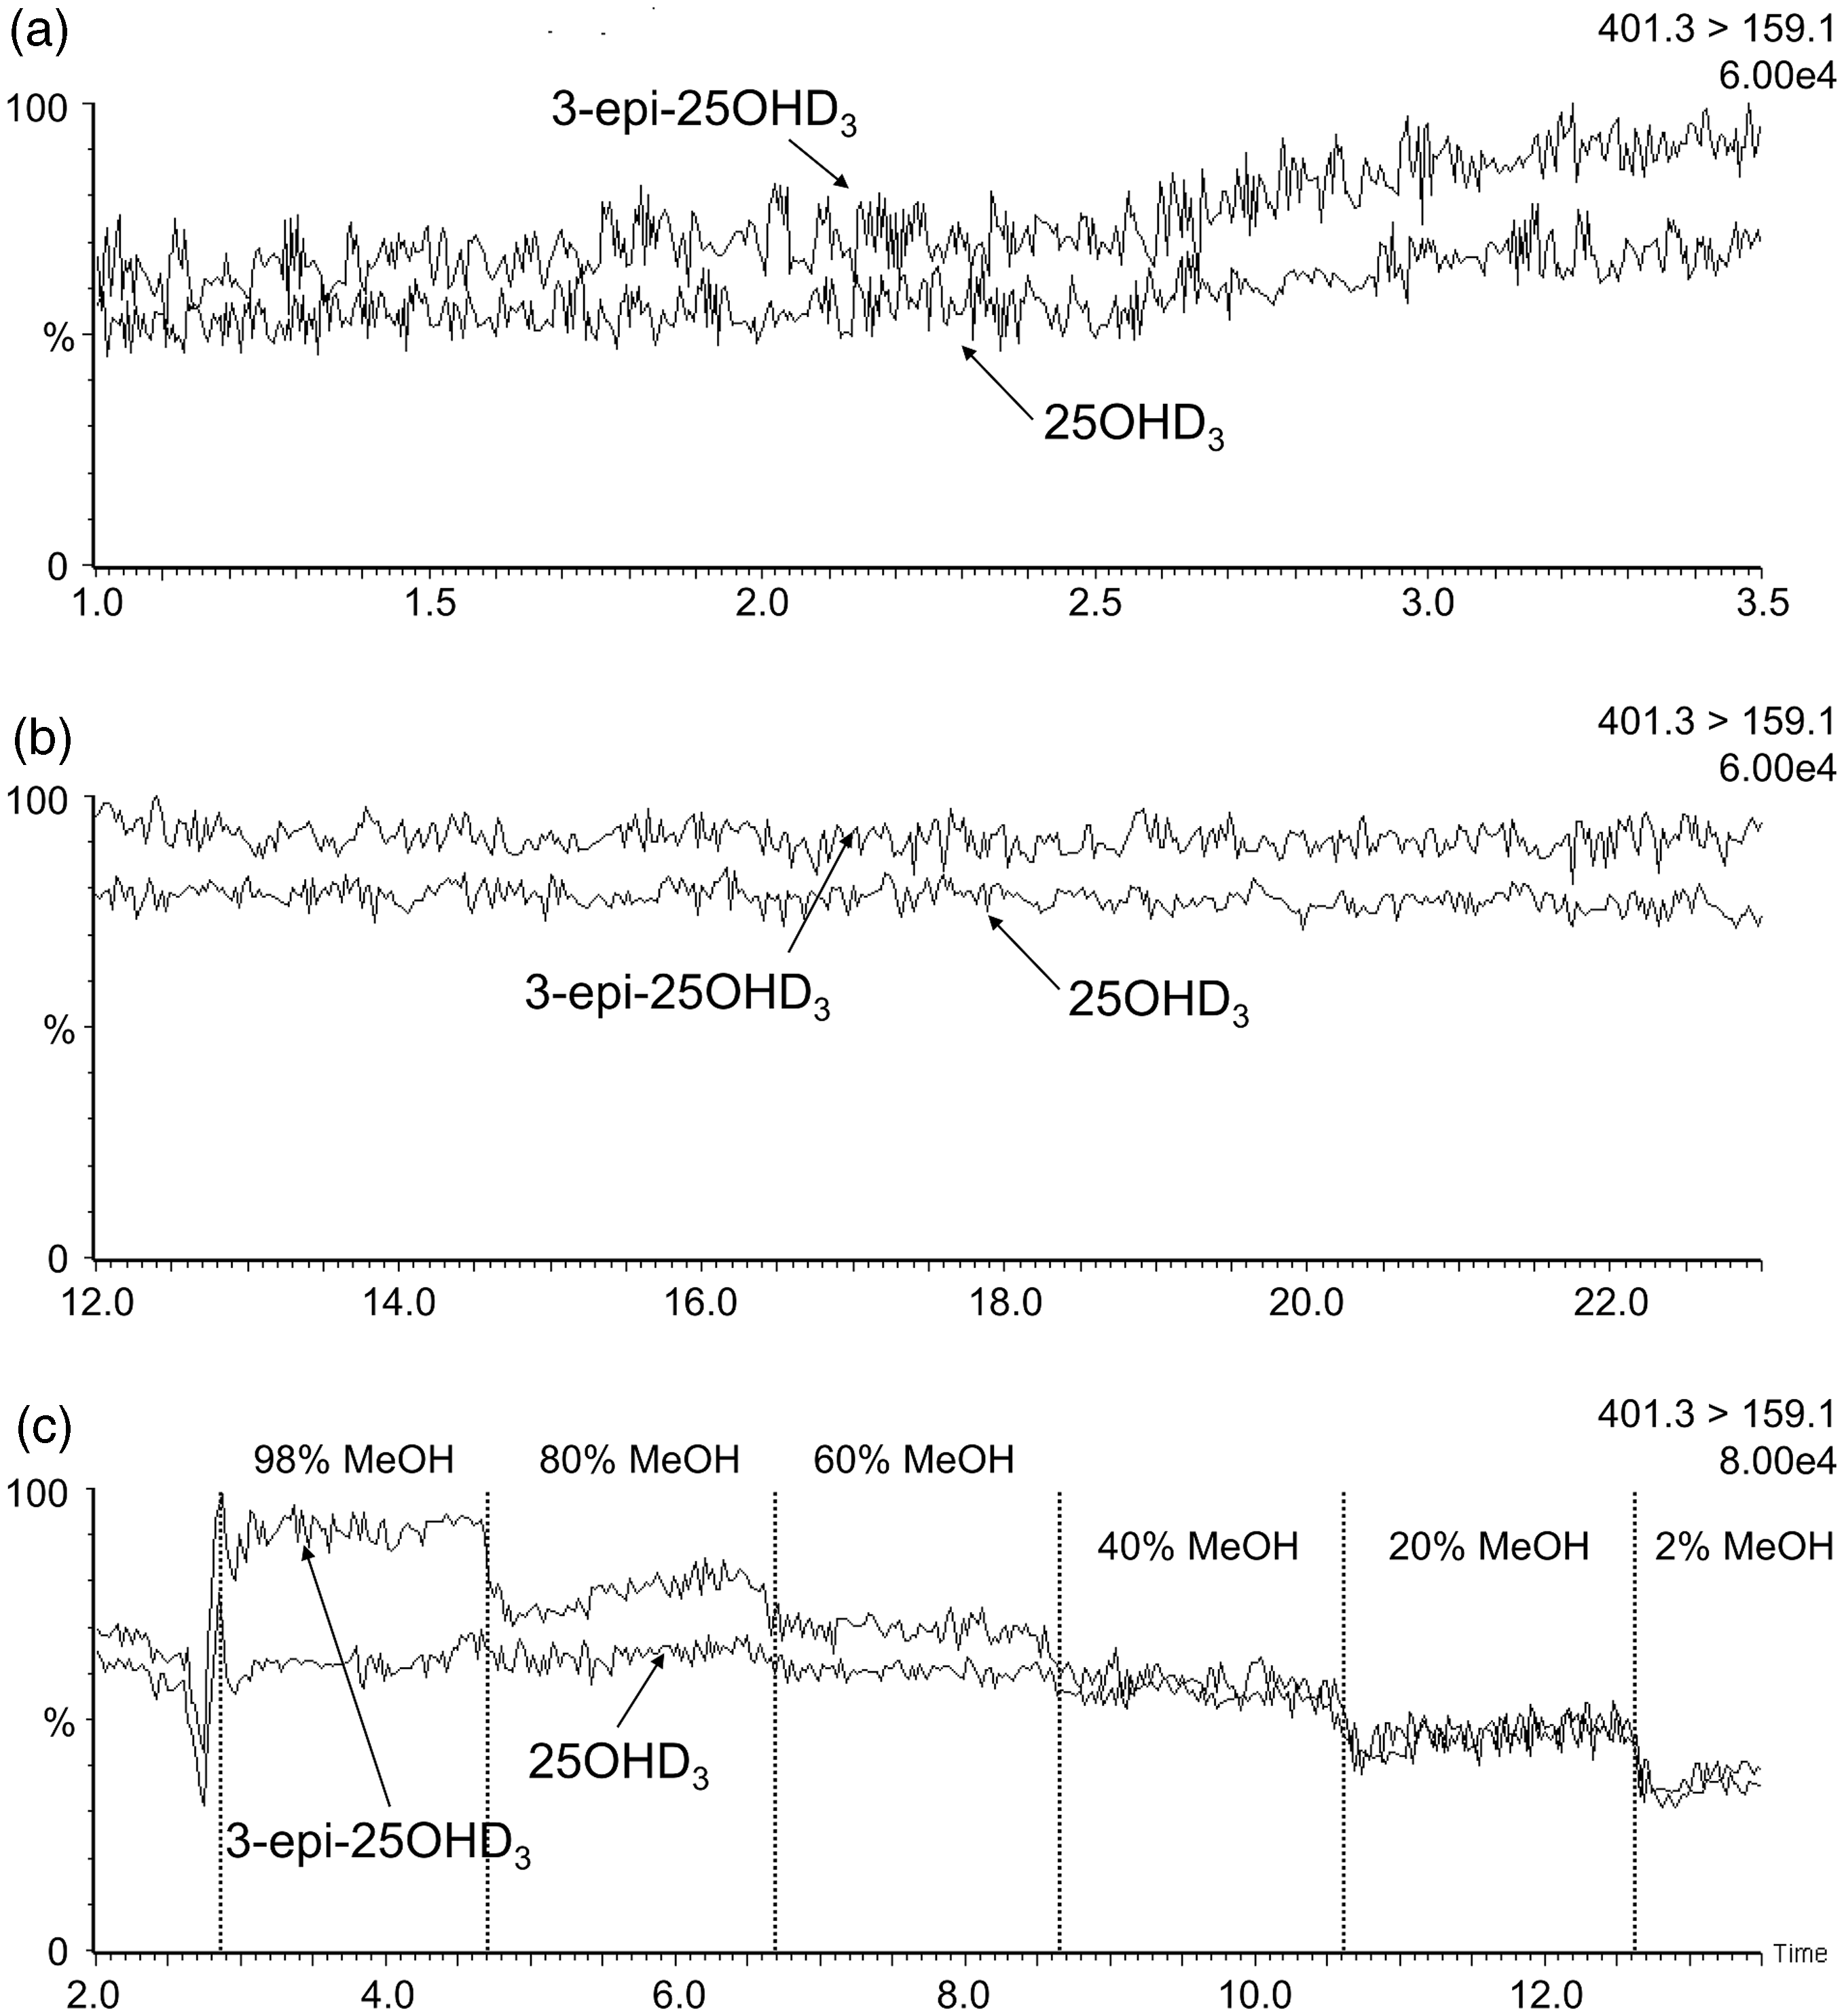
3-epi-25OHD3 measurement in 341 samples using three different modes of quantitation.
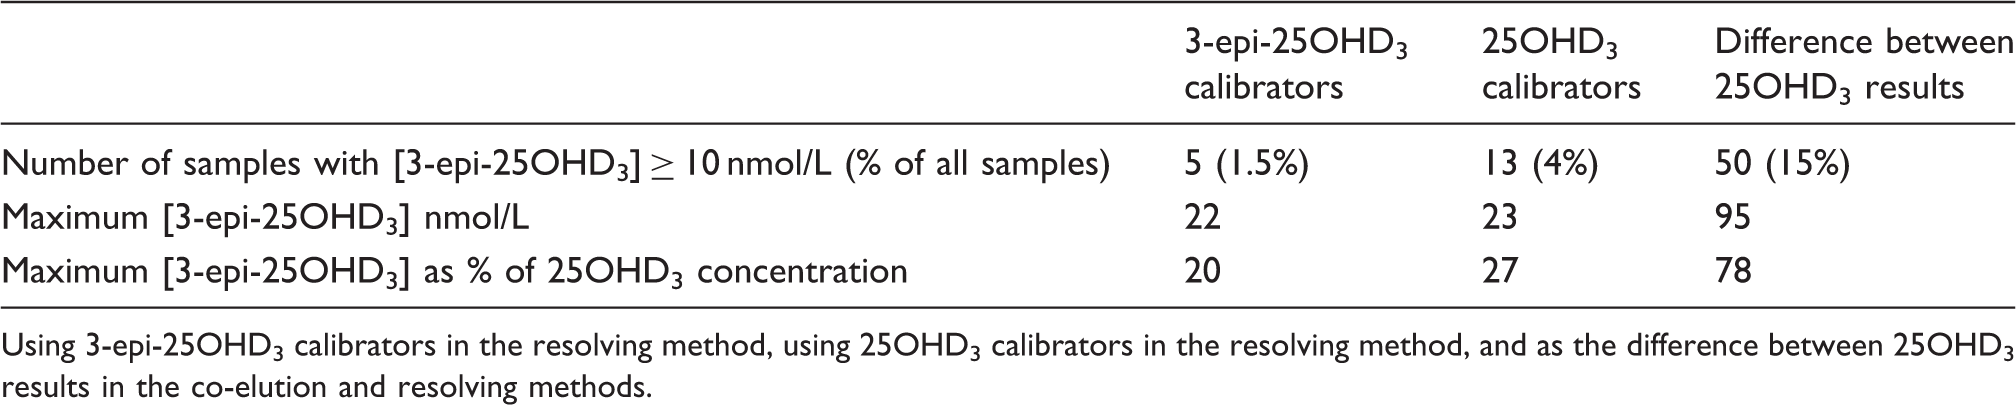
Using 3-epi-25OHD3 calibrators in the resolving method, using 25OHD3 calibrators in the resolving method, and as the difference between 25OHD3 results in the co-elution and resolving methods.
Discussion
We demonstrated enhanced 3-epi-25OHD3 signal relative to equimolar 25OHD3 during infusions and in spiked human serum. Enhanced signal caused overestimation of 3-epi-25OHD3 concentrations when quantified using 25OHD3 calibrators or as the difference in 25OHD3 results between an assay that chromatographically separates the epimers and a method in which they co-elute.
It is unclear if enhanced 3-epi-25OHD3 signal occurs in all LC-MS/MS systems. In a Vitamin D external quality assessment scheme (DEQAS), 3-epi-25OHD3 interference studies (sample 405) showed an average cross-reactivity > 100% in LC-MS/MS methods. 6 The wide spread of LC-MS/MS results for this sample (%CV 23.5% vs. %CV 10.8% in the base sample) suggest variable 3-epi-25OHD3 interference, possibly due to variable enhancement of 3-epi-25OHD3 signal. Our analyte infusion studies showed signal enhancement for the 401.3 > 159.1, 401.3 > 365.2 and 401.3 > 383.5 transitions used by most LC-MS/MS 25OHD assays, 7 suggesting that many LC-MS/MS systems might be affected by 3-epi-25OHD3 signal enhancement.
In both infusion and spiking experiments, the 3-epi-25OHD3 signal enhancement was two to threefold greater in the co-elution than in the resolving method. Infusion experiments showed increasing signal enhancement at higher methanol concentrations; since 3-epi-25OHD3 elutes at approximately 55% methanol in the resolving method and approximately 80% in the co-elution method, this may explain the greater signal enhancement in the latter. This dependence of signal enhancement on mobile phase composition may also contribute to the variable 3-epi-25OHD3 interference between DEQAS participants in the interference studies noted above.
As the molar extinction coefficient for 3-epi-25OHD3 is unknown, we used the same value as for 25OHD3 to assign concentration, an approach used by others. 2 The inversion of stereochemistry at C3 is chemically distant from the triene chromophore, but differences in UV absorption cannot be excluded. However, we would not expect the difference in UV absorption to exceed the < 10% difference between 25OHD3 (ɛ0 = 18,200 L mol−1 cm−1) and 25OHD2 (ɛ0 = 19,400 L mol−1 cm−1) absorbance. Any difference in 3-epi-25OHD3 and 25OHD3 concentrations due to inaccurate assignments of molar extinction coefficients cannot explain the different magnitudes of signal enhancement between the two methods, the variation of signal enhancement with methanol concentrations or the over-recovery of 3-epi-25OHD3 by LC-MS/MS users in a DEQAS 3-epi-25OHD3 interference experiment. 6
Signal enhancement could occur due to extraction, ionization or fragmentation differences. As 3-epi-25OHD3 enhancement was observed during infusion experiments, extraction differences alone cannot be responsible. Since 3-epi-25OHD3 and 25OHD3 fragment similarly 8 and enhancement was observed for 401.3 > 159.1, 401.3 > 365.2 and 401.3 > 383.5 transitions during infusion experiments, signal enhancement is likely due to greater 3-epi-25OHD3 ionization.
Ion suppressing substances could cause ionization differences in the resolving method if co-eluting with either analyte. However, no ion suppression was observed when analytes were co-infused with extracted serum during validation of the resolving method (data not shown), and infusion experiments show a consistently greater signal for 3-epi-25OHD3. Ion suppression is an unsatisfactory explanation in the co-elution method, where analytes would be subjected to similar ion suppression. We suggest that intrinsic differences between 3-epi-25OHD3 and 25OHD3 ionization exist, modulated by factors such as mobile phase composition.
In some cases, quantitation of 3-epi-25OHD3 as the difference between 25OHD3 concentrations in the co-elution and resolving methods caused concentrations to increase four to fivefold compared with using dedicated calibrators. This cannot be explained solely by 3-epi-25OHD3 signal enhancement and could be due to other unidentified 25OHD3 isobars.
Studies using dedicated 3-epi-25OHD3 calibrators reported low concentrations of this analyte, forming a minor fraction of total 25OHD3,2,3 whereas studies using indirect quantitation have reported higher results, with 3-epi-25OHD3 in excess of 25OHD3 in some individuals.1,4 Our results suggest that previously unrecognized differences in epimer ionization contribute to these discrepancies.
Accurate 3-epi-25OHD3 measurement could also be affected by the lack of an isotope labeled 3-epi-25OHD3 internal standard, which was unavailable during this study. In the resolving method, we used d6-25OHD3 as internal standard for 3-epi-25OHD3 and ensured that chromatography was sufficient to resolve ion suppressing substances.
The resolving method was developed to investigate 3-epi-25OHD3 interference in 25OHD analysis. The limit of detection of the method is higher than has been reported for other 3-epi-25OHD3 assays.2,3 However, our intention was not to develop a reference method for 3-epi-25OHD3 but rather to demonstrate the effect that different quantitation models can have on 3-epi-25OHD3 quantitation. Similarly, the resolving method’s extended runtime precludes routine use. However, 3-epi-25OHD3 can be partially separated within 6.5 min. 9 We advise that LC-MS/MS users quantitatively assess 3-epi-25OHD3 interference in their 25OHD assays and consider modifications to minimize interference. We also advise using 3-epi-25OHD3 calibrators if direct quantitation of this isomer is required.
Non-stoichiometric cross-reactivity is a familiar concept in immunoassays; we highlight that equimolar responses cannot be assumed in LC-MS/MS systems, even if two molecules are structurally similar. Furthermore, as cross-reactivity can differ between immunoassays due to differing antibody specificity and/or assay configuration, variable ionization is a possible mechanism for differing degrees of interference between LC-MS/MS assays.
Footnotes
Acknowledgements
None
Declaration of conflicting interests
None declared
Funding
This research received no specific grant from any funding agency in the public, commercial, or not-for-profit sectors.
Ethical approval
Not required
Guarantor
AD
Contributorship
All authors contributed to study design. NF and FL performed experiments. NF analysed data and wrote the first draft of the manuscript. All authors reviewed and edited the manuscript and approved the final version.