
Abstract
Background
Serum cytokeratin-18 is believed to be a marker of hepatic cell damage. However, few studies have discussed about the serum cytokeratin-18 concentration in type 2 diabetes mellitus patients and investigated its association with non-alcoholic fatty liver disease as well as metabolic biomarkers.
Methods
Healthy participants and type 2 diabetes mellitus patients were enrolled. Physical and metabolic factors were recorded, and non-alcoholic fatty liver disease was screened by abdominal ultrasound and the fatty liver index. The cytokeratin-18 concentration was detected using two commercially available immunoassay kits (M30 and M65 ELISA kit, Previa AB, Sweden).
Results
Overall, 22.8% (29/127) and 35.9% (42/117) of the participants were diagnosed with non-alcoholic fatty liver disease in the non-diabetes mellitus group and type 2 diabetes mellitus group, respectively. In the non-diabetes mellitus group and type 2 diabetes mellitus group, our result showed that participants with non-alcoholic fatty liver disease had a higher serum cytokeratin-18 M30 and cytokeratin-18 M65 concentration as compared with participants without non-alcoholic fatty liver disease. Interestingly, as compared with healthy participants without non-alcoholic fatty liver disease, our result also demonstrated that type 2 diabetes mellitus patients without non-alcoholic fatty liver disease had a higher serum cytokeratin-18 M30 (108.4 ± 66.2 vs. 87.1 ± 34.6 U/L; P = 0.038) and cytokeratin-18 M65 concentration (285.4 ± 115.3 vs. 248.5 ± 111.3 U/L; P = 0.031). The independent relationship between type 2 diabetes mellitus and cytokeratin-18 was further strengthened by the significant positive association between fasting plasma glucose and serum cytokeratin-18 concentration via multivariate regression analyses (cytokeratin-18 M30: β = 0.034, P = 0.029; cytokeratin-18 M65: β = 0.044, P = 0.002).
Conclusions
Independent of non-alcoholic fatty liver disease, our results suggested that the cytokeratin-18 concentration is closely associated with the hyperglycaemic milieu. The association between serum cytokeratin-18 and type 2 diabetes mellitus may be worthy of further investigation.
Introduction
Non-alcoholic fatty liver disease (NAFLD), characterized by more than 5% of hepatocytes exhibiting fatty deposition under a microscope, has become a noteworthy chronic disease. In parallel with the worldwide increase in obesity, the global prevalence of NAFLD has reached approximately 25%. 1 Moreover, a recent epidemiology study reported that NAFLD is not only the most rapidly growing indication of but could also be the leading cause of liver transplantation in the US in upcoming decades. 2 Thus, health providers should treat NAFLD very seriously.
While screening for asymptomatic patients with NAFLD is not currently recommended by medical professionals, 3 NAFLD could be a more harmful health problem in patients with type 2 diabetes mellitus (T2DM), owing to the prevalence of NAFLD being as high as 60% in T2DM patients. 4 As NAFLD is accompanied by insulin resistance, a higher proportion of T2DM patients with NAFLD have poor glycaemic control and require more complicated treatment with antihyperglycaemic agents. 5 Additionally, studies have suggested that T2DM with NAFLD carries higher risks of cardiovascular disease, chronic kidney disease and all-cause mortality.5–7 Accordingly, it is essential that a surveillance strategy for NAFLD is included in diabetes care programmes.
Unfortunately, diagnosis of NAFLD represents a clinical challenge in general practice, as most patients are asymptomatic. Although liver biopsy is the golden standard for NAFLD assessment, and magnetic resonance imaging is also able to determine the presence of hepatic fat with a near 100% accuracy, 8 neither are feasible in GP clinics, and both have limited availability for routine surveillance. Ultrasound is more practical for the screening of NAFLD, but the sensitivity is poor when steatosis is mild 9 ; the sensitivity is also poor in patients with morbid obesity. 10 Disturbingly, there exists substantial inconsistency in determining the severity of NAFLD among examiners.9,11 In the context of poor sensitivities and specificities of elevated liver enzymes for the diagnosis of NAFLD,12,13 an alternative non-invasive objective biomarker should be considered.
Cytokeratin-18 (CK-18) is a caspase-cleaved fragment released by injured hepatocytes, and the serum concentration of CK-18 is believed to be a marker of hepatic cell damage. Studies have investigated the role of CK-18 in NAFLD patients; however, few studies have examined the serum CK-18 concentration in patients with T2DM.14,15 Furthermore, in examining the extensive application of CK-18 for the study of NAFLD, it is not clear whether the CK-18 concentration is naturally affected by hyperglycaemia milieu. Moreover, it is important to establish the diagnostic value of CK-18 for the identification of NAFLD in T2DM patients in clinical practice. Accordingly, the aim of this study was to explore the applicability of CK-18 in assessing NAFLD in T2DM patients.
Subjects and methods
Subjects
From April to October 2017, T2DM patients consecutively managed in a comprehensive diabetes programme and healthy subjects who participated in the Health Checkup program were enrolled in this study. Both of these programmes are covered by the National Health Insurance of Taiwan, and the contents of these programmes were detailed in our previous article 16 and briefly here. Residents aged between 40 and 65 could have a health checkup every three years and then yearly for those aged over 65. In the Health Checkups programme and the comprehensive diabetes programme, in addition to the basic physical profile, the patients’ fasting plasma glucose, total cholesterol, low-density lipoprotein cholesterol (LDL-C), high-density lipoprotein cholesterol (HDL-C), triglycerides, aspartate aminotransferase (AST), alanine aminotransferase (ALT) and serum creatinine concentrations were assessed. The comprehensive diabetes programme additionally reimbursed A1C exam. Other necessary information for our study (e.g. abdominal ultrasound and parameters for fatty liver index [FLI] calculation) not covered by the programmes were examined after we had their inform consent. Non-diabetes participants were classified via their fasting plasma glucose <5.5 mmol/L (<100 mg/dL) and A1C< 39 mmol/moL (<5.7%) according to the standards of the American Diabetes Association. Participants who met the following conditions were excluded: (1) presence of a virus or autoimmune hepatitis, or biliary tract disease; (2) a daily alcohol consumption over 20 g, as estimated by registered dietitians via 24-h memory recall and a food frequency questionnaire; (3) chronic kidney disease, determined by an estimated glomerular filtration rate <60 ml/min/m2 or proteinuria; (4) New York Heart Association class II–IV congestive heart failure; (5) malignancy and (6) concomitant herbal medication, amiodarone or steroids. This study was approved by the Antai Medical Care Cooperation, Antai Tian-Sheng Memorial Hospital Institutional Review Board, and informed consent was obtained from all study participants.
Measurements
Blood samples were collected after at least 8 h of overnight fasting. In addition to recording basic anthropometric measurements (i.e. body weight and height, waist circumference [WC] and blood pressure), the concentrations of fasting blood glucose (FBG), HbA1c, total cholesterol, LDL-C, HDL-C, triglycerides and serum creatinine were assessed, and urine was examined at the time of enrollment. Liver enzymes such as AST, ALT and gamma-glutamyltransferase were also examined. Remaining plasma was frozen and kept at −80°C for CK-18 measurement. An automatic biochemical analyser (Beckman-Coulter Inc., Fullerton, CA) was used to analyse blood samples. HbA1c was measured in whole blood using an ion exchange high-performance liquid chromatography system (VARIANTTM II Turbo; Bio-Rad, Hercules, CA). The serum concentrations of total cholesterol, HDL-C, LDL-C and triglycerides were measured using standard enzymatic methods (Cholestest® N-HDL, Sekisui Medical Co., Ltd, Tokyo, Japan). Serum creatinine was measured using the Jaffe method.
The plasma concentration of CK-18 was determined using a commercially available immunoassay kit (M30 and M65 ELISA kit, Peviva AB, Sweden). The M30 ELISA kit measured the concentration of caspase-cleaved CK-18, reflecting the level of cell apoptosis, while the M65 ELISA kit measured the soluble CK-18 released from dying cells to assess overall cell death. The intra-assay and inter-assay variations of plasma CK-18 M30 measurements were 2.5% and 7.8%, respectively, while those of plasma CK-18 M65 measurements were 3.8% and 9.8%, respectively.
Clinical diagnosis of NAFLD
All patients underwent abdominal ultrasound (Logiq P5, GE Healthcare, Milwaukee, WI, USA) performed by an experienced physician who was blinded to the medical information of the study participants. NAFLD was defined as a diffuse increase of fine echoes in the liver parenchyma as compared with the kidney parenchyma. The FLI 17 was also calculated for NAFLD evaluation. In the present study, patients who met both the abdominal ultrasound and FLI > 60 criteria were categorized as having NAFLD.
Statistical analysis
Continuous values are presented as means ± SDs, and categorical factors are presented as numbers. Baseline characteristics were compared between groups using ANOVA and LSD for post hoc analysis. As triglycerides, CK-18 M30 and CK-18 M65 were not normally distributed, they were naturally log-transformed before being entered into statistical analyses. Chi-square tests were performed to compare categorical variables. Linear regression analyses were employed to identify metabolic factors significantly correlated with CK-18 M30 and CK-18 M65. To examine independent metabolic factors, variables with P-values < 0.1 in relation to CK-18 M30 and CK-18 M65 in univariate analyses were entered into a multivariate forward stepwise regression model. We use the variance inflation factor (VIF) to test for multicollinearity in the multivariate regression models. ROC and Yuden’s index were used to reveal the optimal values of CK-18 M30 and CK-18 M65 for the diagnosis of NAFLD. All statistical analyses were performed using SPSS for Windows 22.0 (SPSS Inc., Chicago, IL, USA). A P-value <0.05 was considered to indicate statistical significance.
Results
A total of 127 healthy controls and 117 T2DM patients were enrolled in the present study, forming the non-diabetes mellitus (DM) group and the T2DM group; 29 (22.8%) and 42 (35.9%) participants were diagnosed with NAFLD in the non-DM and T2DM participants, respectively. As compared with participants without NAFLD, patients with NAFLD had a higher diastolic pressure, body mass index (BMI), WC, ALT and triglycerides, regardless of DM status (Table 1). Additionally, in the T2DM group, the patients with NAFLD exhibited poorer systolic blood pressure, fasting blood glucose, A1C and HDL-C as compared with T2DM patients without NAFLD. Nonetheless, no significant differences in the prevalence of oral anti-hyperglycaemic medications and statins between the T2DM groups were noted (data not shown). With regard to CK-18 M30 and CK-18 M65, the results showed that both markers were higher in patients with NAFLD, either in the non-DM group or in the T2DM group. This result supported that CK-18 is a reliable marker for detecting hepatocyte injury in the study of NAFLD. However, in the participants without NALFD, our study results interestingly showed that CK-18 M30 and CK-18 M65 were also higher in the T2DM patients as compared with the normal healthy controls. The comparisons of CK-18 between groups remained consistent after adjusting potential confounders (i.e. age and gender) analysed by generalized linear model. This result implied that CK-18 could also be increased under hyperglycaemic milieu.
Clinical characteristics of the study participants.
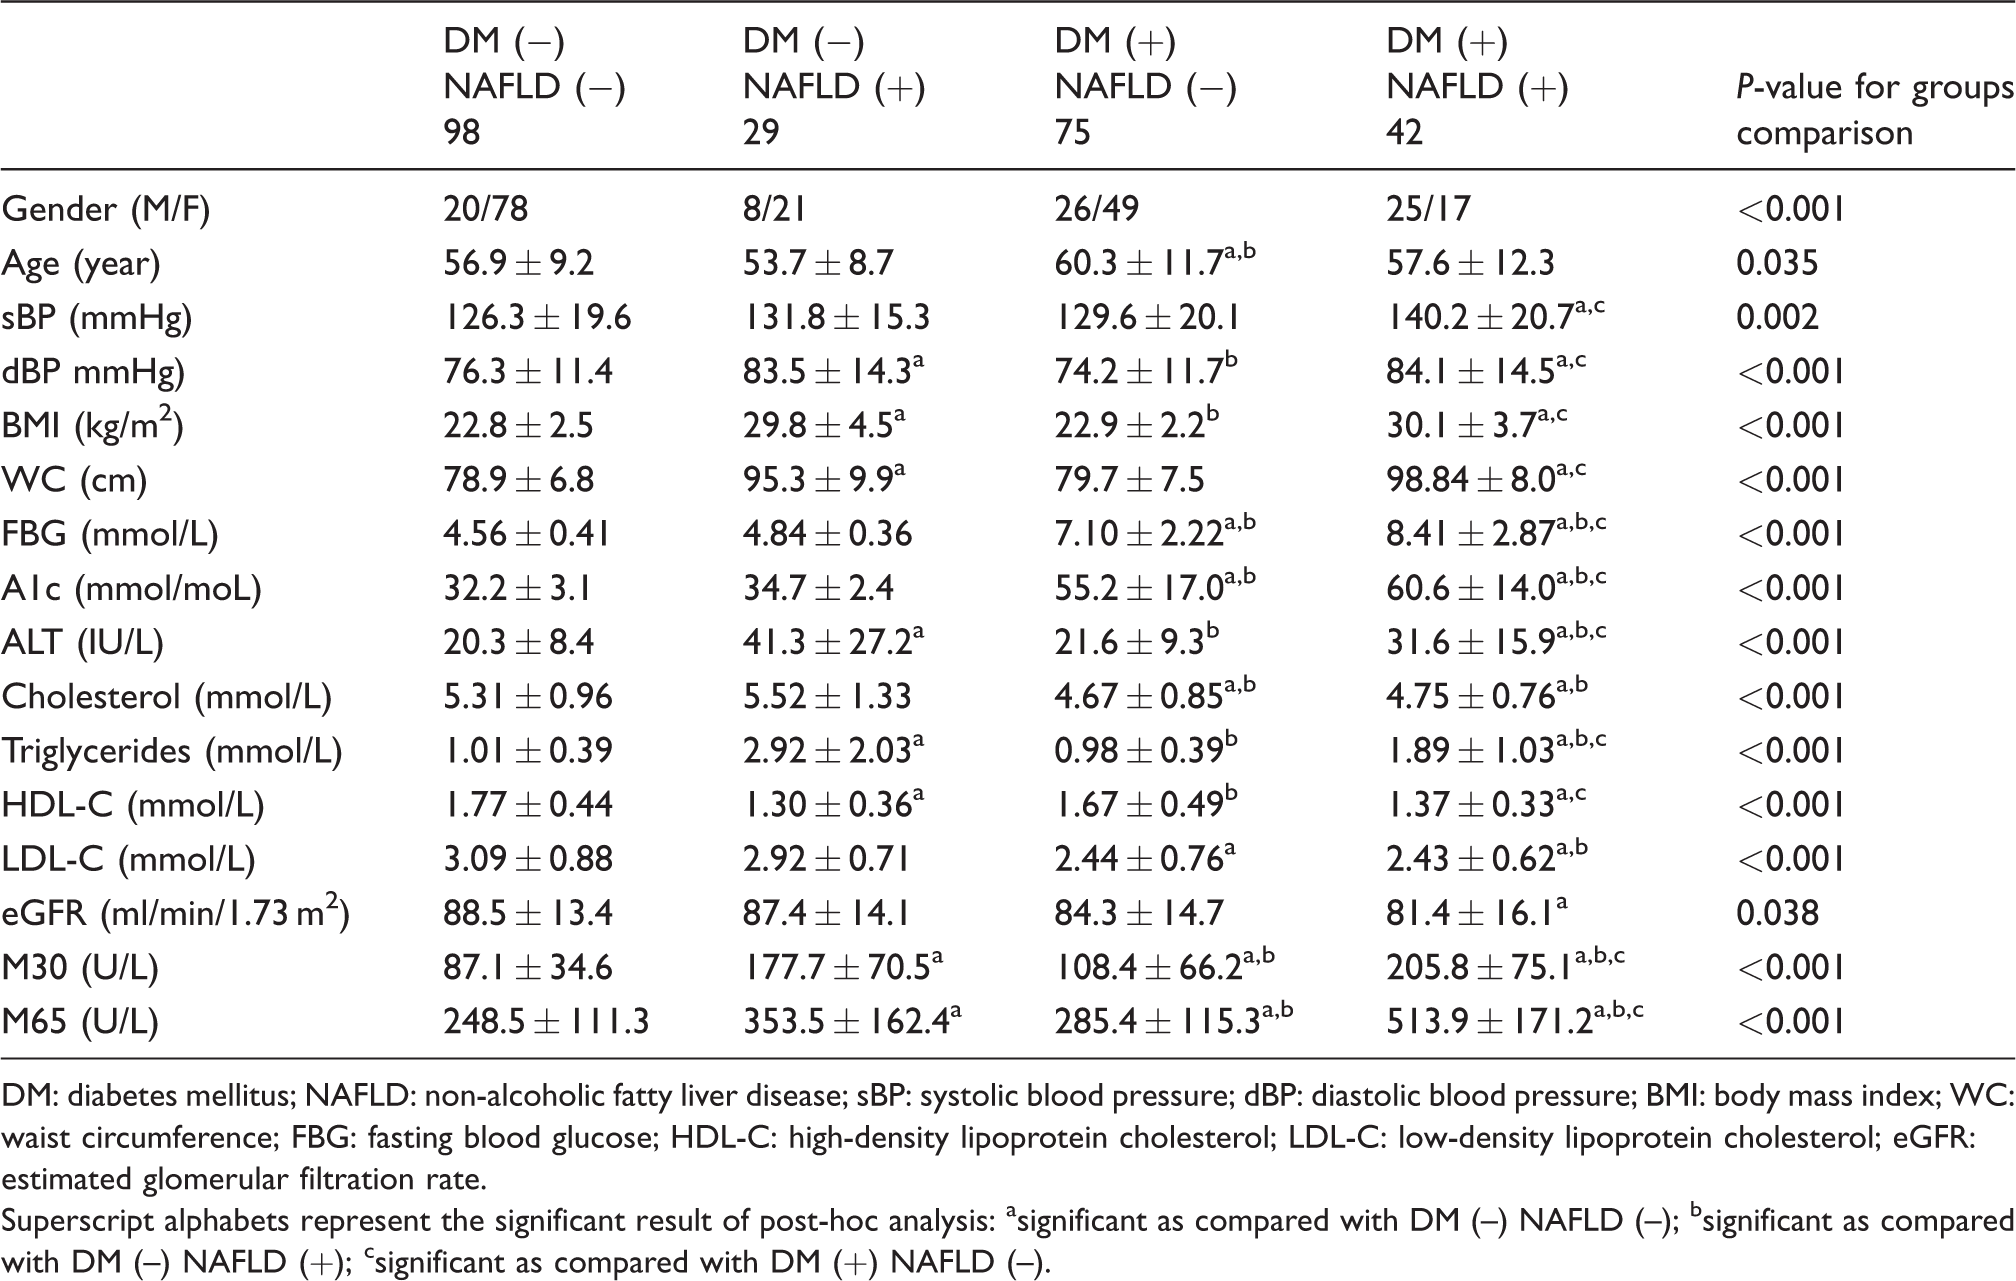
DM: diabetes mellitus; NAFLD: non-alcoholic fatty liver disease; sBP: systolic blood pressure; dBP: diastolic blood pressure; BMI: body mass index; WC: waist circumference; FBG: fasting blood glucose; HDL-C: high-density lipoprotein cholesterol; LDL-C: low-density lipoprotein cholesterol; eGFR: estimated glomerular filtration rate.
Superscript alphabets represent the significant result of post-hoc analysis: asignificant as compared with DM (–) NAFLD (–); bsignificant as compared with DM (–) NAFLD (+); csignificant as compared with DM (+) NAFLD (–).
In order to reveal factors significant to CK-18 M30 and CK-18 M65, linear regression analyses were performed (Table 2). In univariate regression analysis, we found that NAFLD, systolic blood pressure, BMI, WC, FBG, A1C, ALT and triglycerides were positively associated with CK-18 M30 and CK-18 M65; on the contrary, the female gender and HDL-C were negatively associated. The results of multivariate regression analyses showed that the presence of NAFLD and ALT remained as independent factors related to CK-18 M30 and CK-18 M65, while HDL-C was independently related to CK-18 M30 only. Notably, our results revealed that FBG was independently and significantly associated with CK-18 M30 and CK-18 M65, and suggested that CK-18 was amplified in association with increased blood glucose. All significant factors had a VIF value < 1.5 in the multivariate regression analyses.
Linear regression analysis of factors correlated with M30 and M65.
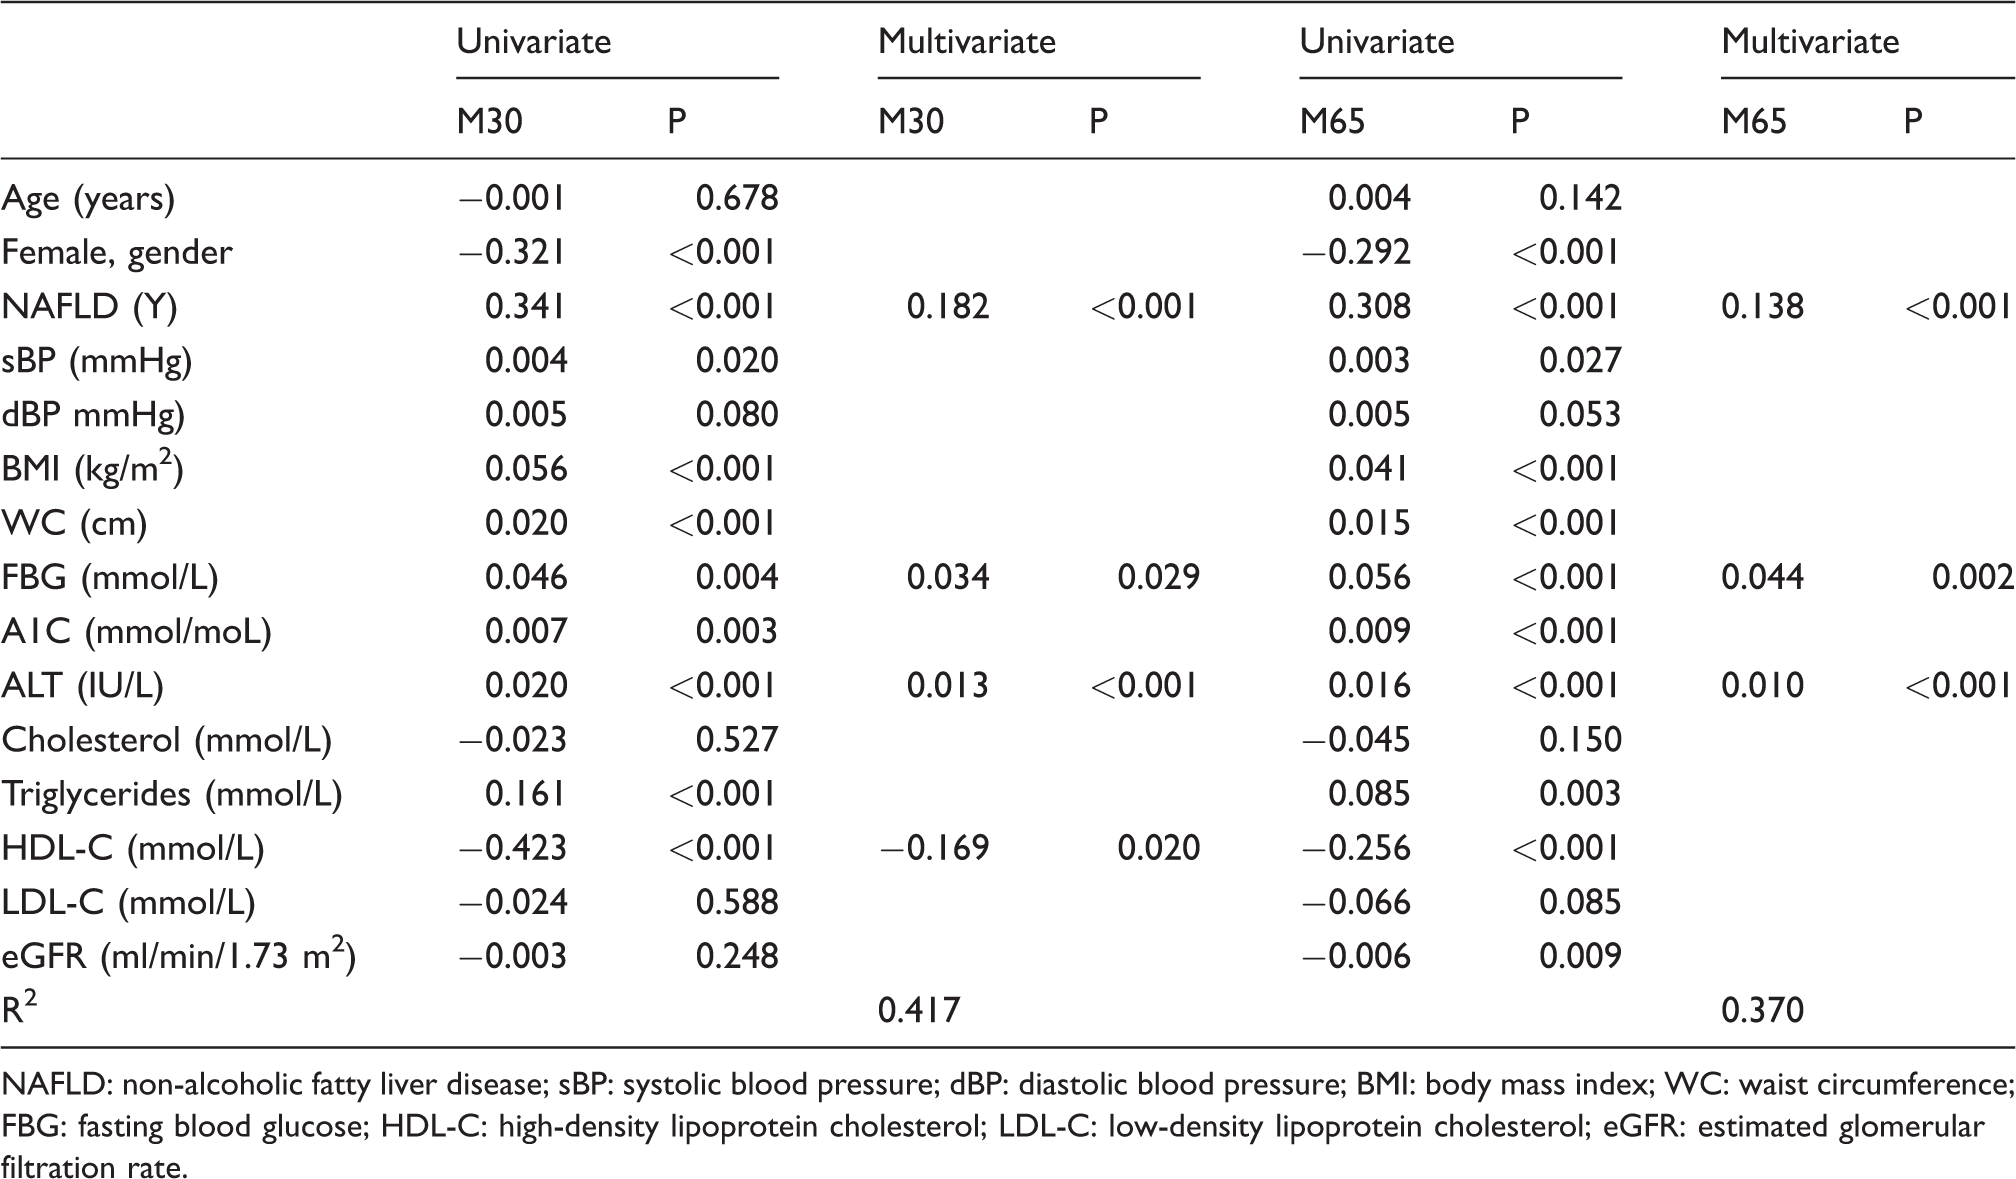
NAFLD: non-alcoholic fatty liver disease; sBP: systolic blood pressure; dBP: diastolic blood pressure; BMI: body mass index; WC: waist circumference; FBG: fasting blood glucose; HDL-C: high-density lipoprotein cholesterol; LDL-C: low-density lipoprotein cholesterol; eGFR: estimated glomerular filtration rate.
To determine the optimal cut-off values for the diagnosis of NAFLD in the non-DM and T2DM groups, ROC and Youden’s index were used. In the non-DM group (Figure 1(a)), the area under the curve (AUC) of CK-18 M30, CK-18 M65 and ALT was 0.917, 0.707 and 0.834, respectively. The potential cut-off value for CK-18 M30, CK-18 M65 and ALT for the detection of NAFLD was 126 U/L (sensitivity 82.8%, specificity 88.8%), 210 U/L (sensitivity 82.8%, specificity 52.0%) and 23 IU/L (sensitivity 82.8%, specificity 76.5%), respectively. In the T2DM group (Figure 1(b)), the AUC of CK-18 M30, CK-18 M65 and ALT was 0.757, 0.789 and 0.714, respectively. The potential cut-off value of CK-18 M30, CK-18 M65 and ALT for the detection of NAFLD was 136 U/L (sensitivity 64.3%, specificity 81.3%), 391 U/L (sensitivity 61.9%, specificity 84.0%) and 27 IU/L (sensitivity 57.1%, specificity 81.3%), respectively.
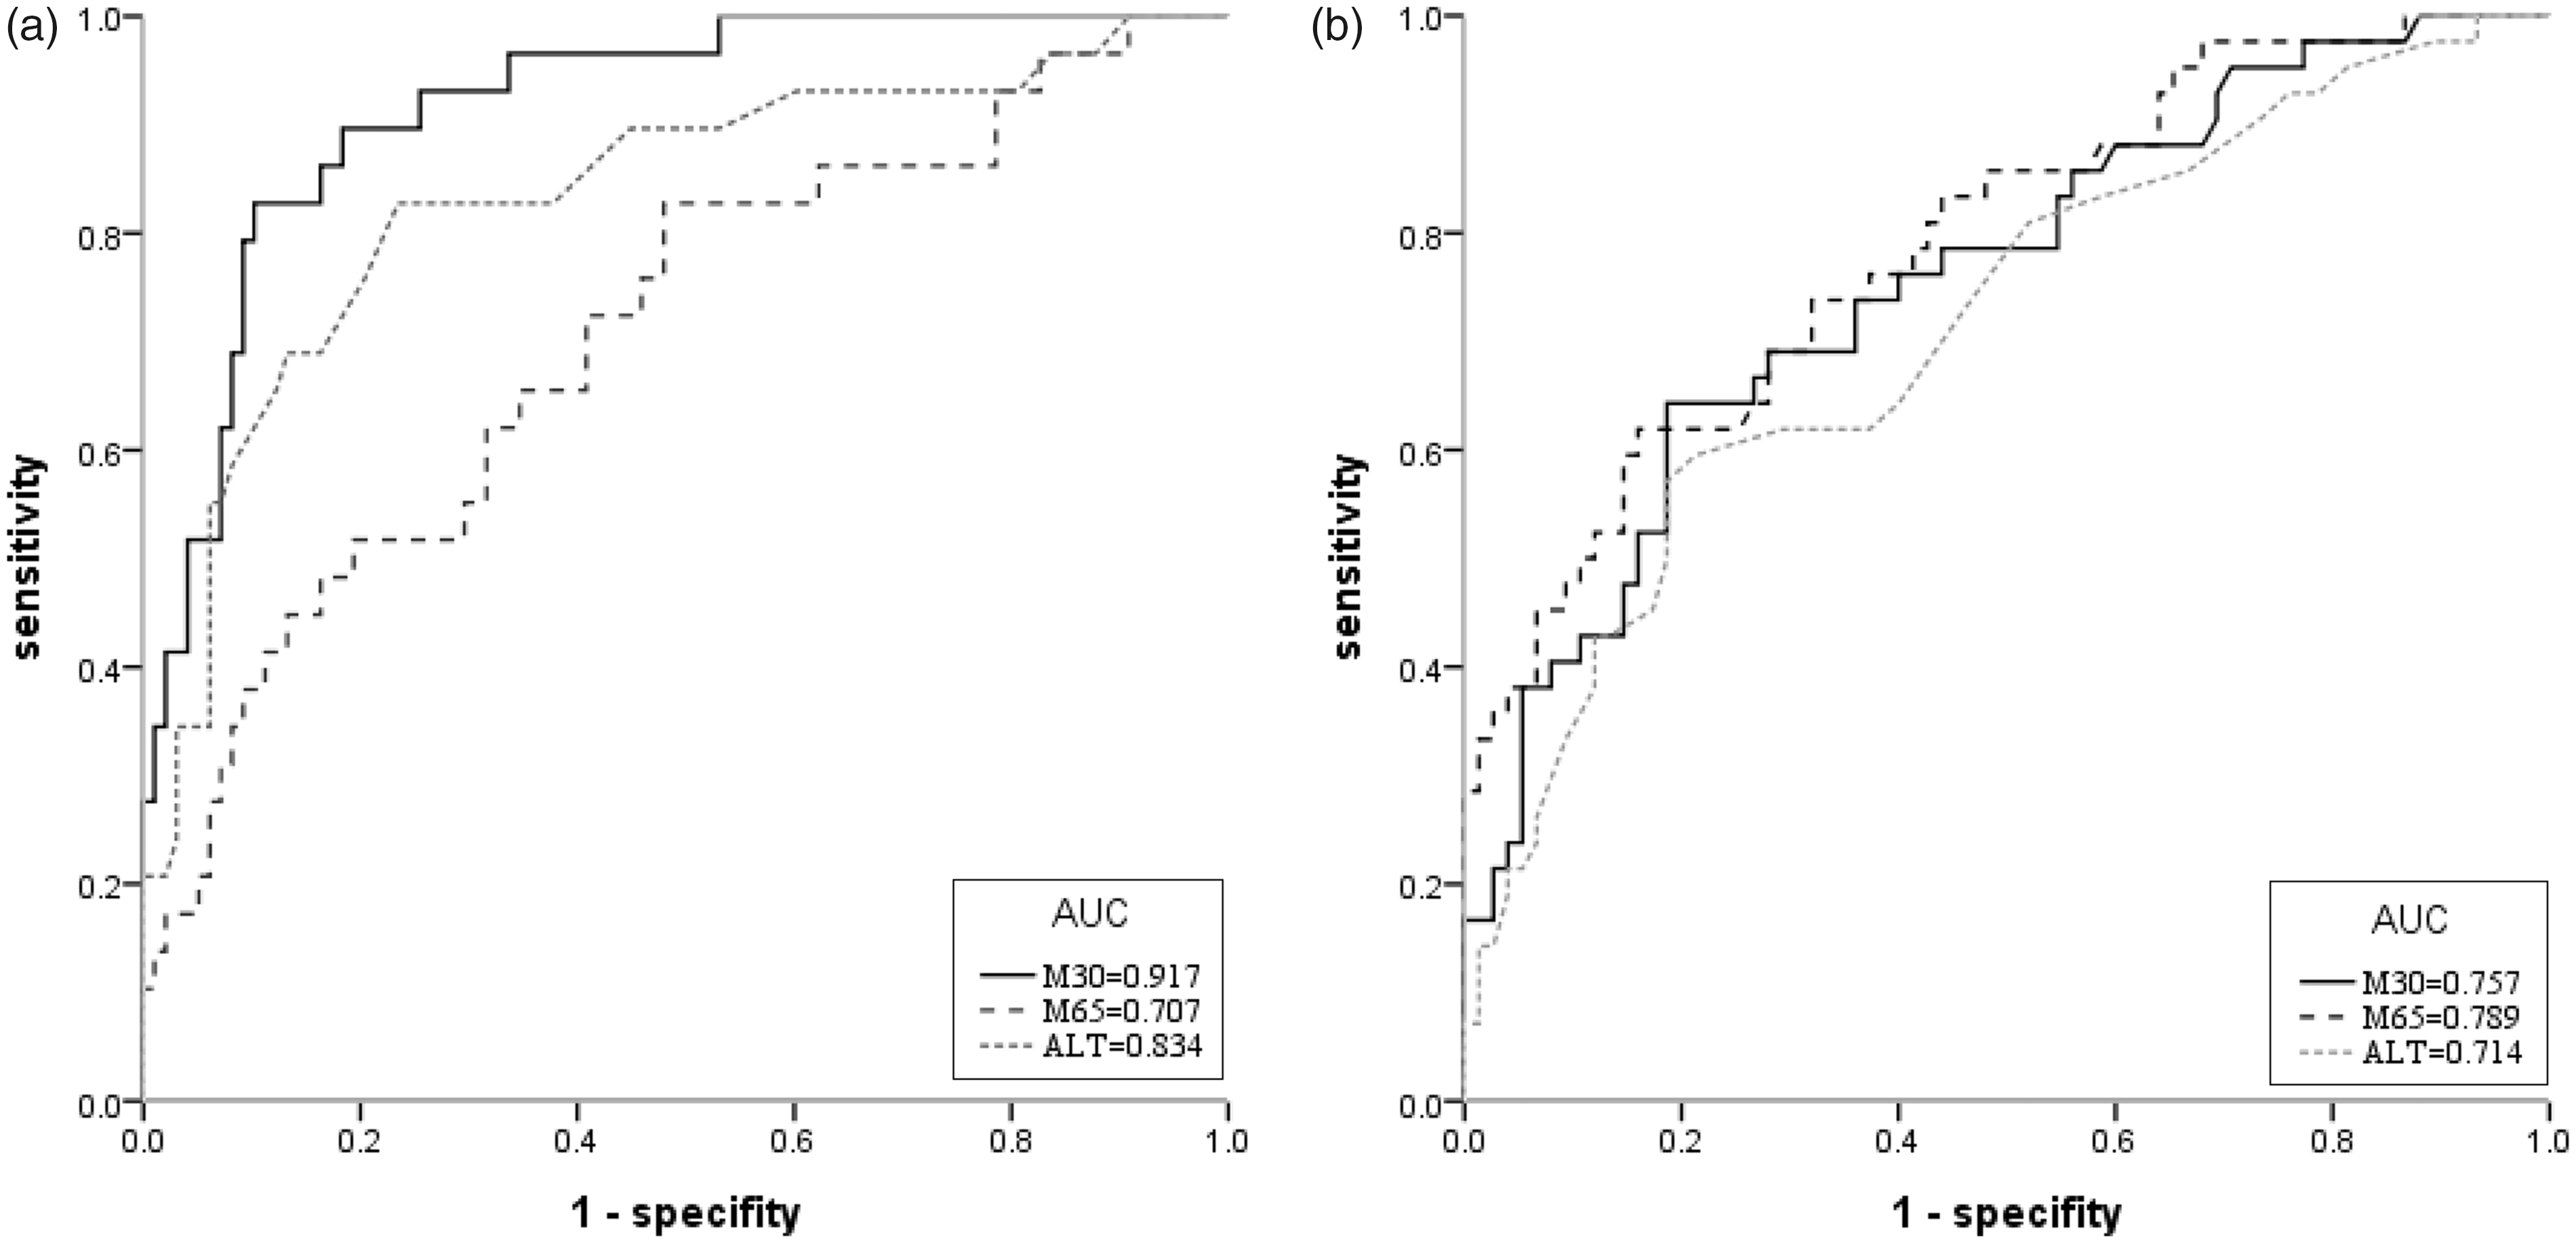
ROC for NAFLD in (a) non-DM patients, (b) T2DM patients.
Discussion
The results of the present study indicated that CK-18 is an appropriate biomarker for the screening of patients for NAFLD. Of note, independent of NALFD, our study indicated that the plasma CK-18 concentration was increased in T2DM patients.
Although the application of CK-18 for the diagnosis of NAFLD in the T2DM population has been discussed, the results regarding the connection of blood glucose to CK-18 concentration have been inconclusive in previous studies. In a US study of 422 study participants, Cusi et al. 18 did not find a significant difference in CK-18 between T2DM patients and non-DM patients. Similarly, Miyasato et al. 14 did not report a difference in the concentration of CK-18 between T2DM and non-DM patients in a Japanese population. Intriguingly, these two studies reported that the CK-18 concentration was significantly associated with glucose metabolism parameters (e.g. A1C, hepatic insulin resistance) in their study populations. Their conflicting results may be a result of bias from sampling error (i.e. unequal distribution of the study population, 14 focus on overweight patients 18 ) or incomplete unadjusted statistical comparisons. On the contrary, our findings not only showed a consistent clinical response of CK-18 in NAFLD but also further demonstrated that the CK-18 concentration was increased in T2DM patients without NAFLD. Our results suggested that the relationship between blood glucose and CK-18 may be worthy of further analysis and discussion.
As CK-18 is a representative marker of NAFLD, it is not surprising that CK-18 and blood glucose are linked, and NAFLD is a risk factor for T2DM development.19,20 Even so, our study results suggested that the association between CK-18 and blood glucose regulation is beyond the influence of NAFLD. Other than hepatocytes, it should be noted that CK-18 is one of the main keratins in the pancreatic islets, as shown by immunofluorescence staining. 21 Accumulating evidence suggests that islet cell apoptosis may play an important role in the development of type 1 and type 2 DM,22,23 and caspase-cleaved CK-18 is likely to act as an enhancer during the apoptotic process. 24 Importantly, in a model of T2DM development in non-human primates, Guardado-Mendoza et al. 25 identified significant CK-18 M30 expression in dysfunctional pancreatic delta and beta cells. Taken in association with our results, although speculative, it could be suggested that CK-18 may be involved the pathogenesis of pancreatic exocrine dysfunction during T2DM development.
Our results suggested that CK-18 could be a more reliable biomarker than ALT for the clinical screening of NAFLD. As demonstrated in our study, ALT was barely elevated in the patients with NAFLD, a result that echoed previous guidelines that indicated the insensitivities of elevated liver enzymes for the detection of NALFD. 3 Although we disclosed a lower cut-off diagnostic value of ALT for NAFLD diagnosis, the diagnostic performance of CK-18 M30 was still better than that of ALT, in line with previous study. 14 Despite Cusi et al., 18 arguing the limited value of plasma CK-18 as a biomarker for NAFLD, their results may have been confounded by the inclusion of 42% of the study population with DM. Nevertheless, in contrast with being an applicable biomarker with a sensitivity and specificity of over 80% in the non-DM population, our findings clearly demonstrated that the diagnostic significance of CK-18 is diminished in T2DM patients, and it is suggested that a more dependable biomarker may be necessary for the study of NAFLD in T2DM patients.
There were several limitations in our study. First, the diagnosis of NAFLD may not have been wholly accurate, as it was not proven by biopsy; however, similar to other studies,14,15,26 it would not be ethical to perform liver biopsies in asymptomatic participants on the basis of a surveillance study. Additionally, our NAFLD patients fulfilled the criteria of both abdominal ultrasound and FLI, which we believe minimized diagnostic inaccuracy. Second, CK-18 values indicating the severity of NAFLD could not be defined in this study, owing to the lack of liver biopsy data. Nonetheless, from the view of clinical screening in outpatient clinics, we attempted to identify potential patients at risk. Third, although we confirmed an independent association between blood glucose and CK-18, we cannot reveal the direction of consequence based on the cross-sectional study design. Despite these limitations, our results obtained in patients of an outpatient clinic may be more reflective of reality than those obtained in the general population. In addition, this was the first study to demonstrate that the concentration of CK-18 is affected by blood glucose, and to further define the optimal cut-off values of CK-18 for the diagnosis of NAFLD in non-DM and T2DM populations. Our results may be used as a reference for subsequent investigations.
In conclusion, for NAFLD surveillance, our results suggested that CK-18 is a potential biomarker that warrants further investigation and ideally, against a more robust reference standard. Additionally, the plasma CK-18 concentration is naturally increased in T2DM patients. Furthermore, our results indicated that further exploration of the role of CK-18 in blood glucose regulation might be promising.
Footnotes
Declaration of conflicting interests
The authors declared no potential conflicts of interest with respect to the research, authorship, and/or publication of this article.
Funding
The authors received no financial support for the research, authorship, and/or publication of this article.
Ethical approval
Antai Medical Care Cooperation Antai-Tian-Sheng Memorial Hospital Institutional Review Board (IRB No. 17–033-B1).
Guarantor
Y-HC.
Contributorship
Y-HC contributed to the protocol development, gaining ethical approval, patient recruitment, data analysis and the development of the manuscript. HCL contributed to protocol development, acquisition, analysis and interpretation of the data, DWH, DMC and KCL contributed to the patient recruitment and discussion. YJL contributed reviewed/edited the manuscript.