
Abstract
Background
Adequate concentrations of vitamin D are required to ensure bone health and minimize the incidence of multiple extraskeletal diseases. Although total 25-hydroxyvitamin D (25OHD) remains the recommended biomarker for assessing vitamin D status, it has been speculated that free 25OHD correlates better with clinical outcomes. The calculation of free 25OHD depends on the concentrations of vitamin D binding protein (DBP), the determination of which involves different immunoassays and has led to varying results and conclusions. We developed a liquid chromatography–tandem mass spectrometry (LC-MS/MS) method for simultaneous identification and relative quantification of DBP isoforms.
Methods
We used serum samples from healthy children (n = 79), mainly Caucasian (88%). Proteins were denatured, reduced, alkylated and digested with trypsin. Purified peptides were analysed by LC-MS/MS. The DBP phenotype was established by using the combinations of tryptic peptides associated with each of the three isoforms and one peptide common to all of them to perform relative quantification. The genotyping of volunteers (n = 7) facilitated verification of the ability of our method to correctly identify the DBP phenotype.
Results
The DBP phenotype was correctly established in all samples from volunteers, based on the 100% correlation observed with the genotype. The most common DBP phenotype in Caucasian children was 2/1S (34%) and the rarest 1F/1F (2%). The relative quantification of DBP concentrations did not show statistically significant differences between phenotypes (P = 0.11).
Conclusions
LC-MS/MS enabled simultaneous phenotyping and relative quantification of DBP, while avoiding the analytical limitations of immunoassays and confirming similar concentrations of DBP in all phenotypes.
Keywords
Introduction
The role of vitamin D in the metabolism of calcium and phosphate has been well established; a deficiency is associated with poor bone health. More recently, associations between low levels of vitamin D and an increased risk of cardiovascular, inflammatory, neoplastic and neurodegenerative diseases have been described.1–4 These findings have increased interest in vitamin D and, consequently, requests for clinical laboratory testing have increased exponentially.
Current guidelines recommend the measurement of total serum 25OHD as the preferred test for the assessment of vitamin D status.2,5,6 However, several studies have shown that the association of 25OHD with several outcomes, such as bone, parathyroid hormone-related or other extraskeletal diseases, is not as strong as expected and is not consistent across different populations.2,6 According to the free-hormone hypothesis, it is the free fraction of a hormone (unbound to proteins) that is biologically active.2,6,7–10 It would therefore be expected that the free fraction of 25OHD would correlate more strongly with the biological actions of vitamin D than the total serum 25OHD.
The majority of circulating 25OHD is bound to DBP, with a smaller proportion (10–15%) bound to albumin. The binding constants of DBP and albumin are ∼1000-fold different, with DBP as the carrier with the highest affinity. It is estimated that less than 0.1% of 25OHD circulates freely.2,6,7,8 Direct determination of the free fraction of 25OHD remains a challenge, and although an ELISA kit has recently been marketed, sensitivity and lack of a reference method remain clear limitations for this analysis.2,8 Consequently, most of the studies on free 25OHD have estimated this vitamin D component based on equations that use binding coefficients for DBP and albumin, 11 coupled to the measurement of total serum 25OHD and DBP.12–14
DBP, also known as a group-specific component or Gc-globulin, is a single chain glycoprotein of 52–59 kDa primarily synthesized in the liver. Besides its major role in the transport of vitamin D metabolites, DBP exerts several other important biological functions including actin scavenging, fatty acids transport, leukocyte chemotaxis, osteoclast stimulation and macrophage activation.7,15,16
DBP is a highly polymorphic protein with three major haplotypes (Gc1F, Gc1S and Gc2) resulting from different combinations of two single nucleotide polymorphisms (SNPs) in the DBP gene (4q12-q13), rs7041 (D416E) and rs4588 (T420K).8,15,17 The three alleles exhibit a distinct geographical distribution. The Gc1F allele is more common in blacks and Asians, whereas Caucasians are more likely to carry the Gc1S allele. The Gc2 allele is rarely found in blacks but frequently found in Caucasians, although its prevalence is lower in comparison with the Gc1s allele.4,8,15,18
Combinations of these alleles likely influence DBP concentration, the affinity for 25OHD and, consequently, free 25OHD concentrations.6,8,17,18 These findings could justify the weak correlation observed between total 25OHD concentrations and clinical manifestations in Gc1F carriers (mostly black individuals). This hypothesis was reinforced by a study carried out by Powe et al., reporting that DBP was lower in African Americans than in white Americans, and that calculated bioavailable 25OHD concentrations were similar in both despite the lower total 25OHD concentration reported in African American. 19 However, other publications have demonstrated similar DBP concentrations regardless of the genotypes.5,20–24 It has been argued that this lack of agreement could be due to the inadequate detection of Gc1F by the monoclonal ELISA method,5,23,25 used in the study previously mentioned. 19
To contribute to clarifying these facts, the aim of this study was to develop a mass spectrometry-based method for phenotype identification and relative quantification of DBP, in order to avoid many of the problems associated with immunoassays. 26
Materials and methods
Reagents and materials
Urea, ammonium bicarbonate, dithiothreitol, iodoacetamide and trypsin from porcine pancreas (type IX-S) were purchased from Sigma-Aldrich (Oakville, Canada). Acetonitrile (hypergrade for LC-MS), methanol (hypergrade for LC-MS) and formic acid (Suprapur) came from Merck-Millipore (Massachusetts, USA). Ultrapure water was obtained from a Milli-Q purification system (Millipore, Molsheim, France). Four isotopically labelled standard peptides came from JPT Peptide Technologies (Berlin, Germany). One additional peptide (355SLGECCDVEDSTTCFNAK372) was initially purchased, but was withdrawn for subsequent analyses due to poor instrument response. SampliQ OPT Polymer (60 mg/3 mL) solid-phase extraction (SPE) cartridges came from Agilent Technologies (Lake Forest, CA, USA).
Sample collection and study population
Blood samples (n = 79) were obtained at the time of birth from umbilical cord blood of newborns (born at term) or collected from a peripheral vein during routine preoperative laboratory testing in children younger than 14 years of age. Children lived in northwestern Spain and were mainly Caucasian, with only 12% of other races (mainly Hispanic American) but none were black. All parents provided written informed consent.
The study was conducted according to the Declaration of Helsinki (2013 version), and ethics approval for sample collection was obtained from the Regional Institutional Review Board of the Principality of Asturias. All samples were centrifuged and stored at −24°C until assayed. Samples from other hospitals were transported on dry ice.
Additionally, blood samples from healthy volunteers (n = 7) were obtained at the Hospital Universitario Central de Asturias (Oviedo, Spain) and used to check the phenotype–genotype correlation.
Genotyping
Using the salting-out method, genomic DNA was isolated from the EDTA whole-blood samples of seven volunteers. The GC gene codifying region, containing rs7041 and rs4588 SNPs, was polymerase chain reaction (PCR) amplified using 5′TGTAAAAGATCTGAAATGG3′ and 5′CATAATGGCATCTCAATAA3′ primers. Reactions were carried out with a 20 µL final volume using 300 nM/primer and 0.8 units of Taq DNA Polymerase (EURx Ltd, Poland). PCR amplification was obtained by denaturing at 95°C for 3 min, followed by 32 cycles of denaturing at 95°C for 30 s, annealing at 48°C for 1 min and extension at 72°C for 1 min. Sanger sequencing was performed using BigDye chemistry (Applied Biosystems-Applera Corporation, Foster City, California, USA) in all cases. The genotyping results were analysed by end-point reading using Sequencher 5.4 software (Gene Codes Corporation, Ann Arbor, Michigan, USA).
Peptide selection
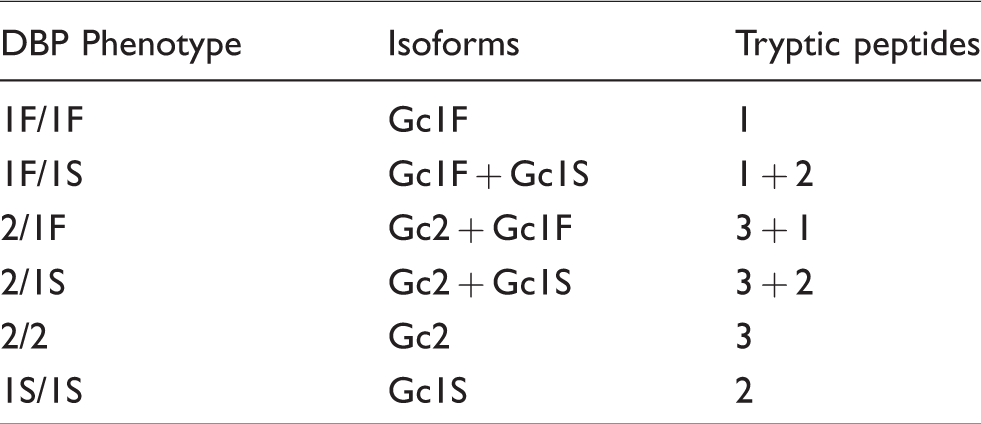
Based on sequences obtained from UniProt (Protein code: P02774) (http://www.uniprot.org), three tryptic peptides deriving from SNPs, rs7041 (D416E) and rs4588 (T420K), were selected to distinguish the different DBP isoforms: Gc1F (414LPDATPTELAK424), Gc1S (414LPEATPTELAK424) and Gc2 (414LPDATPK420) (Table 1). The presence of different combinations of these three peptides enabled identification of the DBP phenotype (Table 2). In addition, we used one peptide common to the three isoforms (387GQELCADYSENTFTEYK403) to perform relative quantification of DBP concentrations (Table 1).
Peptide sequences derived from the two polymorphisms (named from 1 to 3) used for DBP phenotyping, and sequence used for relative quantification.
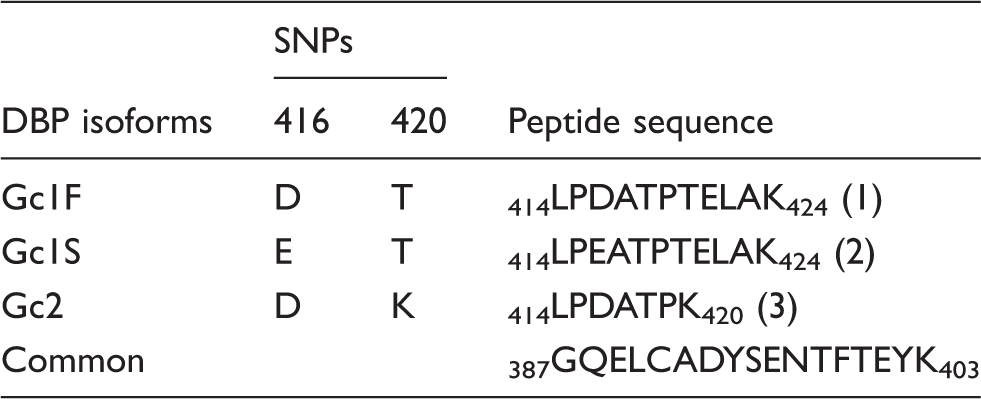
SNP: single nucleotide polymorphism; DBP: vitamin D binding protein.
DBP phenotype based on the presence of different combinations of tryptic peptide associated with each isoform.
Peptide identification and selection of transitions
For selected reaction monitoring (SRM) assay development, all transitions from y3 to yn−1 and b3 to bn−1 were initially monitored in a pool of serum samples. Peptide identification was confirmed by the co-elution of at least four transitions per peptide. Then, two (common peptide) or three transitions were selected for each endogenous and isotope-labelled peptide based on two main criteria: higher intensity and lower background signal (signal to noise ratio).
Sample preparation for SRM analysis
Before analysis, samples were thawed at room temperature and homogenized. One hundred microlitres of plasma were denatured and reduced with 5 mM dithiothreitol for 40 min at 60°C. Alkylation was performed using 15 mM iodoacetamide for 60 min at room temperature and in the dark. More dithiothreitol was added to a 10 mM final concentration (to quench the excess of iodoacetamide), and the samples were incubated for 15 min at room temperature. Ammonium bicarbonate (20 mM) was added to avoid denaturation of the trypsin used in the following step. Proteins were digested with trypsin for 24 h at 37°C (1:30 trypsin to total protein ratio) and digestion was stopped with 0.5% formic acid. After trypsinization, the mixture of isotopically labelled peptides was added (86 nM Gc1F, 85 nM Gc1S, 67 nM Gc2 and 73 nM of common peptide). Peptides were purified and extracted using SampliQ OPT Polymer SPE cartridges and then eluted in 1 mL of methanol (0.5% formic acid). Finally, methanol was evaporated under nitrogen flow, and peptides were diluted with 100 μL of water (0.5% formic acid).
LC-MS/MS conditions
Peptides were eluted onto a resolving 5-cm analytical column (C18, 1.8 μm) with an inner diameter of 0.21 cm (Agilent Technologies, Lake Forest, CA, USA). The LC setup, ekspert ultraLC 100 (Eksigent, ABSCIEX, Dublin, California, USA), was coupled online to a triple-quadrupole mass spectrometer (QTRAP 5500, ABSCIEX, Dublin, California, USA) using an electrospray ionization source. A five-step 10-min gradient with an injection volume of 10 μL was used. Buffer A contained 0.5% formic acid in acetonitrile, and buffer B contained 0.5% formic acid in water.
Peptides were analysed by SRM assays with the following parameters: positive-ion mode, predicted collision energy values, optimized scan times, 0.7 Th of full width at half maximum (fwhm) in Q1 and 0.7 Th in Q3, 1.50 mTorr Q2 pressure and tuned tube lens values. In silico digestion, fragmentation and prediction of collision energy were performed using Skyline software, version 3.7.27,28
Relative quantification of DBP concentrations
For relative quantification, one isotopically labelled peptide with a sequence common to the three endogenous peptide isoforms (387GQELCADYSENTFTEYK403) was spiked into the samples. Two transitions were monitored but only the most intense and non-interference transition was used for quantification. The light/heavy ratio was calculated using Skyline software (version 3.7),27,28 and then multiplied by the amount of isotope-labelled peptide added and adjusted by the sample volume to finally estimate the relative amount of native peptide.
Statistical analysis
Statistical analyses were performed with IBM SPSS Statistic software, version 15 (SPSS Inc., Chicago, IL, USA). Means and standard deviations (SD) were calculated for descriptive and comparative purposes. Normal distribution was evaluated using the Shapiro-Wilk test and by inspection of Q-Q plots. A non-parametric Kruskal−Wallis test was performed for comparison between the six groups of independent samples. A P-value <0.05 was considered statistically significant.
Results
Peptide and DBP phenotype identification
The identity of peptides was confirmed by co-elution with the appropriate relative intensity of at least four transitions for each peptide monitored. The different peptides eluted at a retention time of: 2.6 min (LPDATPK), 3.5 min (LPDATPTELAK and LPEATPTELAK) and 4.1 min (GQELCADYSENTFTEYK).
The DBP phenotype was established by using the combinations of tryptic peptides associated with each one of the three isoforms (Table 2). The DBP phenotype was assigned depending on the presence or the absence of these peptides. Figure 1 shows examples of LC-MS/MS chromatographs for the six phenotypes.
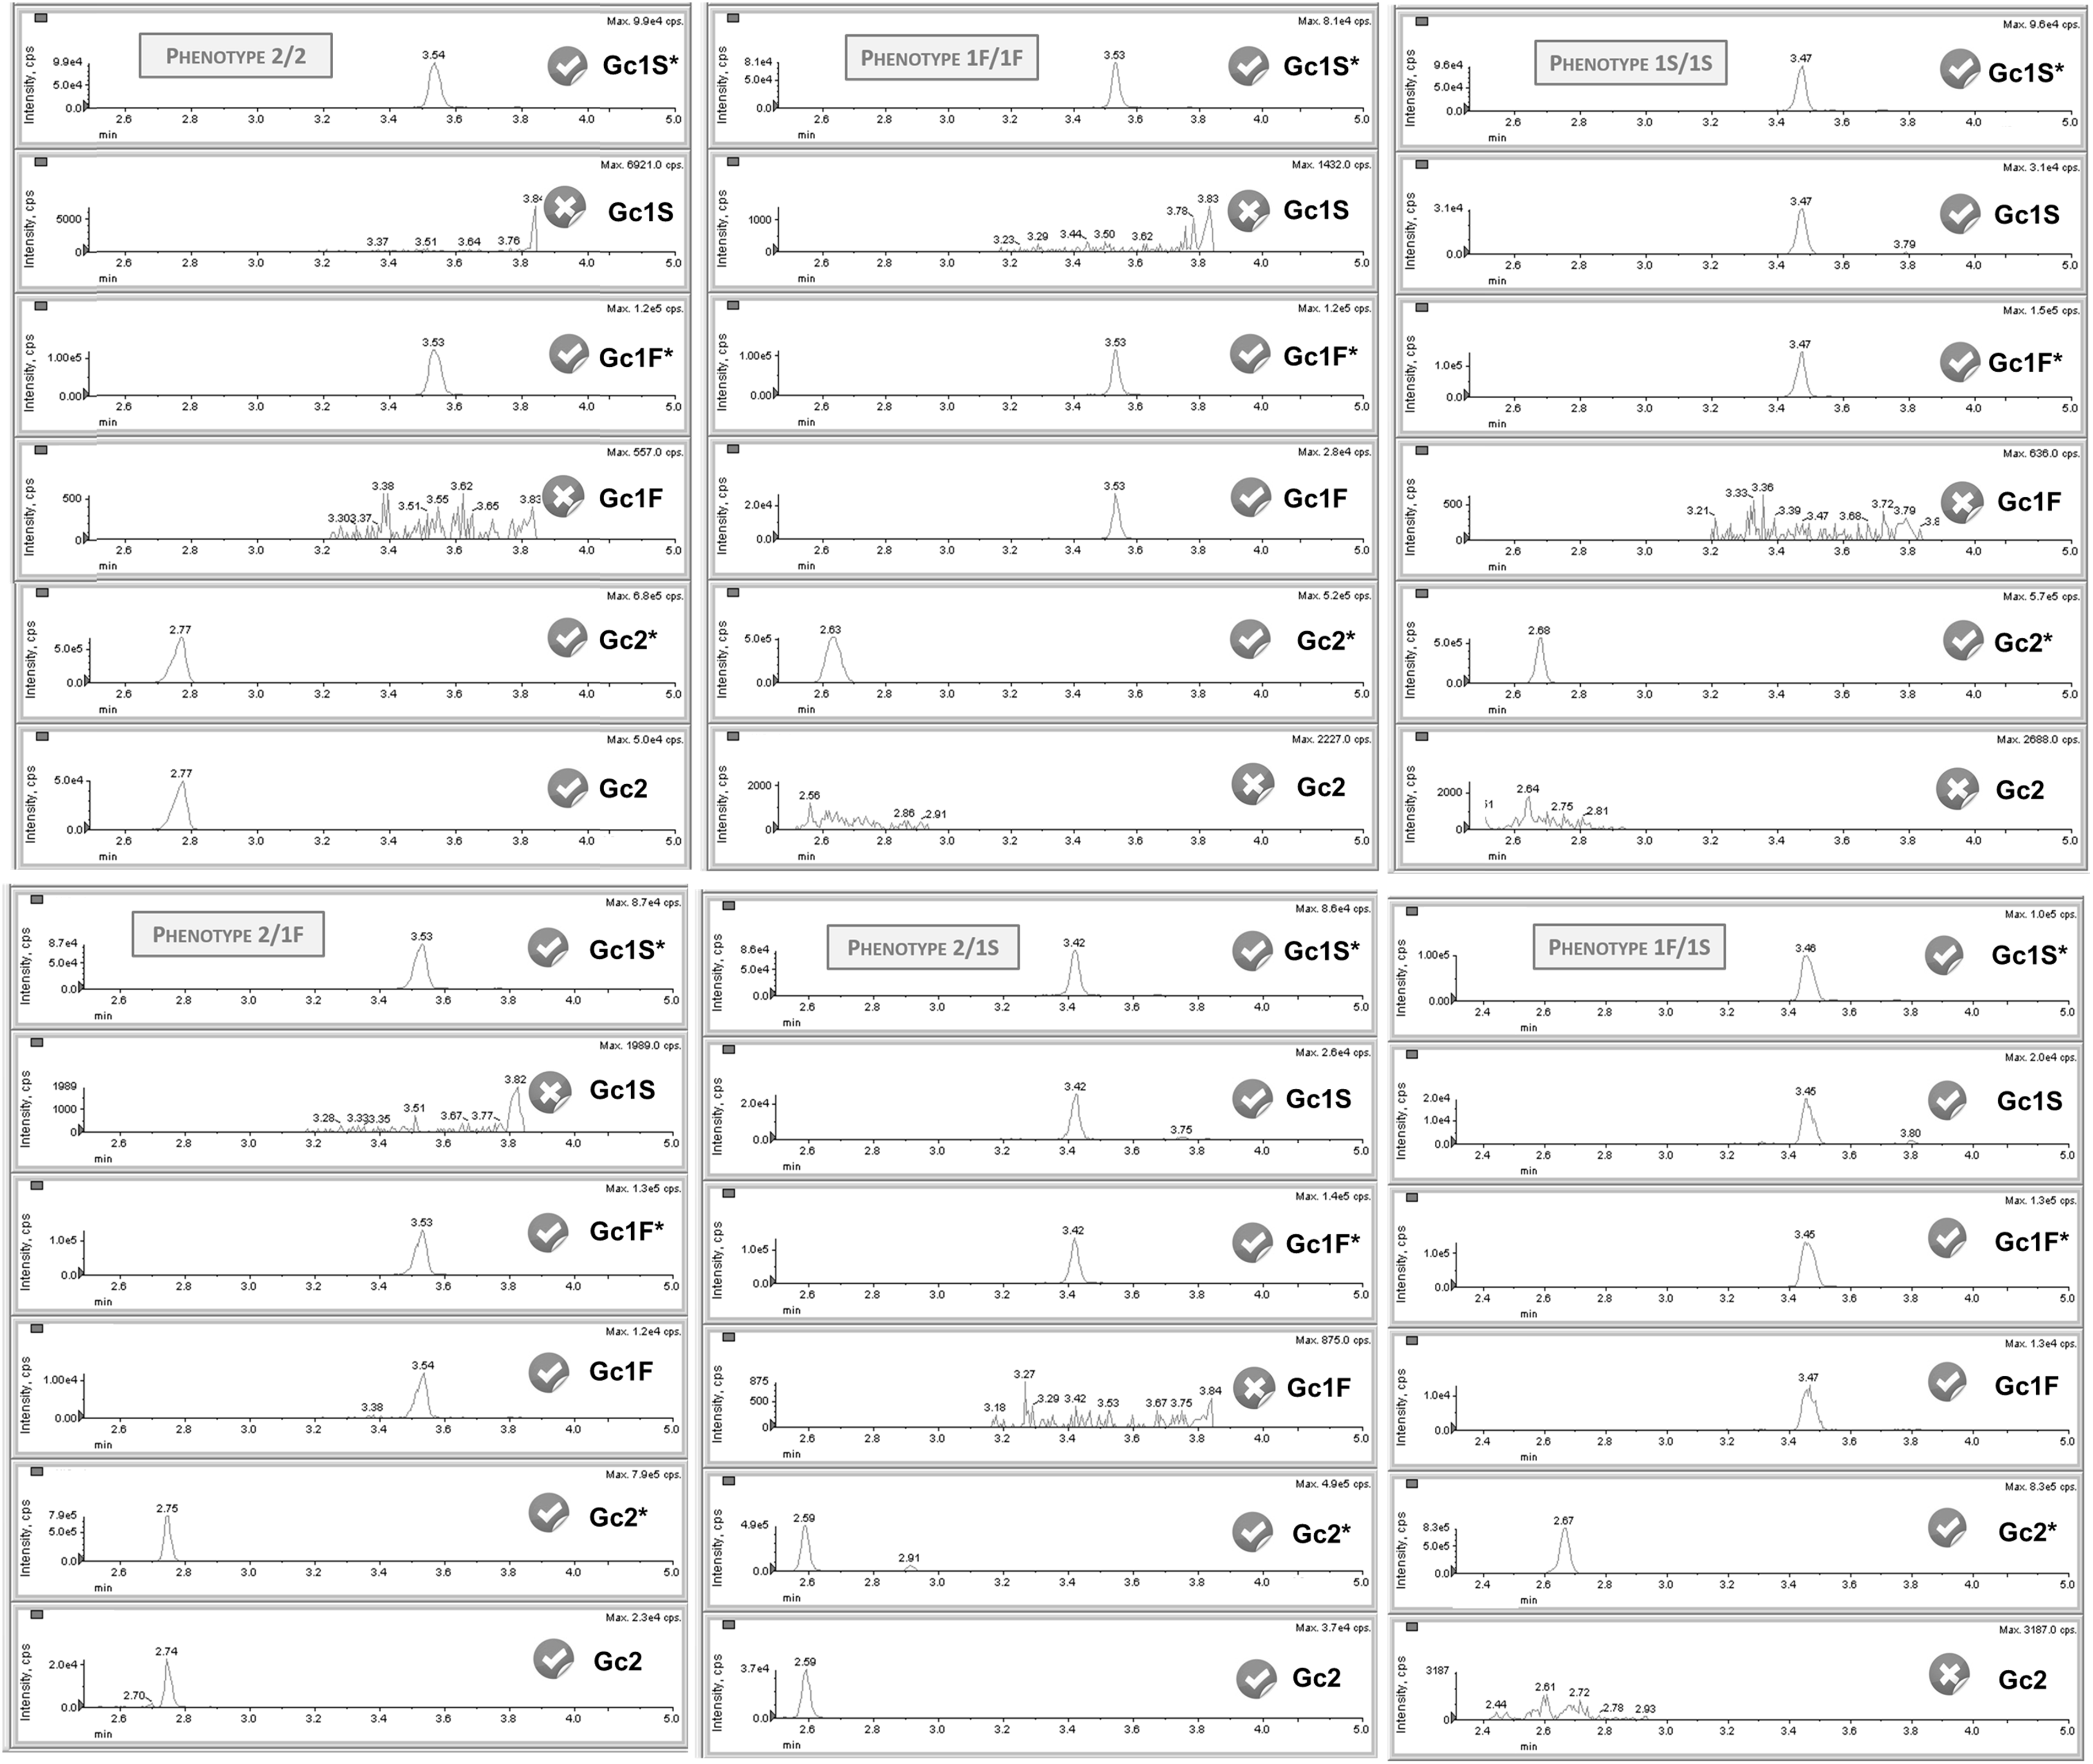
Examples of LC-MS/MS chromatographs of the six possible phenotypes of DBP. Chromatograms of Gc1S*, Gc1F* and GC2* correspond to the isotopically labelled peptides. The presence of different combinations of endogenous peptides enabled the identification of the DBP phenotype.
DBP phenotype–genotype correlation
To evaluate the ability of our method to correctly identify the DBP phenotype, we analysed serum samples from healthy volunteers (n = 7) who were genotyped in parallel. The DBP phenotype was successfully assigned to all samples (100% success rate). Five of the six possible phenotypes were observed; however, the 1F/1F was not present in any of the participants. The 2/1S phenotype was assigned to three of the volunteers.
Frequency of different DBP phenotypes
Figure 2 shows the distribution of DBP phenotypes in patients identified as Caucasian (the most common race in our study). The most common DBP phenotype was 2/1S (34%) and the rarest 1F/1F (2%). Similar frequencies were observed between 1S/1S and 1F/1S phenotypes (25% and 23%, respectively), as well as between 2/2 and 2/1F phenotypes (9% and 7%, respectively). The low number of representatives from other ethnicities (n = 9) did not enable frequencies to be studied in those groups.
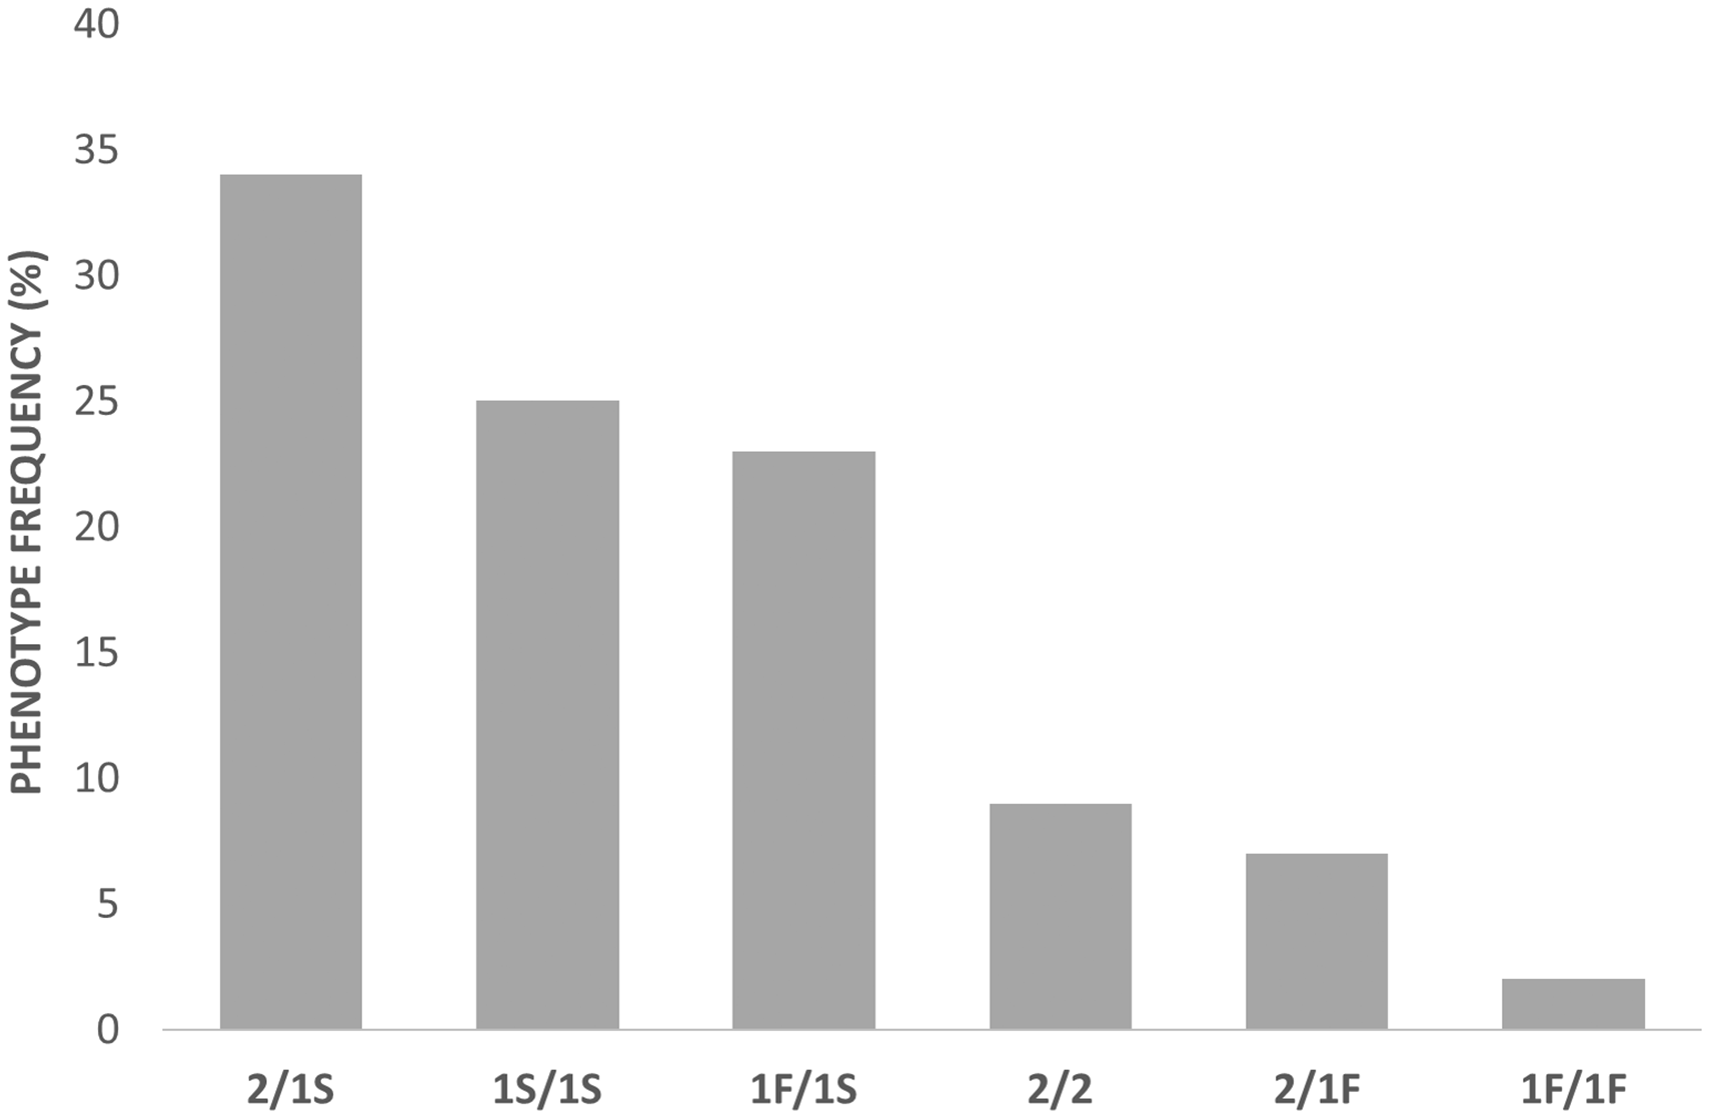
Distribution of DBP phenotypes observed in Caucasian participants.
Relative quantification of DBP
All samples were subjected to the experimental procedure described in the Materials and methods section and were analysed in two batches of 40 and 41 samples. Five samples were excluded from the quantification due to analytical problems. Two samples were analysed in both batches to evaluate imprecision; coefficients of variation (CV) of 1% and 4% were obtained.
The relative quantification of endogenous peptide in the sample was carried out using the light/heavy ratio associated with the most intense and less interfered transition of the common peptide to the three isoforms (y4) and considering the volumes involved in the process. The calculations are directly dependent on the amount of isotopically labelled peptide added, so it is important to note that the concentrations obtained for the endogenous peptide do not adjust to the real concentration of DBP in the samples but may be overestimated by the lack of purity of the isotopically labelled peptide used. However, these values are perfectly valid to perform comparisons between groups. Table 3 shows the relative mean concentration of DBP according to phenotype. Our results indicate that there are no statistically significant differences between the DBP concentrations of patients with different phenotypes (P = 0.11).
Relative serum concentration of DBP by phenotype.
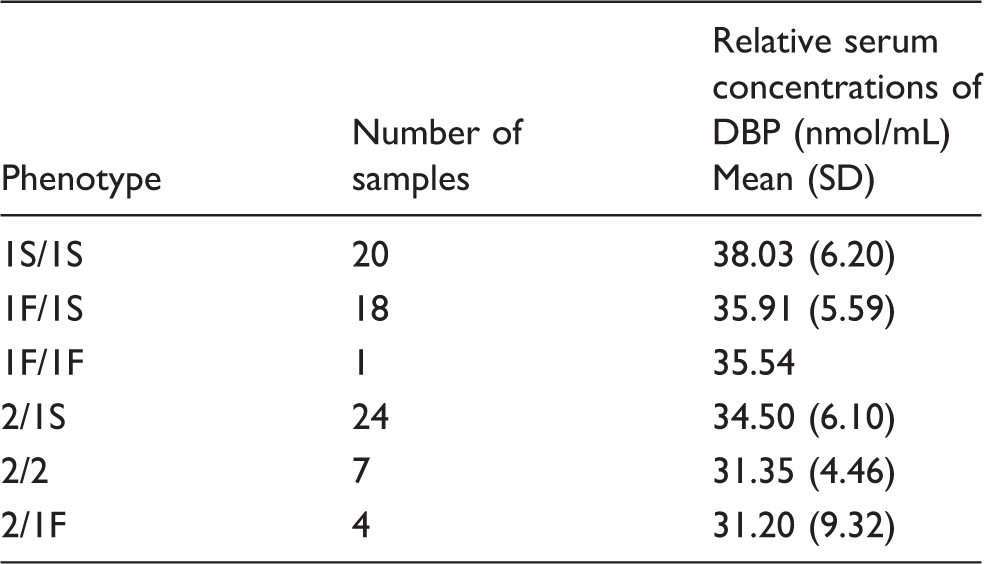
Note: Statistical significance was assessed using Kruskal−Wallis test (P-value =0.11). DBP (μg/mL) = 53·DBP (nmol/mL) (molecular weight of DBP: http://www.uniprot.org).
DBP: vitamin D binding protein.
Discussion
Vitamin D is a crucial analyte for bone health and to minimize the incidence of other extraskeletal disorders such as diabetes, cancer or cardiovascular diseases. In recent years, it has been speculated that free 25OHD could be more closely related with clinical outcomes than total 25OHD.2,6,7–10 The direct measurement of the free 25OHD has important analytical limitations, so most studies have determined this parameter through a mathematical approach that uses, among other variables, the concentration of DBP.
DBP has three major haplotypes, Gc1F, Gc1S and Gc2, with varying prevalence according to race, the Gc1F allele being the most common in black individuals. The lack of correlation observed in this population between low concentrations of total 25OHD and the characteristic disorders associated with vitamin D deficiency (hyperparathyroidism or low bone mineral density) has suggested that DBP isoforms may be responsible for these observations.4,8,15–18
This hypothesis gained widespread attention after the results obtained by Powe et al. 19 This study concluded that DBP concentrations were lower in blacks, which implied bioavailable 25OHD concentrations comparable to those in the white population and a better association with clinical parameters. Bioavailable 25OHD was calculated using the DBP results obtained by an immunoassay (R&D Systems) based on a primary monoclonal antibody generated against a single fragment of the human DBP peptide. This antibody shows affinity differences for DBP phenotypes, being lower for the Gc1F isoform and, consequently, provides artificially low values for the most common allele in blacks.6,23–25 Therefore, the validity of the conclusions of the studies that used this monoclonal immunoassay has been questioned.9,16,19 There is a need for new studies with polyclonal immunoassays or proteomic methods that would clarify the role of free 25OHD as a possible best biomarker for vitamin D status.
After these contradictory results, Nielson et al. determined DBP concentrations by four different methods: the monoclonal ELISA, one polyclonal radial immunodiffusion assay and two polyclonal assays.5,24 They also compared total 25OHD with directly measured and calculated concentrations of free 25OHD. DBP concentration was similar between races using polyclonal antibodies, whereas it was significantly lower in the black population when measured by a monoclonal ELISA method. Concentrations of measured free and calculated 25OHD were strongly correlated using polyclonal assays but the correlation was much lower using the monoclonal assay. In addition, concentrations of measured free and total 25OHD were strongly correlated. Other investigations with polyclonal immunoassays reached the same conclusions.22,29 However, Aloia et al. reported similar DBP concentrations measured by polyclonal immunoassay in blacks and whites, but they observed comparable free 25OHD concentrations in both despite the lower total 25OHD in blacks. 21 Recent studies focusing on proteomic analysis reported similar concentrations between genotypes and very different results in the DBP concentrations obtained by LC-MS/MS or monoclonal assay.20,23
We conducted this study to clarify whether there are differences in DBP concentration according to the different isoforms of this carrier. Immunoassays are widely used in routine practice due mainly to their simplicity, shorter turnaround and low instrumental costs. However, they present important limitations when used in the initial study of new biomarkers, especially due to their relatively low specificity, cross-reactivity and lack of agreement between platforms. 26 LC-MS/MS emerges as the methodology of choice to evaluate the potential of a new biomarker, such as free 25OHD, that depends directly on the determination of DBP concentrations. Therefore, we developed a method for the phenotyping and relative quantification of DBP by LC-MS/MS, which is similar to the one published by Henderson et al. 20 However, we decided to focus on paediatric population to elucidate if there are differences in the DBP concentrations among phenotypes. Our assay reports that DBP phenotypes are detectable in serum and identifiable using the combinations of tryptic peptides associated with each of the three isoforms (Gc1F, Gc1S and Gc2) (Table 2). In order to confirm that our method correctly identifies the three DBP isoforms, we selected a few individuals (seven EDTA whole-blood samples from volunteers) to ensure the presence of the three isoforms (in homozygosis or, at least, heterozygosis), based on the prevalence of DBP genotypes. Genotyping confirmed the correlation between the genotype and phenotype obtained by LC-MS/MS.
The distribution observed for the various DBP phenotypes in our Caucasian population concurs with previous studies.4,8,15,18 The Gc1S allele was the most common (54%), whereas the Gc1F allele presented the lowest frequency (17%). The relative quantification of DBP was carried out using the light/heavy ratios associated with the most intense and less interfered transition of the common peptide for the three isoforms (Table 1). Although we provide relative concentrations of DBP, the values obtained are valid for comparing the levels among the different phenotypes. Our results are consistent with other proteomic studies,20,23 observing similar DBP concentrations in all phenotypes.
Nevertheless, we also acknowledge the limitation of our findings. Our sample sizes for some DBP phenotypes were small, particularly 1F/1F, so for these groups our results should be interpreted with caution. In addition, we determined DBP concentrations using unpurified isotopically labelled peptides, so concentrations obtained may be overestimated in all groups (relative levels). However, this approach is reasonable to demonstrate whether there are or not significant variations in the DBP concentrations according to the phenotype, since an absolute quantification is not necessary to check for differences among groups (1S/1S, 1F/1F, 2/2, 1S/1F, 1S/2, 1F/2).
In conclusion, the LC-MS/MS method described here provides DBP phenotyping and simultaneous relative quantification, avoiding analytical problems associated with immunoassays that may lead to misleading conclusions. Our results match others obtained in previous proteomic studies, showing that DBP concentrations do not differ between isoforms and are therefore not responsible for the racial differences observed in total 25OHD concentrations. For this same reason and assuming a mean affinity constant for the three isoforms, it does not appear necessary to determine the phenotype simultaneously with the DBP concentration in order to calculate free or bioavailable 25OHD. In any event, further investigation is needed to understand the true role of DBP in 25OHD status and metabolism.
Footnotes
Declaration of conflicting interests
The authors declared no potential conflicts of interest with respect to the research, authorship, and/or publication of this article.
Funding
The authors received no financial support for the research, authorship, and/or publication of this article.
Ethical approval
The Regional Clinical Research Ethics Committee of the Principality of Asturias approved this study (n° 101/14).
Guarantor
AIC and EMM.
Contributorship
AIC and EMM – designed the study, analysed the samples and wrote the paper. LM, MAA and HGP contributed to data analysis and interpretation. FS and FVA revised the article critically. All authors reviewed and approved the final version of the manuscript.