
Abstract
Background
To clarify the relationship between glycated haemoglobin and glycated albumin concentrations during pregnancy with neonatal outcomes, a multicentre study was conducted by the Japanese Society of Diabetes and Pregnancy.
Methods
A total of 136 patients (type 1: n = 47, type 2: n = 89) who enrolled in the study were diagnosed based on the Japanese Diabetes Society diagnostic criteria for diabetes mellitus. Thresholds for glycated haemoglobin and glycated albumin were set at 5.8% and 15.8%, respectively, as the upper limits of the reference interval in pregnant women.
Result
Random plasma glucose decreased linearly, and reached the reference interval at 40 weeks. Glycated albumin concentrations also decreased in the same manner. But glycated haemoglobin concentrations were out of the reference interval during the study. The frequency of the neonatal complications did not show significant differences between the glycated haemoglobin ⩾5.8% group and the glycated haemoglobin <5.8% group. On the other hand, the frequency of neonatal complications showed higher tendency of neonatal complications in the incidence of polycythaemia (P = 0.094) and heavy-for-date (P = 0.071) in the glycated albumin ⩾15.8% group compared with the glycated albumin <15.8 group. The respiratory disorder in type 1 diabetes was significantly higher than type 2 diabetes.
Conclusions
For the treatment of pregnant women with diabetes, glycated albumin would be a better marker than glycated haemoglobin. However, glycated albumin is also affected by obesity and albumin, and it is desirable to make a comprehensive judgment with glycated haemoglobin, random plasma glucose and other glycaemic index.
Introduction
Pregnant women with glucose intolerance carry a risk of various maternal–infant complications, including worsening of active retinopathy and nephropathy with proteinuria, congenital malformations, heavy-for-date (HFD) neonates, neonatal hypoglycaemia and hyperbilirubinaemia. To prevent perinatal complications in both the mother and neonates, strict glycaemic control is necessary before and during the pregnancy. 1 Murphy et al. 2 reported that treatment intervention with continuous glucose monitoring (CGM) in pregnant women with diabetes resulted in a significant reduction in maternal hyperglycaemia (third-trimester glycated haemoglobin [HbA1c], birth weight and the incidence of macrosomia.
Currently, in Japan, HbA1c and glycated albumin (GA) are mainly used as glycaemic control markers. As the lifespan of an erythrocyte is about four months, HbA1c reflects glycaemic control status in the previous one to two months and is widely used as a glycaemic control marker. 3 For HbA1c, evidence for the prevention of complications has been established through several large-scale clinical trials, including the Diabetes Control and Complications Trial and the United Kingdom Prospective Diabetes Study.4,5 On the other hand, because the half-life of albumin (around 17 days) is shorter than erythrocytes, GA reflects glycaemic control status around previous two to three weeks. 6 It is known that GA is especially useful in patients with sudden changes in glycaemic control, or in patients with anaemia or on dialysis, in whom HbA1c values are inaccurate.7–11
We examined the reference values of HbA1c and GA during pregnancy in women with normal glucose tolerance before this study (study 1). 12 The Japanese Society of Diabetes and Pregnancy advisory committee on glycated albumin (Japan Glycated Albumin Study Group) as study 1 has established ‘reference intervals of GA and HbA1c in normal pregnant Japanese women’. 12 Using the values at the upper limits of the reference intervals (HbA1c 5.8% [NGSP: National Glycohaemoglobin Standardization Program] and GA 15.8%), we examined the relationship between neonatal complication outcomes and HbA1c and GA in late pregnancy (29–40 weeks) as study 2. 12
Materials and methods
Study period and institutions
First, to investigate the relationships of HbA1c and GA to perinatal outcomes, a committee (Japan Glycated Albumin Study Group) within the Japanese Society of Diabetes and Pregnancy was established, and a study protocol was developed. This prospective study was conducted at 17 institutions that agreed to the protocol. The patient enrolment period was from 1 July 2007 to 31 October 2008, and the target sample size was 50 pregnant women each with type 1 diabetes and type 2 diabetes. They did not have complication of the following diseases: multiple gestation, pregnancy-induced hypertension syndrome, other renal diseases, thyroid disease and other autoimmune diseases.
All study protocols were approved by the institutional review boards at each hospital. The institutions and physicians are listed in the Acknowledgments section. All the procedures followed were in accordance with the ethical standards of the responsible committee of institution and with the Helsinki Declaration of 1964 and later versions. Informed consent or substitute for it was obtained from all patients for being included in the study.
Examinations and measurements
HbA1c is calibrated by CRM004, a reference material for HbA1c measurement certified by the Japan Diabetes Society (JDS). 13 HbA1c was estimated as the NGSP equivalent value (%), calculated by the formula HbA1c (%) = HbA1c (JDS) (%) + 0.4%, considering the relational expression of HbA1c (JDS) (%) measured by the previous Japanese standard substance and measurement methods and HbA1c (NGSP). 14 GA was measured by enzymatic method (LUCICAGA-L, Asahi KASEI, Tokyo). 15
Study and evaluation methods
The diagnosis of diabetes and classification of its type were based on criteria outlined by the Japan Diabetes Society (JDS). 14 Overt diabetes was defined as a fasting plasma glucose ⩾ 7.0 mmol/L (126 mg/dL) or HbA1c ⩾ 6.5% (NGSP). 16 Overt diabetes was classified into type 1 diabetes or type 2 diabetes. Random plasma glucose (RPG), HbA1c, GA, albumin, haematology and urinalysis parameters were measured on each hospital visit (every month). The glycaemic control status was assessed at each hospital by blood glucose monitoring and monthly measured HbA1c and GA concentrations. Prenatal care, timing of the delivery and neonatal care were based on the standards of care at each hospital.
Evaluation parameters at the time of and after delivery included: infant status (sex, weight and Apgar scores at 1 and 5 min), mode of delivery, maternal complications (shoulder dystocia) and neonatal complications (e.g. hypoglycaemia, hyperbilirubinaemia, electrolyte abnormalities, myocardial hypertrophy, polycythaemia or respiratory disturbance).
Statistical analysis
Patient background data (Table 1) are expressed as mean ± standard deviation (SD). The chi-square test was used to analyse differences in the incidence of neonatal complications with regard to HbA1c and GA concentrations. Statistical analysis was performed using Stat Flex for Windows software (Artech, Osaka, Japan). Values of P < 0.05 were considered significant.
Background data for the pregnant women evaluated in this study.
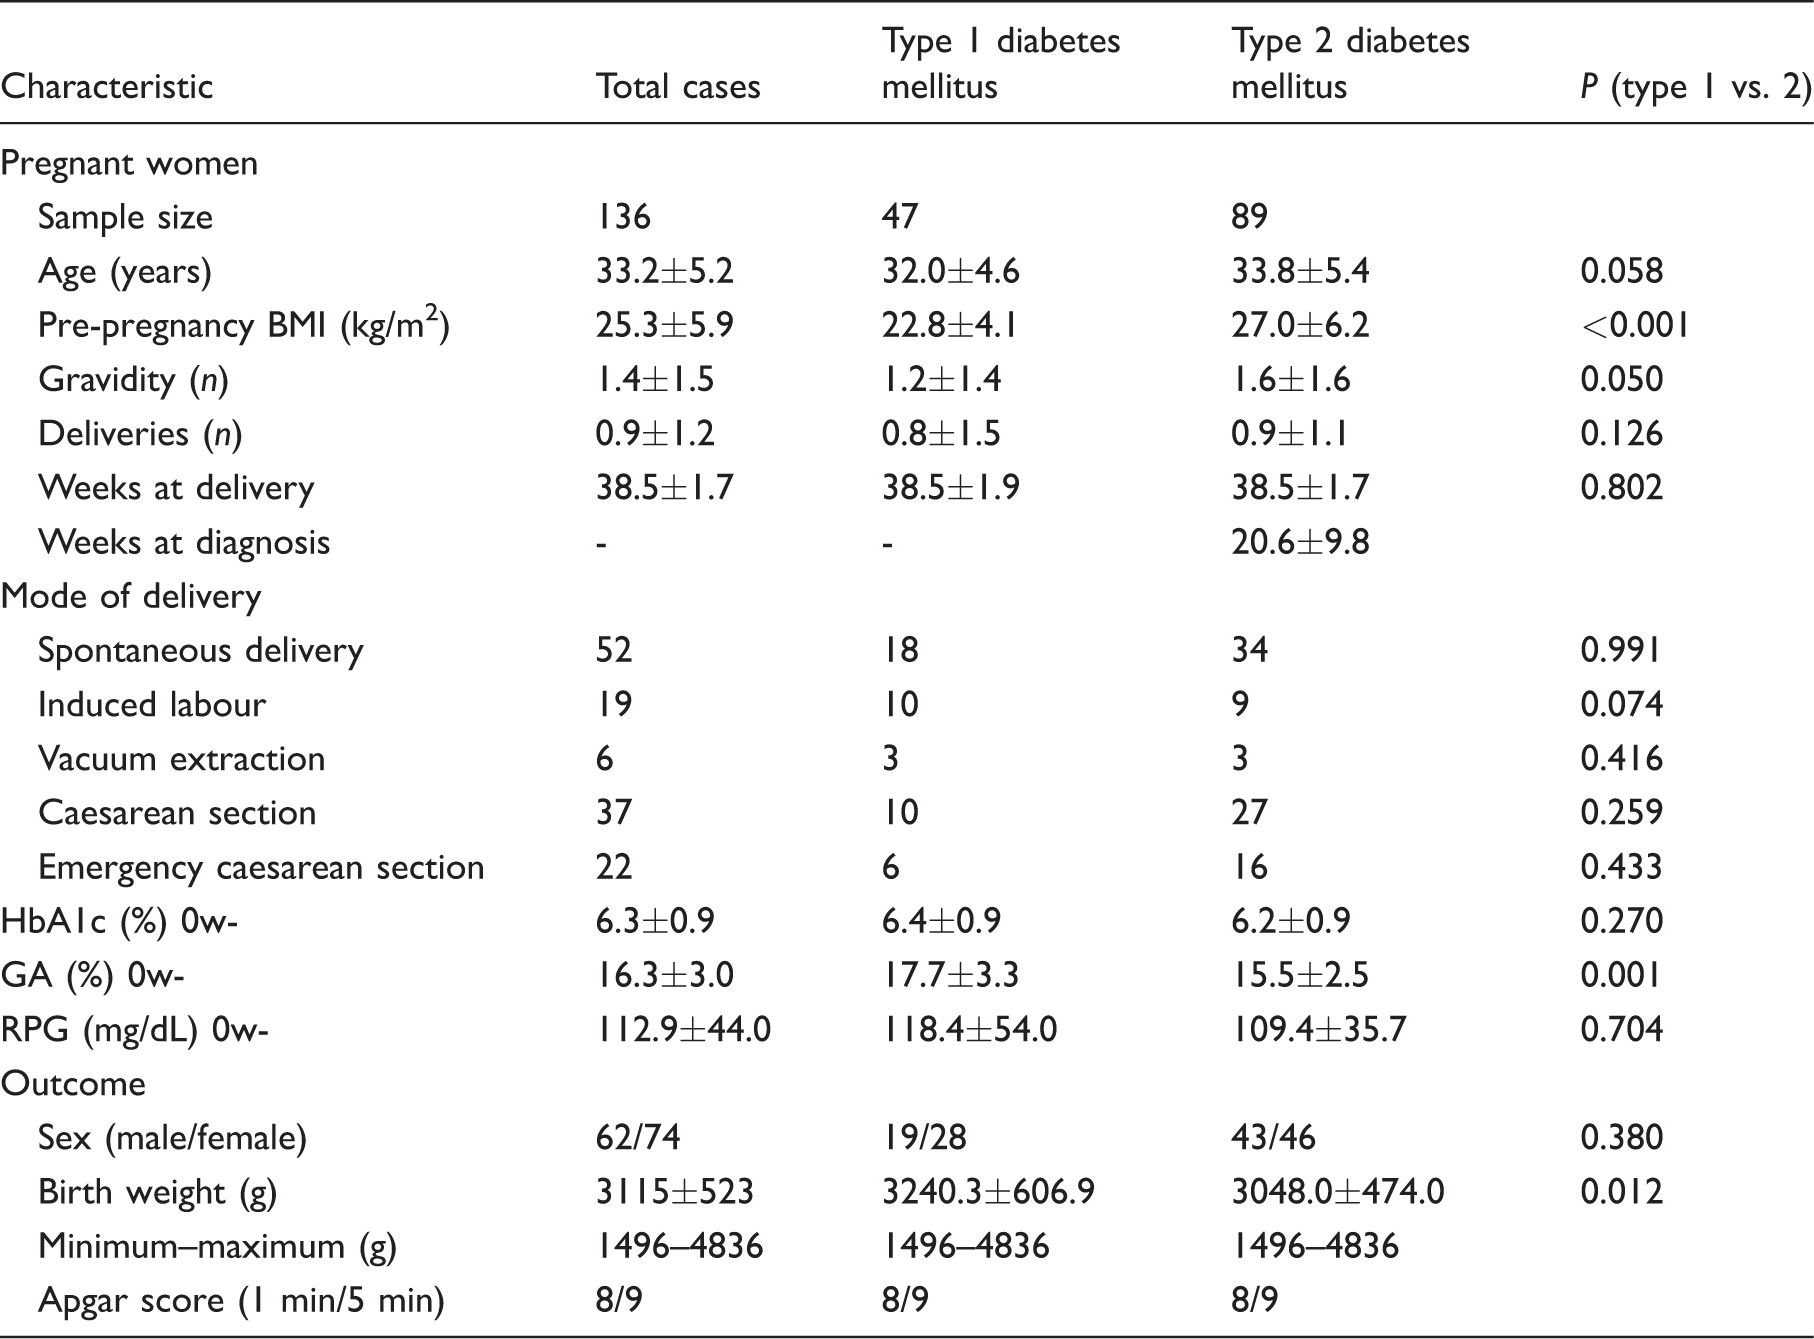
BMI: body mass index; RPG: random plasma glucose; HbA1c: glycated haemoglobin; GA: glycated albumin.
*mean ± SD.
Results
Patients
Based on the JDS diagnostic criteria for diabetes and the new diagnostic criteria for GDM, the 136 pregnant women enrolled in the study comprised 47 with type 1 diabetes and 89 with type 2 diabetes. All patients were treated by insulin therapy during pregnancy. Among all patients, the mean number of weeks at delivery was 38.5 ± 1.7 weeks, and the mean birth weight was 3115 ± 523 g. The frequencies of neonatal complications were: hypoglycaemia, 18.7%; hyperbilirubinaemia, 20.0%; electrolyte abnormalities, 2.5%; polycythaemia, 6.0% and respiratory disorder, 9.5%. Myocardial hypertrophy was not identified. In addition, the incidence of HFD was 21.8%. The mode of delivery was: spontaneous delivery in 52 cases, induced labour in 19 cases, vacuum extraction in 6 cases and caesarean section in 59 cases (including emergency caesarean section in 22 cases). Table 1 shows the patient characteristics. Prepregnancy BMI in type 2 diabetes was significantly higher (P < 0.001) than those in type 1 diabetes. GA in type 1 diabetes was significantly higher (P = 0.001) than those in type 2 diabetes, whereas HbA1c did not differ in both groups. Birth weight in type 1 diabetes was also higher (P = 0.012) than those in type 2 diabetes, although it was in the reference range.
Changes in glycaemic control markers at treatment in pregnant women with diabetes (study 2) (including comparison with normal glucose tolerant pregnant women in study 1)
Changes in blood glucose and glycaemic control markers of the pregnant women with diabetes under the antidiabetic therapy (study 2) were compared with the reference interval of the pregnant women with normal glucose intolerance (study 1). RPG decreased linearly and fell within the reference interval for normal pregnant women at 36 weeks. On the other hand, HbA1c decreased linearly to mid-pregnancy, and then, increased in late pregnancy, and was out of the reference interval. However, GA, decreased same manner with RPG and was within the reference interval (Figure 1). 12
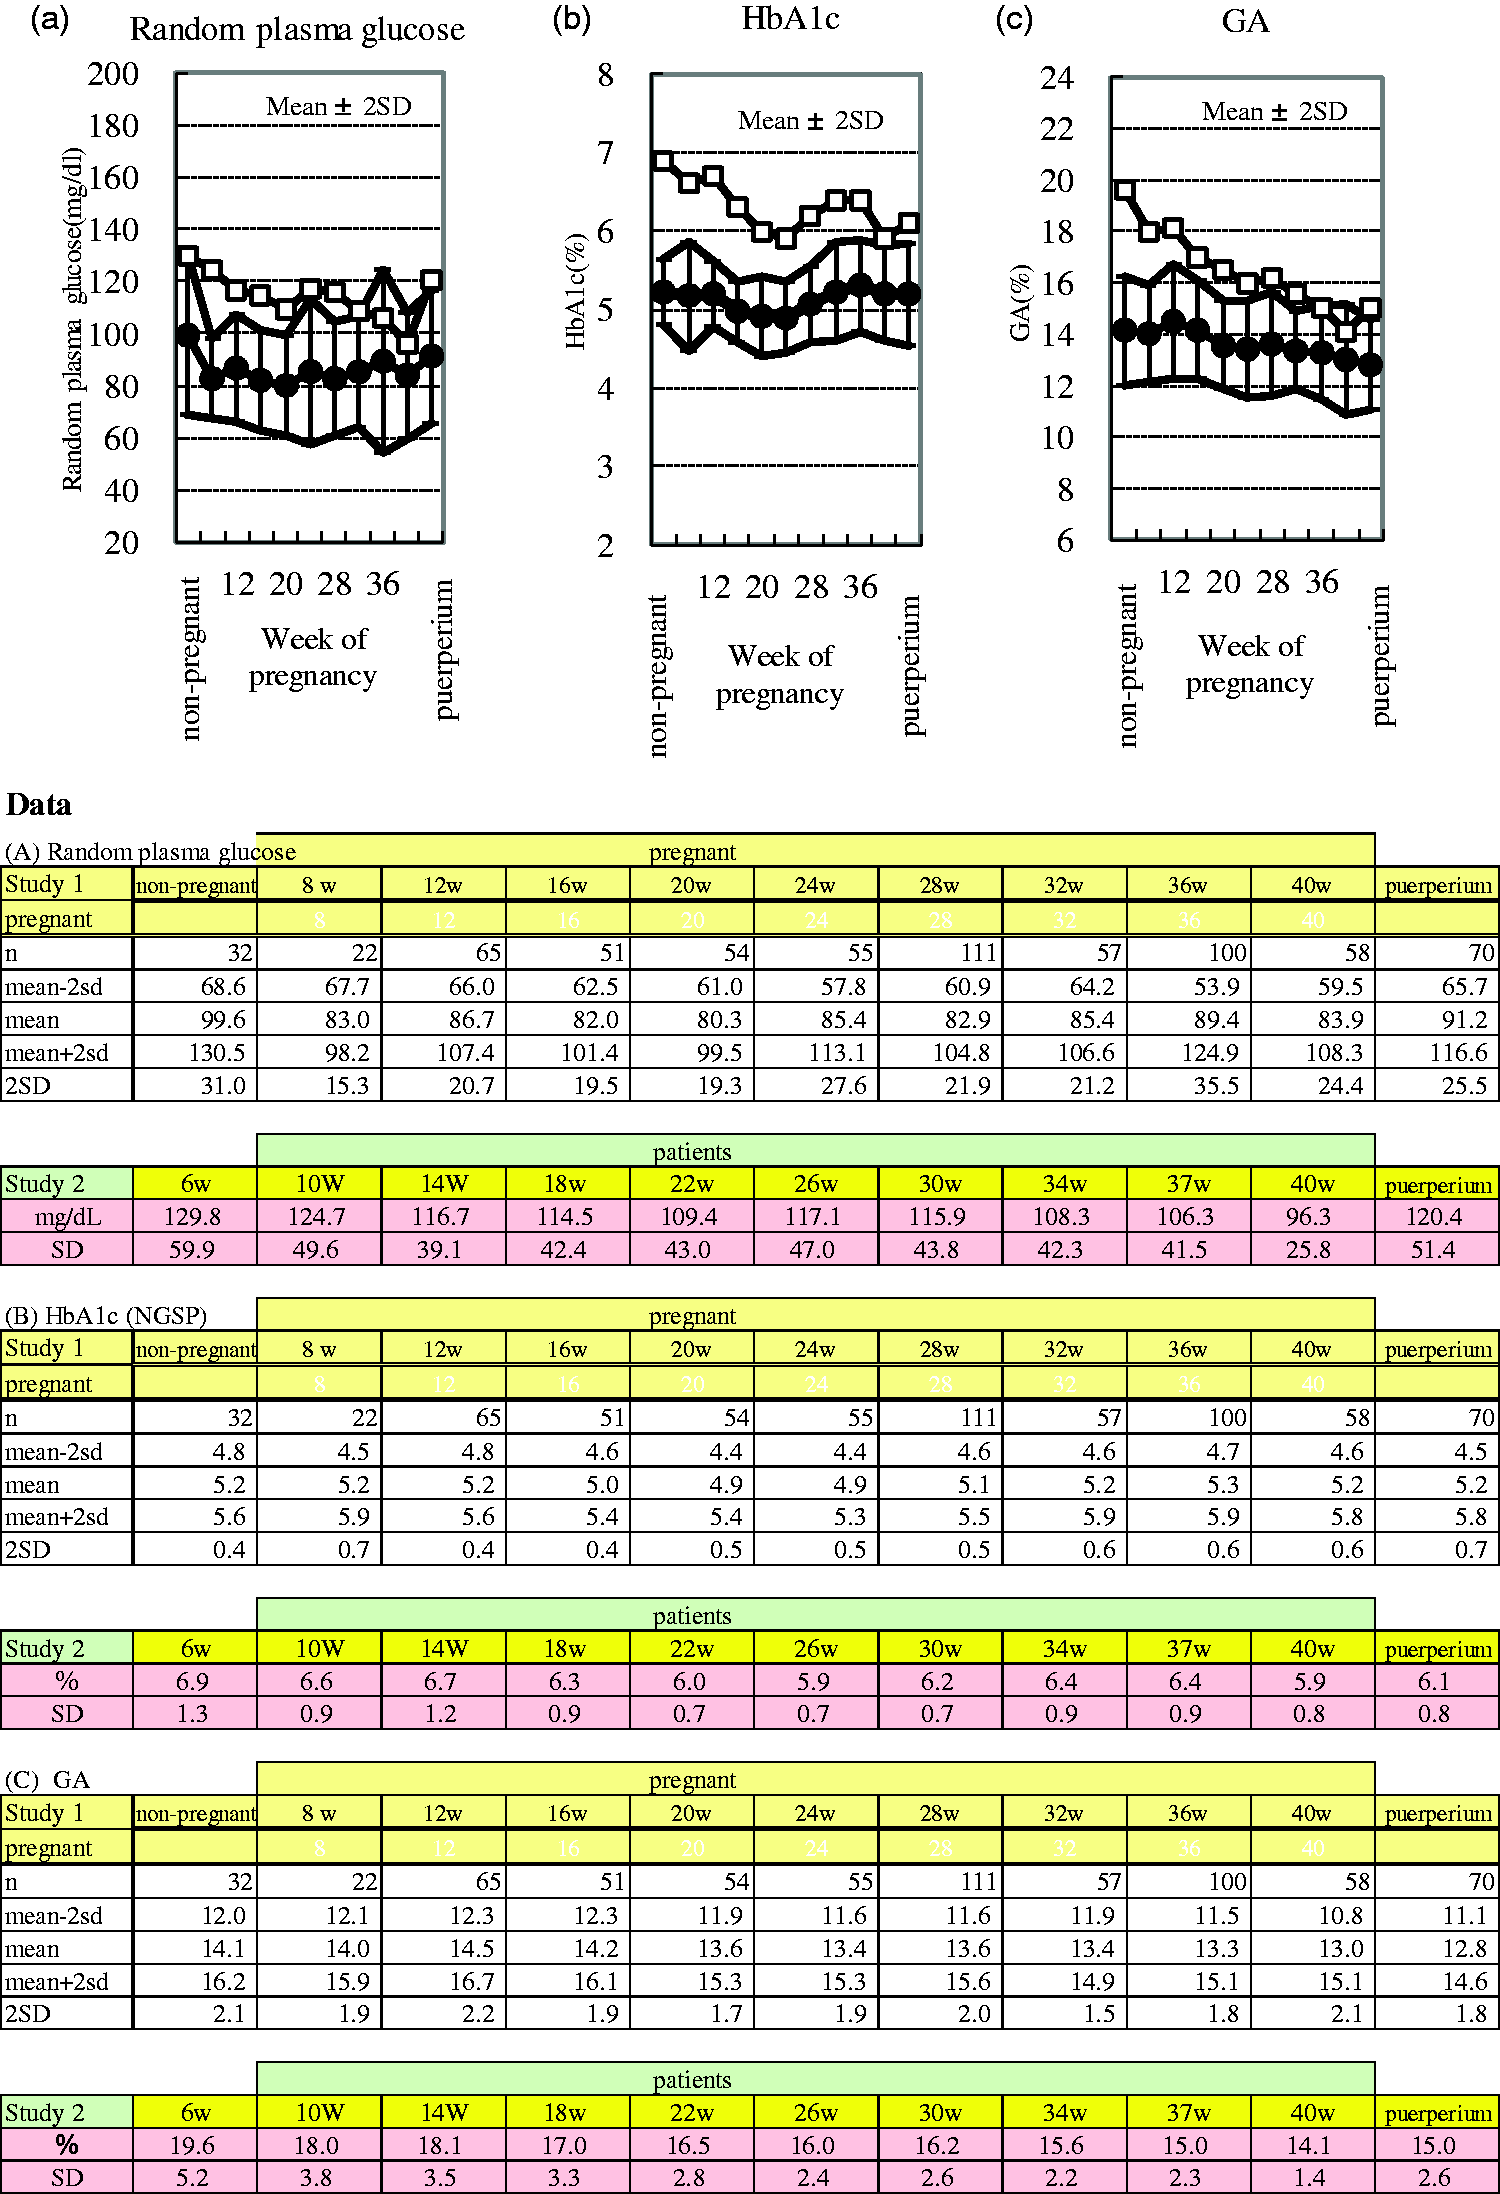
Changes in the indices of glycaemic control among pregnant women with diabetes resulting from treatment and reference intervals in normal pregnant women. (a) Weeks of pregnancy and random plasma glucose concentrations. (b) Weeks of pregnancy and HbA1c concentrations. (c) Weeks of pregnancy and GA concentrations. -□- represents the mean value in diabetic pregnant women; -•- represents the mean value in normal pregnant women.
Relationship between the incidence of neonatal complications and RPG, HbA1c and GA concentrations
The upper limits of the reference intervals in pregnant women with normal glucose tolerance are identified as in study 1. 12 This means they met all of the following assessment criteria; fasting plasma glucose levels <92 mg/dL, 1-h plasma glucose level <180 mg/dL, and 2-h plasma glucose level <153 mg/dL in 75 g oral glucose tolerance test. HbA1c (5.8%) and GA (15.8%) were set as thresholds and the patients were divided into two groups: the patients’ glycaemic controls were within or out of the reference range. We examined the relationships between the incidence of neonatal complications and HbA1c and GA concentrations in late pregnancy (29–40 weeks). The minimum and maximum values of HbA1c in late pregnancy (29–40 weeks) were 4.9% and 8.7% in type 1 diabetic women, 5.0% and 10.2% in type 2 diabetic women, respectively.
Since the average of RPG before pregnancy in all cases was 112.9 mg/dL, first the frequency of neonatal complications was compared between less than 110 mg/dL and/or more. The frequency of neonatal complications of the RPG ⩾ 110 mg/dL group did not differ to those of RPG <110 mg/dL group (neonatal hypoglycaemia [P = 0.126], hyper-bilirubinaemia [P = 0.483], electrolyte abnormality [P = 0.866], polycythaemia [P = 0.198], respiratory disorder [P = 0.955] and HFD [P = 0.687]) (Figure 2(a)).
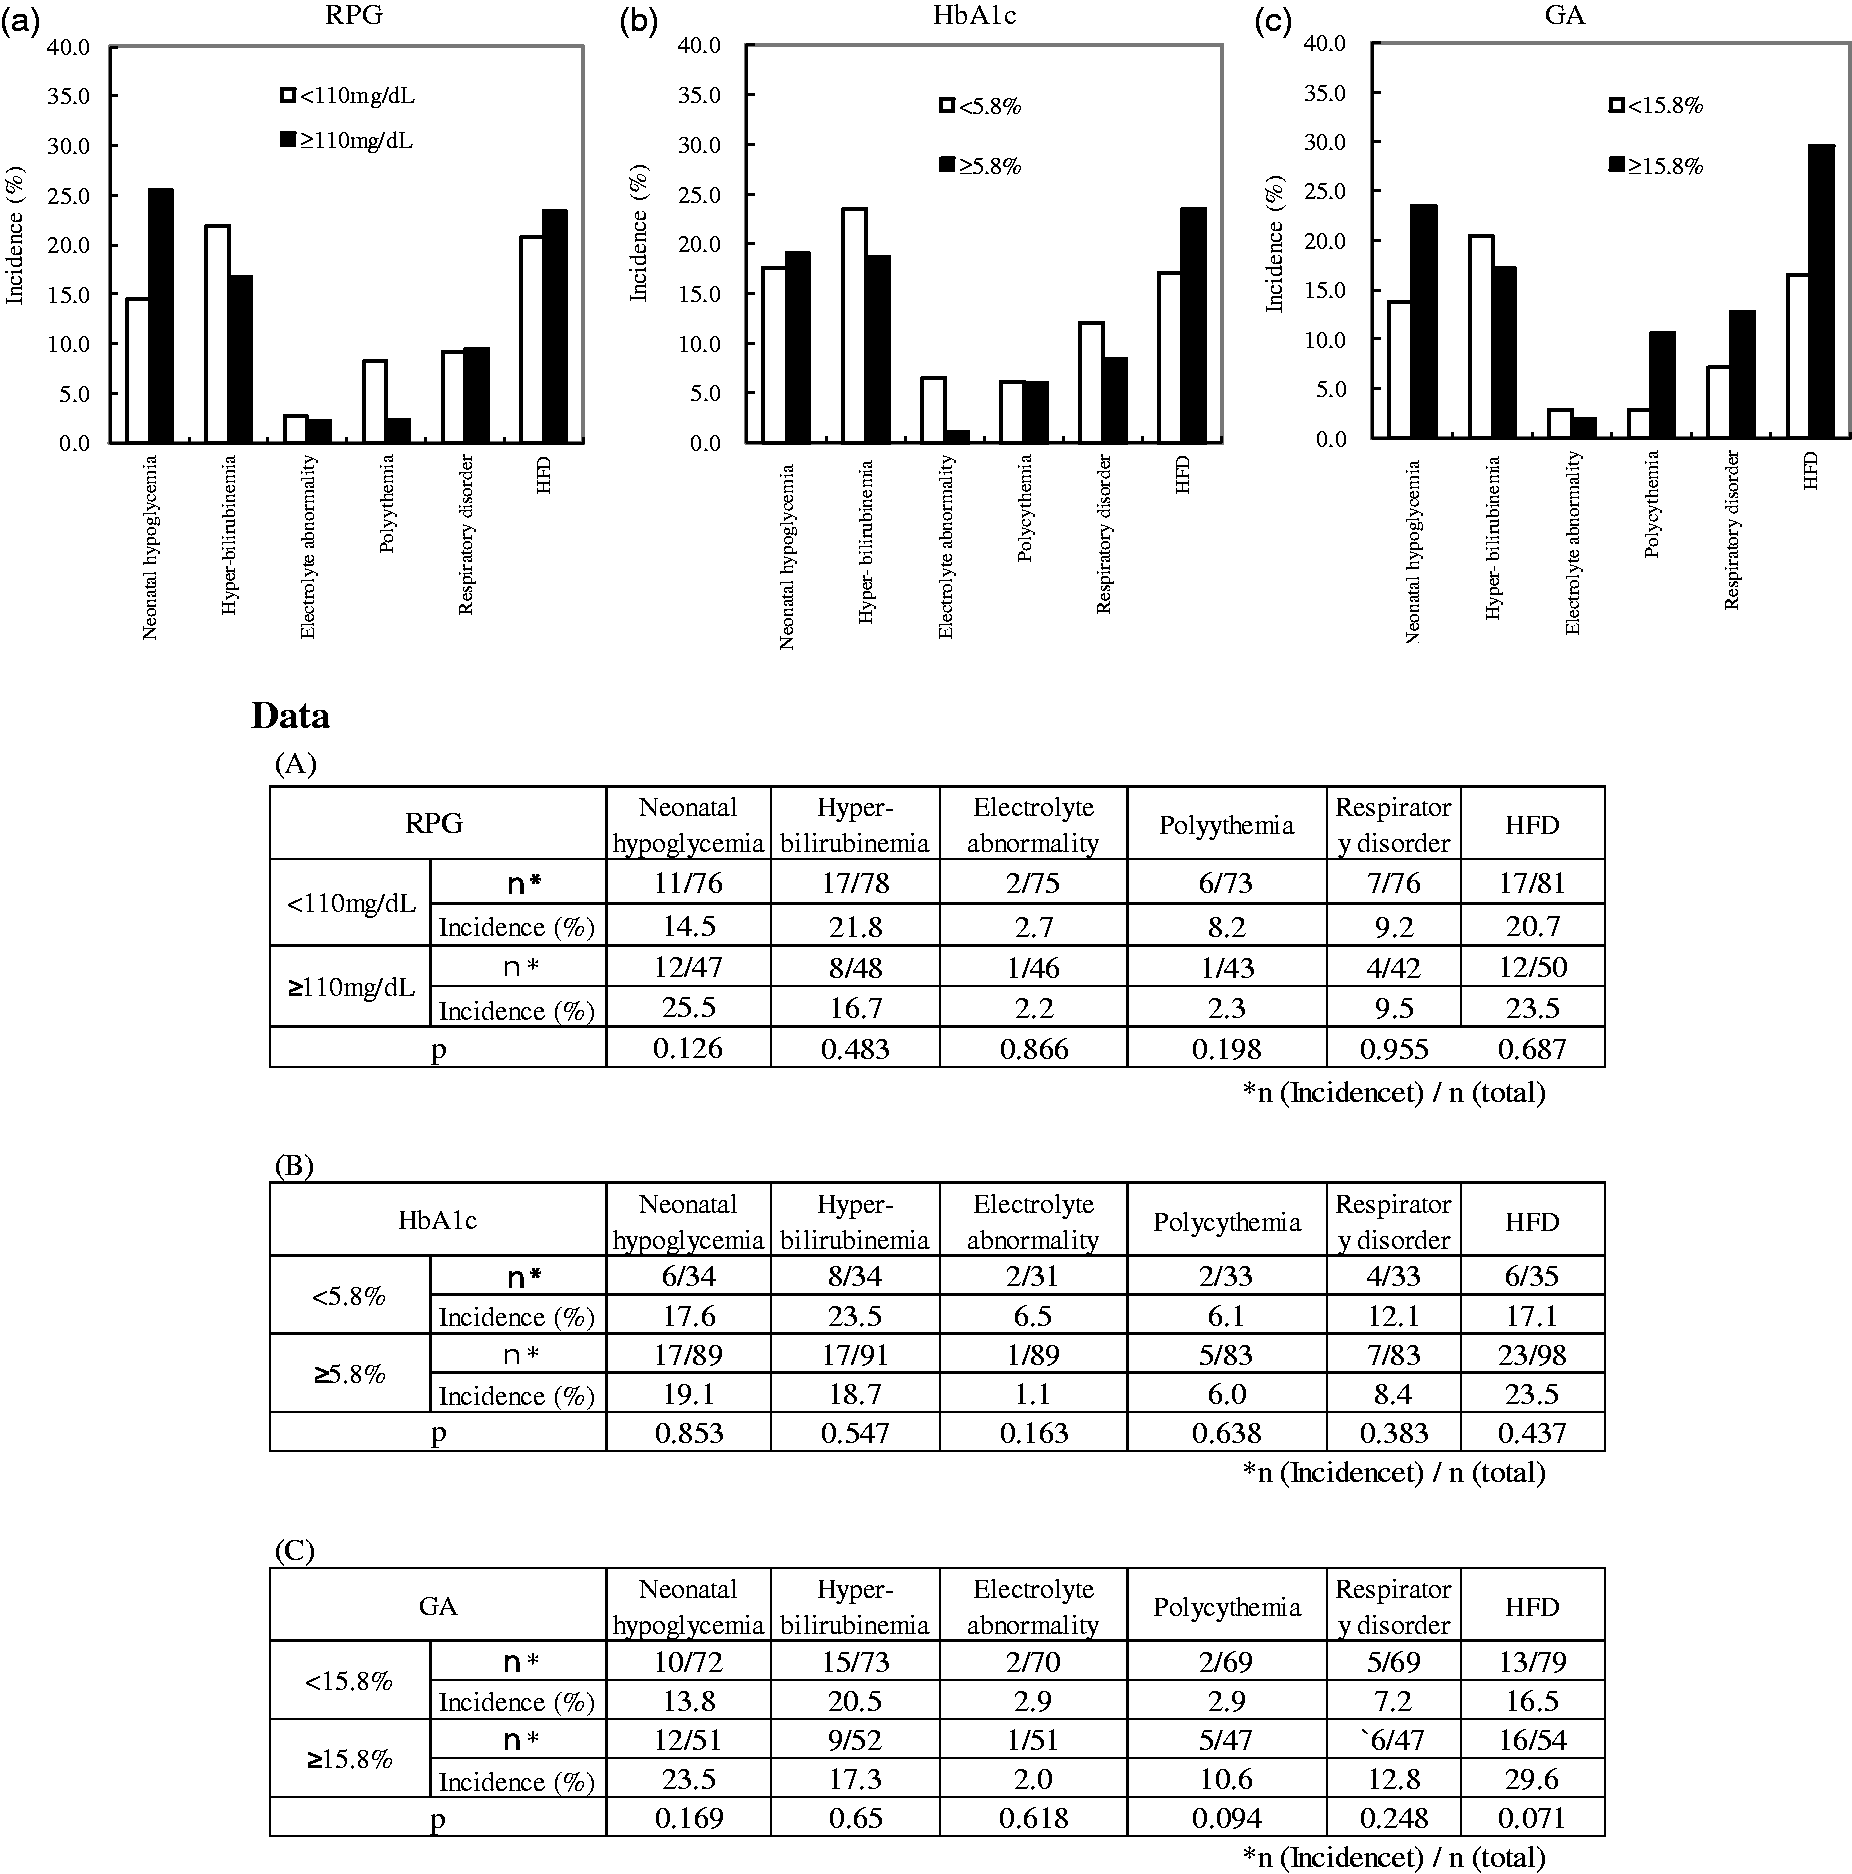
Random plasma glucose (RPG), HbA1c and GA concentrations in late pregnancy and the incidence of neonatal complications. (a) The incidence of neonatal complications and random plasma glucose concentration. n = 136 (type 1 diabetes, n = 47; type 2 diabetes, n = 89) □ RPG<110 mg/dL (control group); ▪ RPG⩾110 mg/dL. (b) The incidence of neonatal complications and HbA1c concentration. □ HbA1c<5.8% (control group); ▪ HbA1c⩾5.8%. (c) The incidence of neonatal complications and GA concentrations; □ GA<15.8% (control group); ▪ GA⩾15.8%.
The frequency of neonatal complications of the HbA1c ⩾ 5.8% group did not show significant differences when compared with those of HbA1c < 5.8% group (neonatal hypoglycaemia [P = 0.853], hyper-bilirubinaemia [P = 0.547], electrolyte abnormality [P = 0.163], polycythaemia [P = 0.638], respiratory disorder [P = 0.383] and HFD [P = 0.437]) (Figure 2(b)).
The frequency of neonatal complications of GA⩾15.8% group showed a higher trend when compared with those of GA < 15.8 group (polycythaemia [P = 0.094] and HFD [P = 0.071]). But the frequency of group of GA⩾15.8% did not show significant differences (neonatal hypoglycaemia [P = 0.169], hyper-bilirubinaemia [P = 0.650], electrolyte abnormality [P = 0.618] and respiratory disorder [P = 0.248]) (Figure 2(c)). For both HbA1c and GA, no significant differences were observed in the mode of delivery (spontaneous delivery, caesarean section, emergency caesarean section, induced labour and vacuum extraction). RPG showed no relationship with the incidence of neonatal complications.
Comparison by the type of diabetes
The incidence ratio (%) of respiratory disorder in type 1 diabetes was significantly higher than that of type 2 diabetes (17.5% vs. 5.3%; P < 0.05) (Figure 3). The incidence ratio (%) of neonatal hypoglycaemia (27.5% vs. 13.3%; P = 0.053), hyperbilirubinaemia (28.6% vs. 14.5%; P = 0.059) and HFD (30.4% vs. 17.2%; P = 0.080) also higher trend in type 1 diabetes than type 2 diabetes.
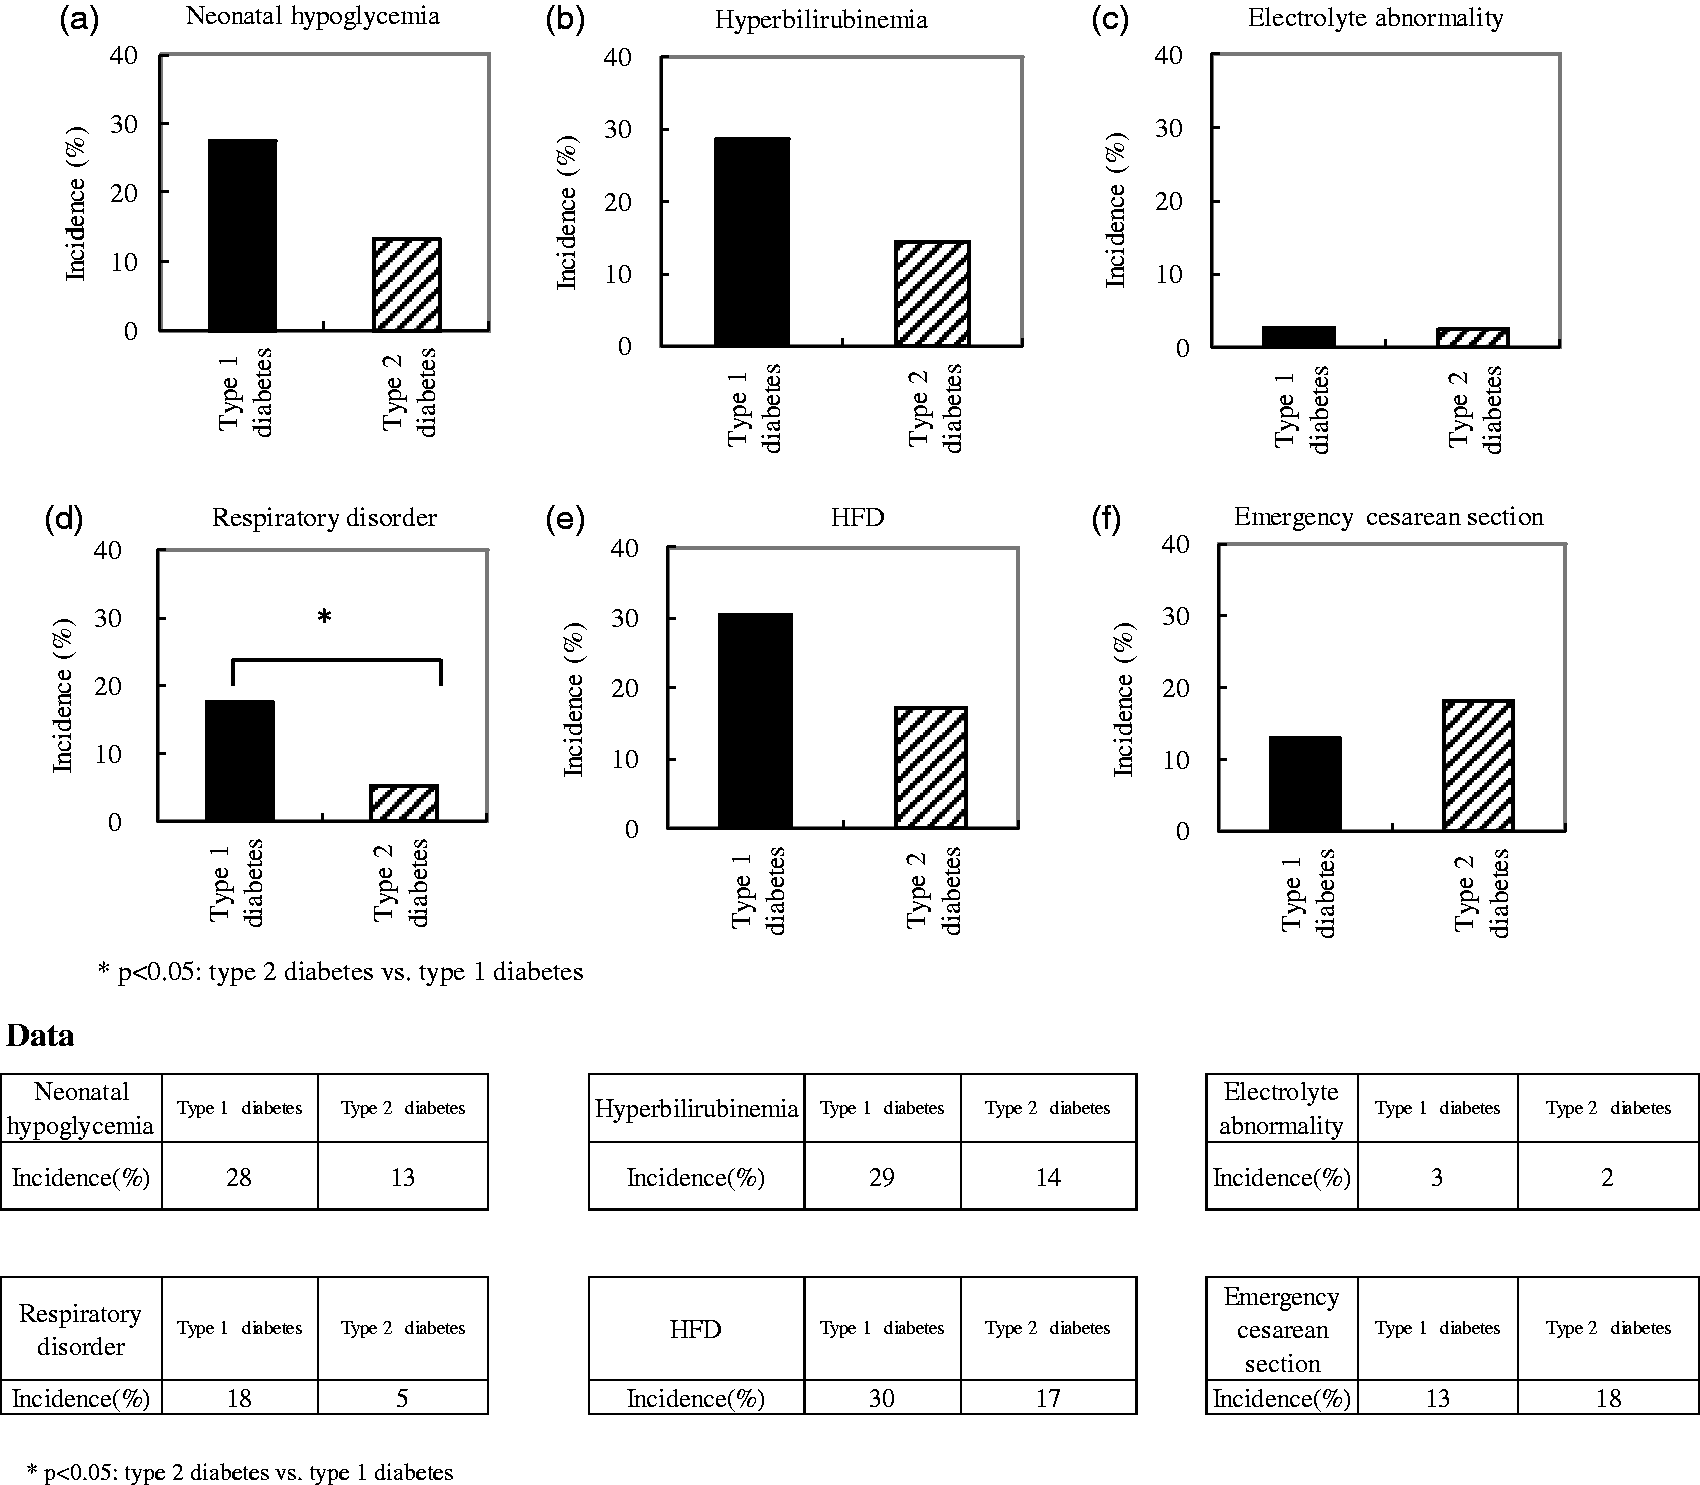
Comparison of the incidence of neonatal complications by diabetic type. The respective diabetic types and the incidence of neonatal complications are shown. (a) Hypoglycaemia; (b) hyperbilirubinaemia; (c) electrolyte abnormalities; (d) respiratory disorder; (e) HFD; (f) emergency caesarean section.
Discussion
Changes in glycaemic indices during treatment of diabetes
In the present study (136 pregnant women with type 1 diabetes and type 2 diabetes), RPG decreased linearly, and in late pregnancy at 36 weeks, RPG was within reference interval. GA concentrations also decreased same manner and was within the reference interval at 37 weeks. In another study of pregnant diabetic women, Fujiwara et al. reported a similar trend in GA concentrations. 17 On the other hand, HbA1c concentrations, similar to changes of HbA1c in normal pregnant women, decreased in mid-pregnancy, and then tended to increase in late pregnancy. Phelps et al. 18 also reported such biphasic changes in HbA1c concentrations, with the lowest values in mid-pregnancy. In addition, Worth et al. 19 also reported a biphasic pattern in HbA1c concentrations. The increase of HbA1c concentrations in late pregnancy may be explained by prolonged metabolism of haemoglobin due to anaemia, which occurs due to haemodilution seen in pregnancy. Alternatively, Hashimoto et al. reported that the increase of HbA1c concentrations in late pregnancy was related to an iron deficiency.8,9 Therefore, GA reflects the recent glycaemic control status more sensitively than HbA1c. 20 This means that it is easier to use clinically better to glycaemic control using GA as an index than HbA1c.
Relationships between GA and HbA1c and neonatal outcome
To reduce the risk of maternal and neonatal complications in pregnancy, it is well known that the target of glycaemic control in pregnant women with diabetes must be maintained as close as possible to reference concentrations. Jovanovic et al. reported that normalization of maternal glucose concentrations reduces the neonatal mortality rate. 21
In this study, thresholds for HbA1c (5.8%) and GA (15.8%) were set at the upper limits of the reference intervals for normal pregnant women. 10 The frequency of the neonatal complications in the HbA1c ⩾ 5.8% group did not show significant differences when compared with those of the HbA1c < 5.8% group. On the other hand, the frequency of neonatal complications in the GA⩾15.8% group also did not show significant differences when compared with the GA < 15.8% group, but higher tendency of the neonatal complications was observed in the incidence of polycythaemia (P = 0.094) and HFD (P = 0.071). RPG showed no relationship with the incidence of neonatal complications. We speculate that the reasons why GA ⩾ 15.8% group did not show the significant difference compared with the GA < 15.8% group in some neonatal complications were as follows: (1) the small total number of cases, (2) the small number of neonatal complications due to the institutions which participated in this study were specialized hospital with adequate medical treatment. A multicentre, prospective study with large number of patients is necessary to confirm our results.
Arumugam et al. reported that in pregnant women with overt diabetes and GDM, HbA1c concentration in late pregnancy (36–38 weeks) was a good predictor of neonatal hypoglycaemia. The threshold for HbA1c at that time was 6.8%. 22 In a similar study, Kline et al. reported that control the HbA1c less than 6.5% in third trimester was important to prevent the foetal hyperinsulinaemia. 23
In the present study, thresholds for HbA1c (5.8%) and GA (15.8%) were set as the upper limits of the reference intervals in normal pregnant women from a preventive point of view. However, these thresholds should be refined by clinical studies with a larger number of cases.
Comparison by the type of diabetes
In our comparison based on the type of diabetes, the incidence ratio (%) of respiratory disorder in type 1 diabetes was significantly higher (P = 0.038) than those in type 2 diabetes, and in neonatal hypoglycaemia (P = 0.053), hyperbilirubinaemia (P = 0.059), and HFD (P = 0.080) in type 1 diabetes were higher, but not significant in those of type 2 diabetes. Recently, a relationship between GA and glycaemic excursions has been reported.24–26 The glycaemic excursions may be affected due to the difference of incidence ratio between the type 1 and type 2 diabetes. In pregnant women with type 1 diabetes, strict glycaemic control is needed when compared to type 2 diabetes.
In the present study, since HbA1c did not follow the change of blood glucose in the late pregnancy, GA would be a better glycaemic control marker for the pregnant women with diabetes. GA, like HbA1c, is expressed as a glycated albumin percentage of total albumin, and hence it is not affected by albumin concentration. However, since the GA concentration would be affected by the change of albumin metabolism, GA value would not be correct. Therefore, in such cases, caution is needed. Furthermore, GA is affected by obesity. Therefore, GA tends to be lower in the late pregnancy. In addition, hyper-obese pregnant women also have difficulties in becoming glycaemic control index. Compared with HbA1c, GA reflects the recent glycaemic control status more sensitively and was not related to an iron deficiency. Therefore, it is desirable not to use one index as glycaemic index but to comprehensively judge from HbA1c, GA and RPG during pregnancy.
In conclusion, for the treatment of pregnant women with diabetes, GA reflected blood glucose changes tended to be better than HbA1c. The incidence of neonatal complications showed the higher tendency GA ⩾ 15.8% group. For the treatment of pregnant women with diabetes, GA would be a better marker than HbA1c. However, GA is also affected by obesity and albumin, it is desirable to make comprehensive judgment with HbA1c, RPG and other glycaemic indexes.
Footnotes
Acknowledgements
We wish to express our thanks to the researchers at the 17 participating institutions for their contributions to the present study. The members of JGA (Japan Glycated Albumin) study Group: N. Suzuki, Y. Omori (Ebina General Hospital); I. Shimizu (The Sakakibara Heart Institute of Okayama); M. Kamitomo, K. Maruko (Kagoshima City Hospital); T. Kohama (Kan’etsu Chûô Hospital); T. Moriya (Kitasato University Hospital); T. Sugiyama (Mie University Hospital); N. Arata (National Center for Child Health and Development); D. Yamamoto (National Hospital Organization Fukuyama Medical Center); Y. Masumoto, Y. Hiramatsu (Okayama University Hospital); M. Waguri (Osaka Medical Center and Research Institute for Maternal and Child Health); S. Anazawa (Tokyo Saiseikai Central Hospital); M. Honda (Shiseikai Daini Hospital); T. Adachi, M. Nakabayashi (Aiiku Maternal & Child Health Center, Aiiku Hospital); T. Nohira (Tokyo Medical University Hachioji Medical Center); K. Nakamura (Tokyo Metropolitan Ohtsuka Hospital); M. Sanaka (Tokyo Women’s Medical University Hospital); T. Katayama (St. Mary's Hospital).
Declaration of conflicting interests
The author(s) declared no potential conflicts of interest with respect to the research, authorship, and/or publication of this article.
Funding
The author(s) received no financial support for the research, authorship, and/or publication of this article.
Ethical approval
The study was approved by Ehime Prefectural Central Hospital Ethics Committee (070821).
Guarantor
IS.
Contributorship
IS wrote the manuscript, researched the data, contributed to the discussion and reviewed/edited the manuscript. YH contributed to and reviewed the discussion. YO also contributed to and reviewed the discussion. MN contributed to the discussion and reviewed/edited the manuscript.