
Abstract
Background
Glycated proteins, such as glycated haemoglobin (HbA1c) and glycated albumin (GA%), are increasingly being used for glycaemic control assessment and the diagnosis of diabetes mellitus. GA% is an intermediate marker of glycaemic control that is not influenced by factors that affect HbA1c concentrations. The aim of this study was to determine reference intervals and assess confounding factors for glycated albumin in a well-characterized healthy population in South Africa.
Methods
We measured glycated albumin using an enzymatic method on stored serum samples of healthy individuals recruited in Cape Town, South Africa. Reference intervals (overall and specific for age, sex and ethnicity) were determined using non-parametric methods and confounding factors were assessed using multiple regression analysis.
Results
The reference interval (2.5th to 97.5th percentile) for glycated albumin of 663 healthy individuals (mean age, 34 years, 38.6% males) ranged from 10.7 to 15.2%. Sex, body mass index categories and ethnicity were significantly associated with the glycated albumin and were considered of practical importance because their standardized regression coefficients (Beta) were greater than a cut-off of 0.15, implying a stronger effect on glycated albumin (P < 0.001). The glycated albumin reference intervals for subjects with body mass index <25 kg/m2 was 11.2–15.3%, for body mass index 25–30 kg/m2 it was 10.5–14.9% and 10.0–14.6% for body mass index >30 kg/m2 (P = 0.0001).
Conclusions
The overall reference interval showed good correlation with reference intervals determined in other studies. However, sex, ethnicity and body mass index were statistically significant confounding factors that may influence the overall reference interval. Therefore, overall glycated albumin reference intervals should be used cautiously.
Introduction
Diabetes mellitus is a worldwide pandemic and places an immense burden on economies and health-care systems worldwide. According to recent estimations, 424.9 million people between 20 and 79 years of age are living with diabetes and this number is expected to rise to 628.6 million by the year 2045. 1 Globally, it is estimated that up to half of patients with diabetes remain undiagnosed. 1 In Africa, approximately 77% all diabetes-related deaths occurred in patients below 60 years of age. 1 This high prevalence may be the consequence of diabetes complications due to late diagnosis and poor control. 2
Most diagnostic criteria for diabetes utilize glucose-based parameters, which are subject to wide intraindividual variability, are inconvenient for the patient as a fasting sample is required and are also influenced by other factors such as stress, medication and concurrent illness. 3 Ideally, the focus for diabetes diagnosis should shift to non-fasting parameters, including glycated proteins, and clinical decision limits should be determined by correlating these markers with clinical complications.
Glycated haemoglobin (HbA1c) is a glycated protein and was recommended by the American Diabetes Association (ADA) as one of the diagnostic criteria of diabetes in 2009 and was also endorsed by the World Health Organization (WHO) in 2011.4,5 Using HbA1c for the diagnosis and follow-up of diabetes has limitations in patients with conditions that affect red blood cell turnover, such as haemoglobinopathies, iron deficiency and haemolytic anaemias. 6 HbA1c also differs in various racial groups, and numerous studies have found that the recommended cut-off of 6.5% may not be useful in some populations.7–11
Glycated albumin (GA) is an alternative glycated protein being investigated for use in diagnosis and follow-up of diabetes. GA is the glycation product of albumin and an intermediate marker of glycaemic control, which allows for quick treatment follow-up in diabetics. Albumin has a half-life of two to three weeks, and therefore GA gives an estimate of glucose control for this period. 12 Additionally, GA is not influenced by many of the factors that affect HbA1c concentrations and may be an ideal marker of glycaemic control in these situations. 13 The Japanese Red Cross Society introduced GA as a diabetes screening tool for blood donors who are at risk of developing type 2 diabetes in 2009. 14 GA has also been investigated for use in gestational diabetes and chronic kidney disease.15–18
Reference intervals (RIs) for GA have been determined in a few populations,19–24 but to our knowledge, this is the first study determining GA RIs in South Africa. It is recommended that each laboratory determine their own RIs, as geographical area and diet can influence the values. The aim of this study was to determine RIs for GA using an enzymatic method in a well-characterized healthy population.
Methods
Study population
The study subjects were identified from a database of the ‘Establishing Adult Reference Intervals for Selected Analytes in South Africa’ study. The original database consists of 1436 subjects, but only subjects who were recruited in the Cape Town area (853 subjects) had fasting plasma glucose performed and were therefore included in this study. The protocol for the multicentre RI study has been published elsewhere. 25 Subjectively healthy individuals (aged 18–85 years) were recruited from the general public, students and local hospital and laboratory staff.
Written informed consent was obtained from all subjects during the recruitment period. The Health Research Ethics Committee of Stellenbosch University, Cape Town (South Africa) approved this study (S12/05/147). This study was performed according to the Declaration of Helsinki.
Study subjects were excluded according to the exclusion criteria described elsewhere. 26 Primary exclusion criteria included known diabetes (on oral treatment or insulin), pregnancy, history of chronic kidney or chronic liver disease, biochemical evidence of severe disease, recent blood donation or severe illness and known HIV, hepatitis B or C. Secondary exclusion criteria for the current study included missing data for GA (insufficient samples) and various conditions that could potentially affect albumin metabolism or concentration: fasting plasma glucose >7 mmol/L (excluding subjects with possible diabetes), thyroid-stimulating hormone (TSH) < 0.37 mIU/L and >3.5 mIU/L (to exclude thyroid pathology), estimated glomerular filtration rate (eGFR) according to Modification of Diet in Renal Disease (MDRD) <60 mL/min/1.73 m2 (to exclude renal disease), bilirubin > 40 μmol/L, γ-glutamyl transferase (GGT) >121 U/L, alanine aminotransferase (ALT) >100 U/L (to exclude liver disease) and subjects on medication that could affect albumin metabolism. There were no subjects with an albumin below 30 g/L. These exclusion cut offs were determined based on the RIs for these analytes. Patients on oral contraceptive medication, oestrogen or thyroxine (with TSH within the RI) were not excluded according to the guidelines set by Ozarda et al. 25 in the multicentre RI study protocol. Figure 1 is a flow diagram depicting how the final study sample was determined.
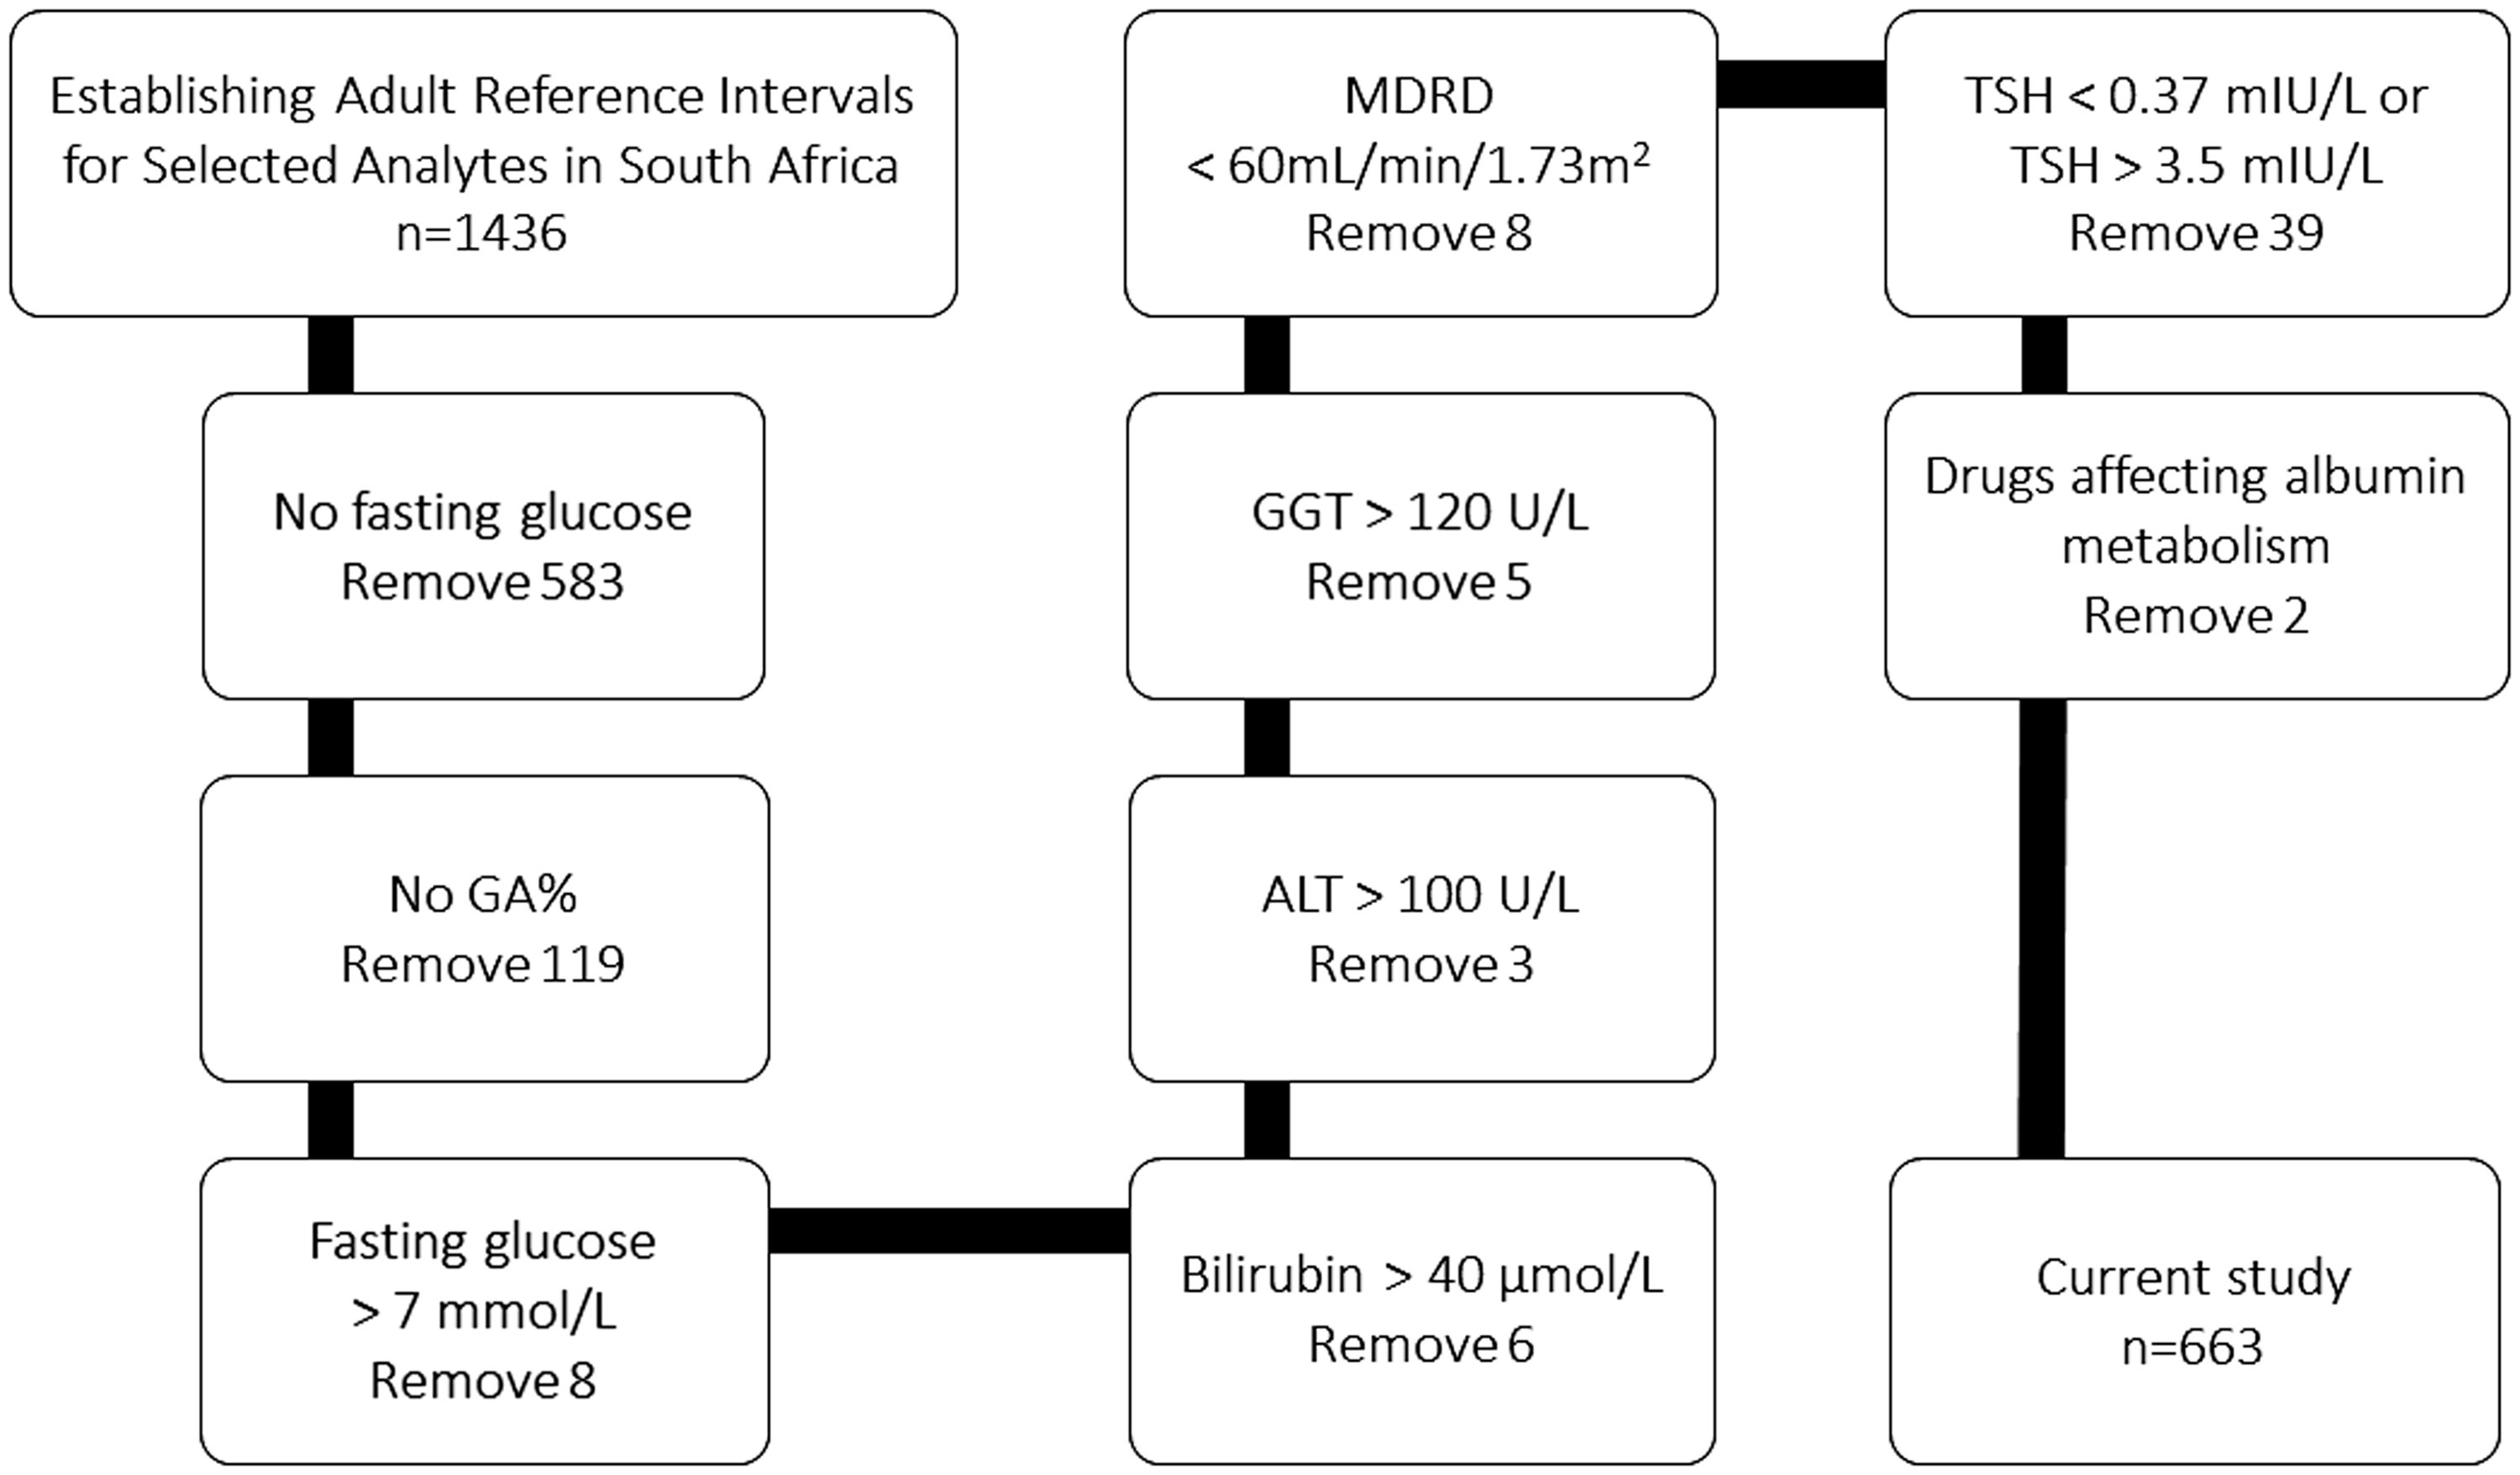
Flow diagram depicting derivation of final sample size.
Biochemical analysis
GA analysis was performed on stored serum samples that were collected between 2012 and 2015. The de-identified patient serum aliquots were immediately stored at –80°C after centrifugation. Nathan et al. 27 reported that GA is stable for up to 23 years in serum samples stored at –80°C. GA analysis was performed with an enzymatic assay from Werfen (quantILab Glycated Albumin, Milan, Italy) on the Roche cobas 6000 analyser (Roche Diagnostics, Mannheim, Germany). This method is based on the enzymatic method determined by Kouzuma et al., 28 and a detailed description of this method is available in a previous publication.
Multiple chemistry analytes including fasting plasma glucose, TSH, serum creatinine, and GGT, ALT and total bilirubin were routinely measured in an ISO 15189 pathology laboratory (PathCare Laboratories, Cape Town, South Africa).
Precision verification and bias estimation
Precision verification and bias estimation were performed for the enzymatic glycated albumin assay (Werfen) for use on a cobas 6000 analyser (Roche) according to the Clinical Laboratory Standards Institute’s (CLSI) guidelines (EP15-A3). 29 The precision and bias were determined by analysing high and low control samples that were provided by the assay manufacturer (Werfen).
Statistical analysis
Demographic and laboratory data were merged and analysed using Stata 15 (College Station, Texas, USA) and NCCS 12 statistical software (Kaysville, Utah, USA). Shapiro Wilk test was used to check data distribution normality. Wilcoxon rank-sum test was also used to see whether partition was needed between males and females. Kruskal–Wallis for categories of age and body mass index (BMI) test was also used to see whether partition was needed. RIs were calculated in accordance with CLSI guidelines (EP28-A3c) using non-parametric methods. 30 Horn’s algorithm was used for outlier detection, and all data points located outside the lower and upper boundary were further examined for inclusion or exclusion. 31 The 95% RIs were estimated using reference limits at 2.5th percentile for the lower reference limit and 97.5th percentile for the upper reference limit. A bootstrapping method (3000 samples) was used to improve precision and accuracy of reference limits. This resampling procedure also served for predicting 95% confidence intervals (CI) for the limits of the RI. Our underlying assumption was that the 2.5% and 97.5% centiles contain 95% of the distribution of normal values of the reference population. A two-sided P-value of <0.05 was considered statistically significant.
Sources of variation and multivariable analysis
The data were first analysed to establish the partitioning requirements of the four covariates, namely sex, age, ethnicity and BMI. The data were then subjected to tests for determining its suitability for parametric treatment by first transforming the GA into normal using the Box-Cox transformation. Dummy variables of sex, age groups, ethnicity and BMI categories were created and included in the linear regression model. The relative significance of each independent variable was predicted from the significance level of the regression coefficient. Independent variables were considered to have practical importance when their standardized Beta regression coefficient (which correspond to the partial correlation coefficient, |
Results
Precision verification and bias estimation
The within-assay % coefficient of variation (%CV) for GA was 2.2% at a target mean of 15.7% and 1.3% at a target mean of 37.4%. The within-laboratory %CV was 2.3% at a target mean of 15.7% and 1.4% at a target mean of 37.4%. The total error observed for high and low concentration control samples were 4.72% and 2.62%, respectively. The performance of the method was acceptable for the study.
Demographics and characteristics of subjects
The characteristics of the subjects are described in Table 1. Of the 663 adults included in the study, 427 (64.5%) were in the age category 18–38 years. The median age of the study subjects was 29.5 years. There were 407 (61.4%) females and 256 (38.6%) males. More than 50% of the subjects were Caucasian, 31.1% were Mixed-Ancestry and 11.6% were Black Africans. Only 12% of the subjects had BMIs greater than 30 kg/m2 and 53.5% were in the BMI category of <25 kg/m2. Five outliers were identified using Horn’s algorithm, but after inspection, it was decided not to exclude them from the analysis. The distribution of GA data is depicted in Figure 2.
Characteristics of study subjects included in GA% reference interval determination study, n = 663.
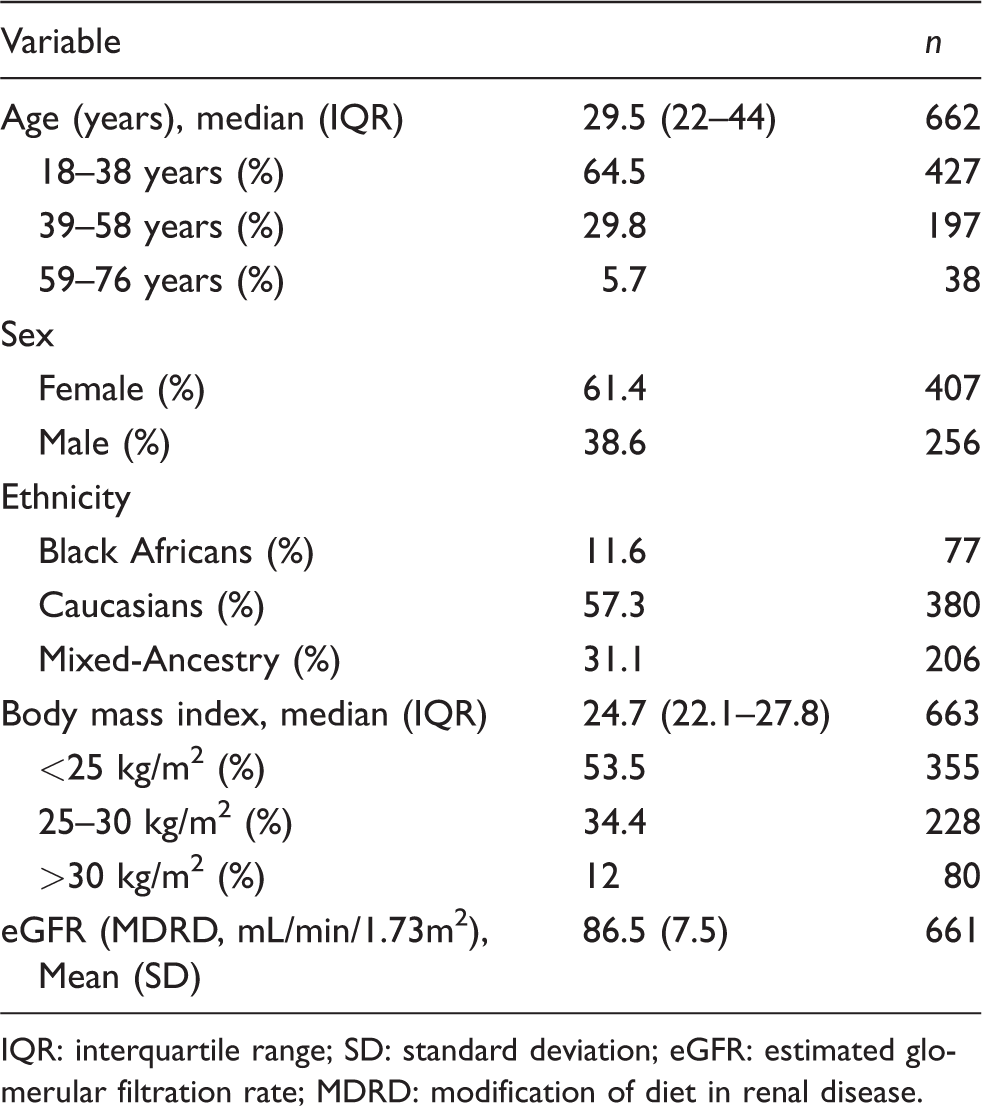
IQR: interquartile range; SD: standard deviation; eGFR: estimated glomerular filtration rate; MDRD: modification of diet in renal disease.
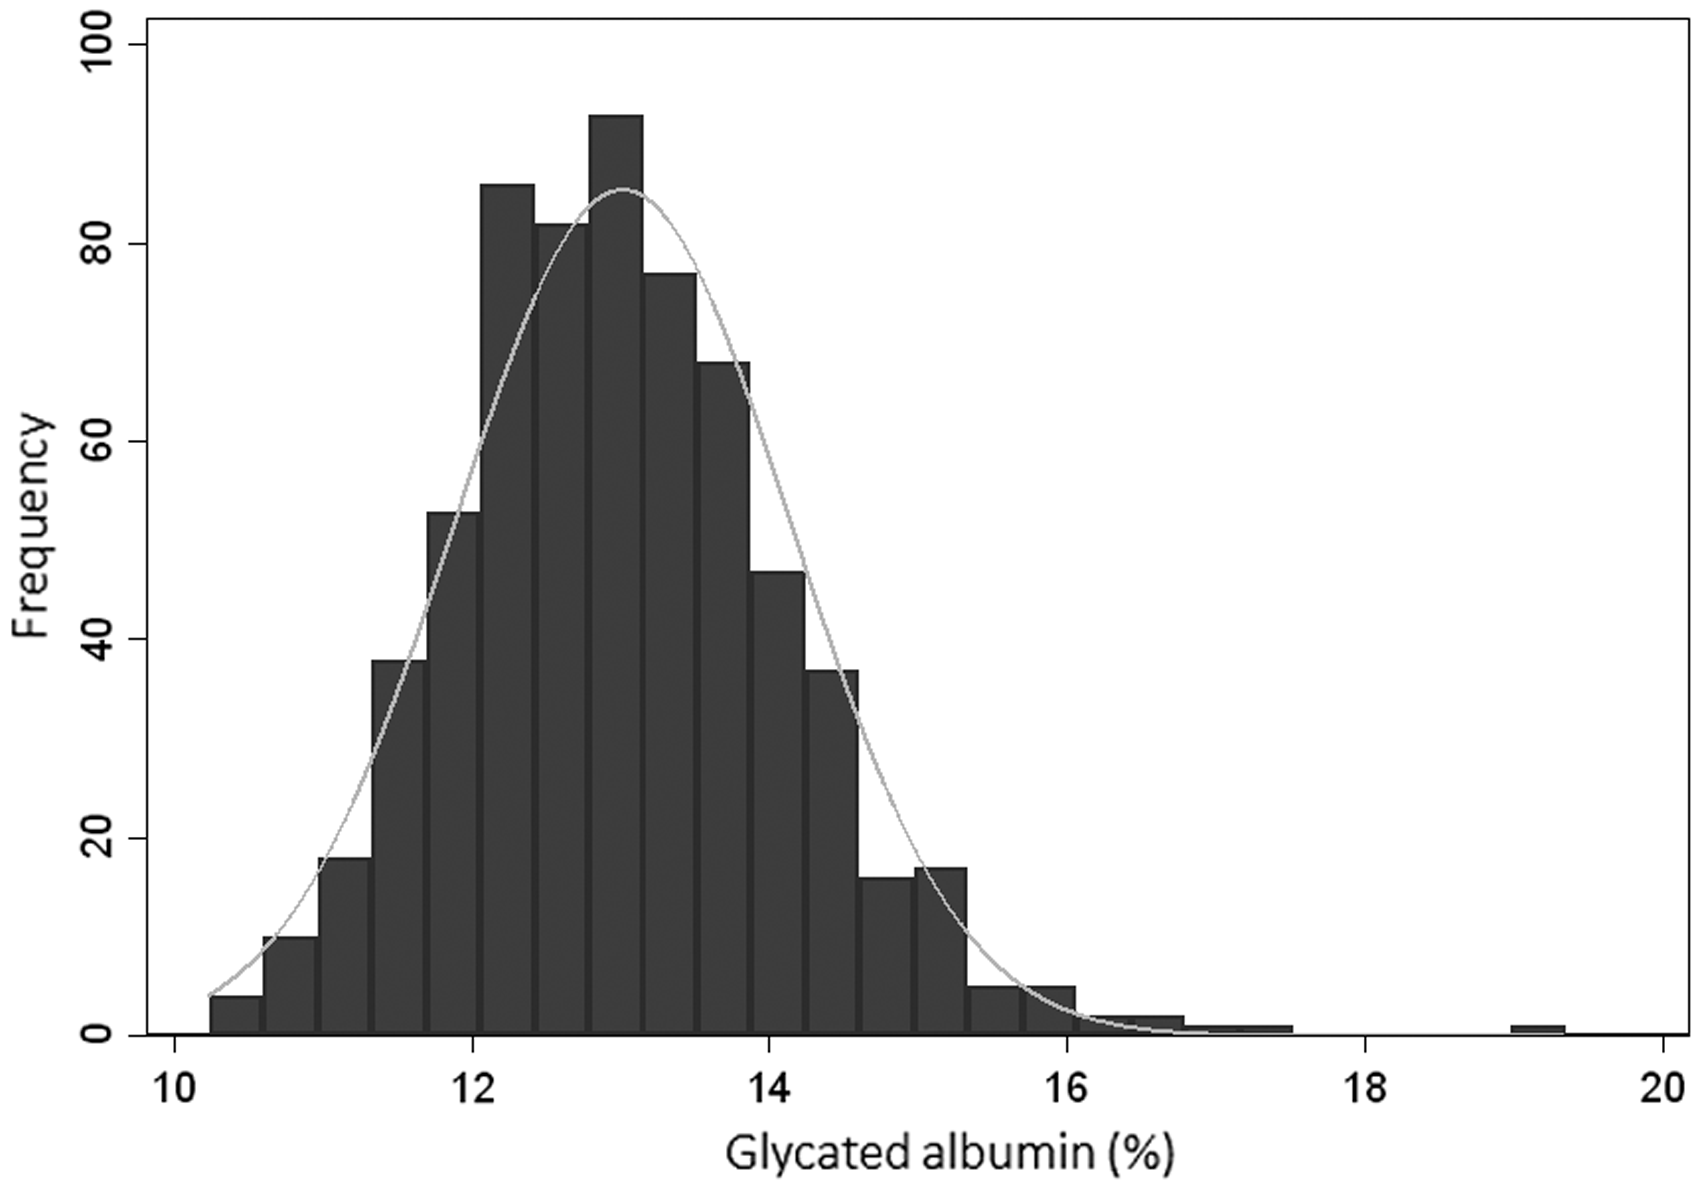
Distribution of glycated albumin.
Two-sided 95% robust reference intervals for glycated albumin (%).
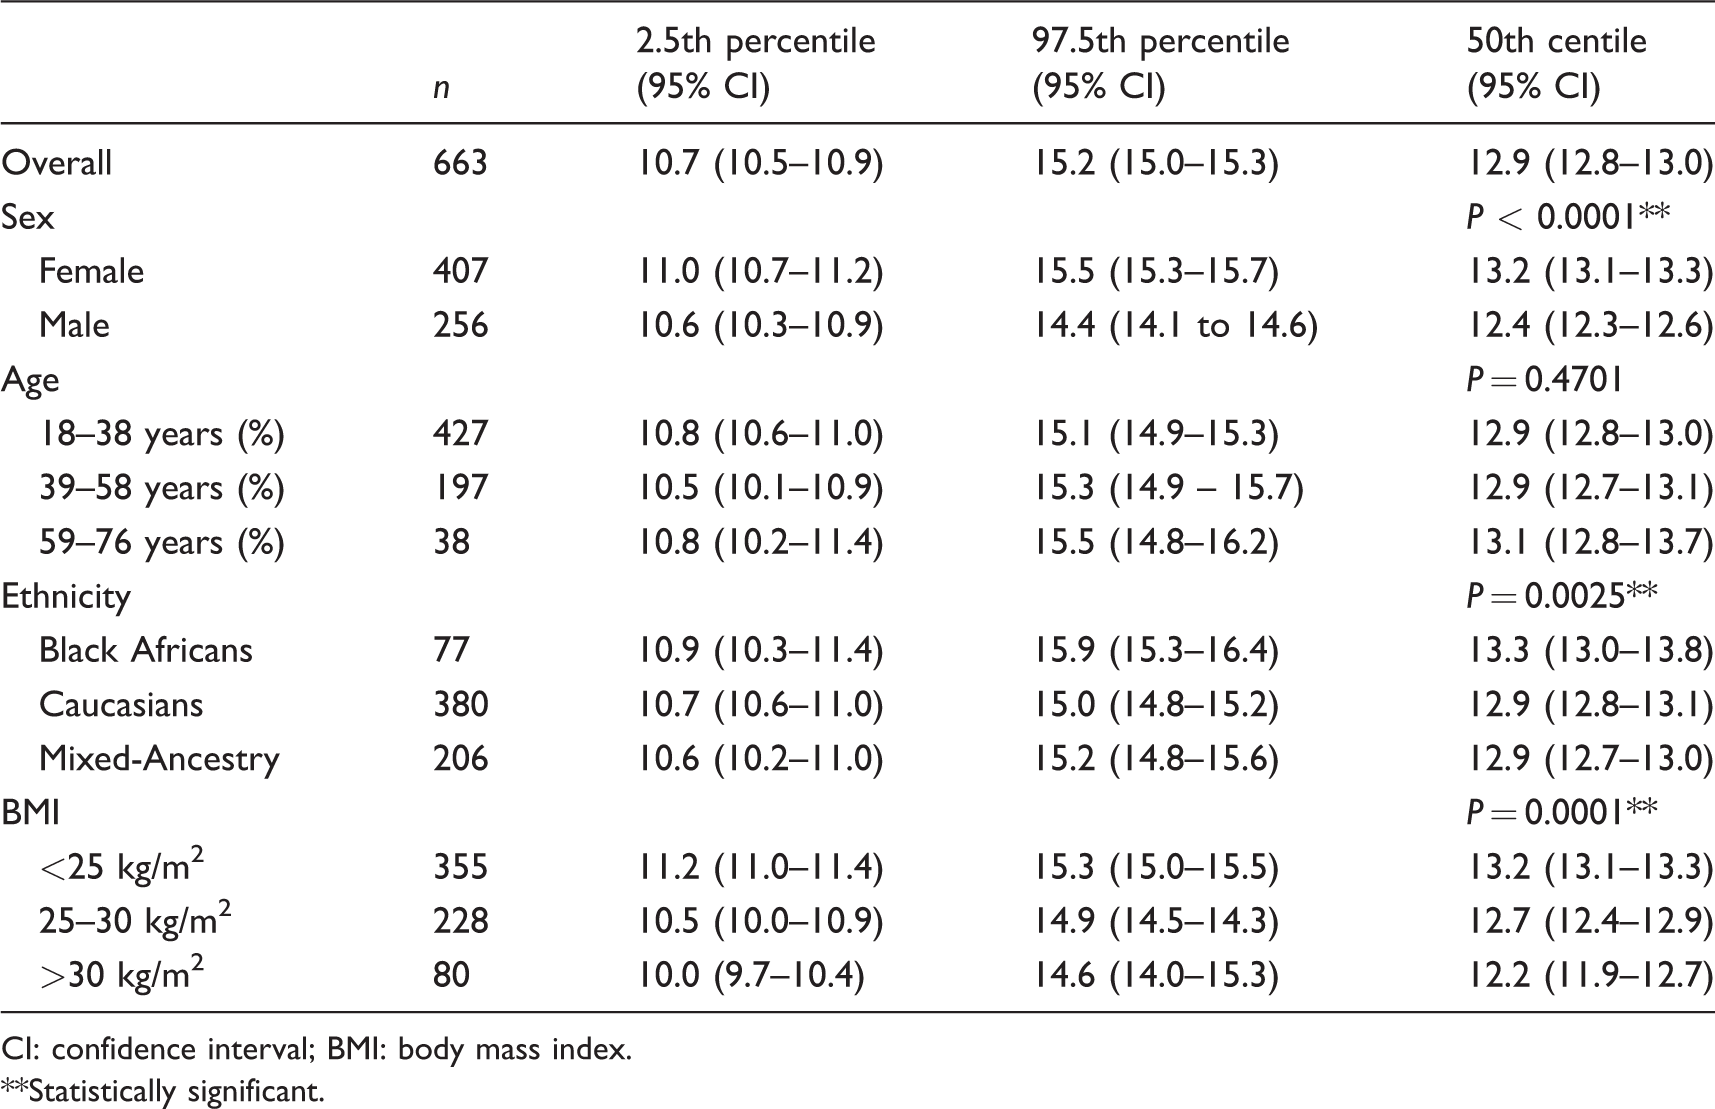
CI: confidence interval; BMI: body mass index.
**Statistically significant.
RIs
As shown in Table 2, the overall RI for 663 subjects (after exclusions) was 10.7–15.2%. Females had a higher median GA of 13.2% (95% CI 13.1–13.3) compared with 12.4% (95% CI 12.3–12.6) for males (P < 0.0001). The median GA for Black Africans was 13.3% and is higher than the medians for Caucasians and Mixed-Ancestry subjects, which were 12.9% for both these groups (P = 0.0025). A statistically significant inverse correlation was demonstrated between GA and BMI (P = 0.0001).
Sources of variation and multivariable analysis
Multiple linear regression was performed to explore the importance of sex, BMI, age and ethnicity as sources of variations as well as adjusting for confounding.
Sex, BMI categories and ethnicity were significantly associated with the GA in all the models as shown in Table 3. Sex, BMI and ethnicity were considered of practical importance because their standardized regression coefficients (Beta) were greater than a cut-off of 0.15, implying a stronger effect on GA (P < 0.001). From the magnitude of standardized beta coefficients, age-related changes were not associated with GA and were considered of lesser importance.
Association of sex, BMI, age and ethnicity on test results evaluated by the multiple regression model.
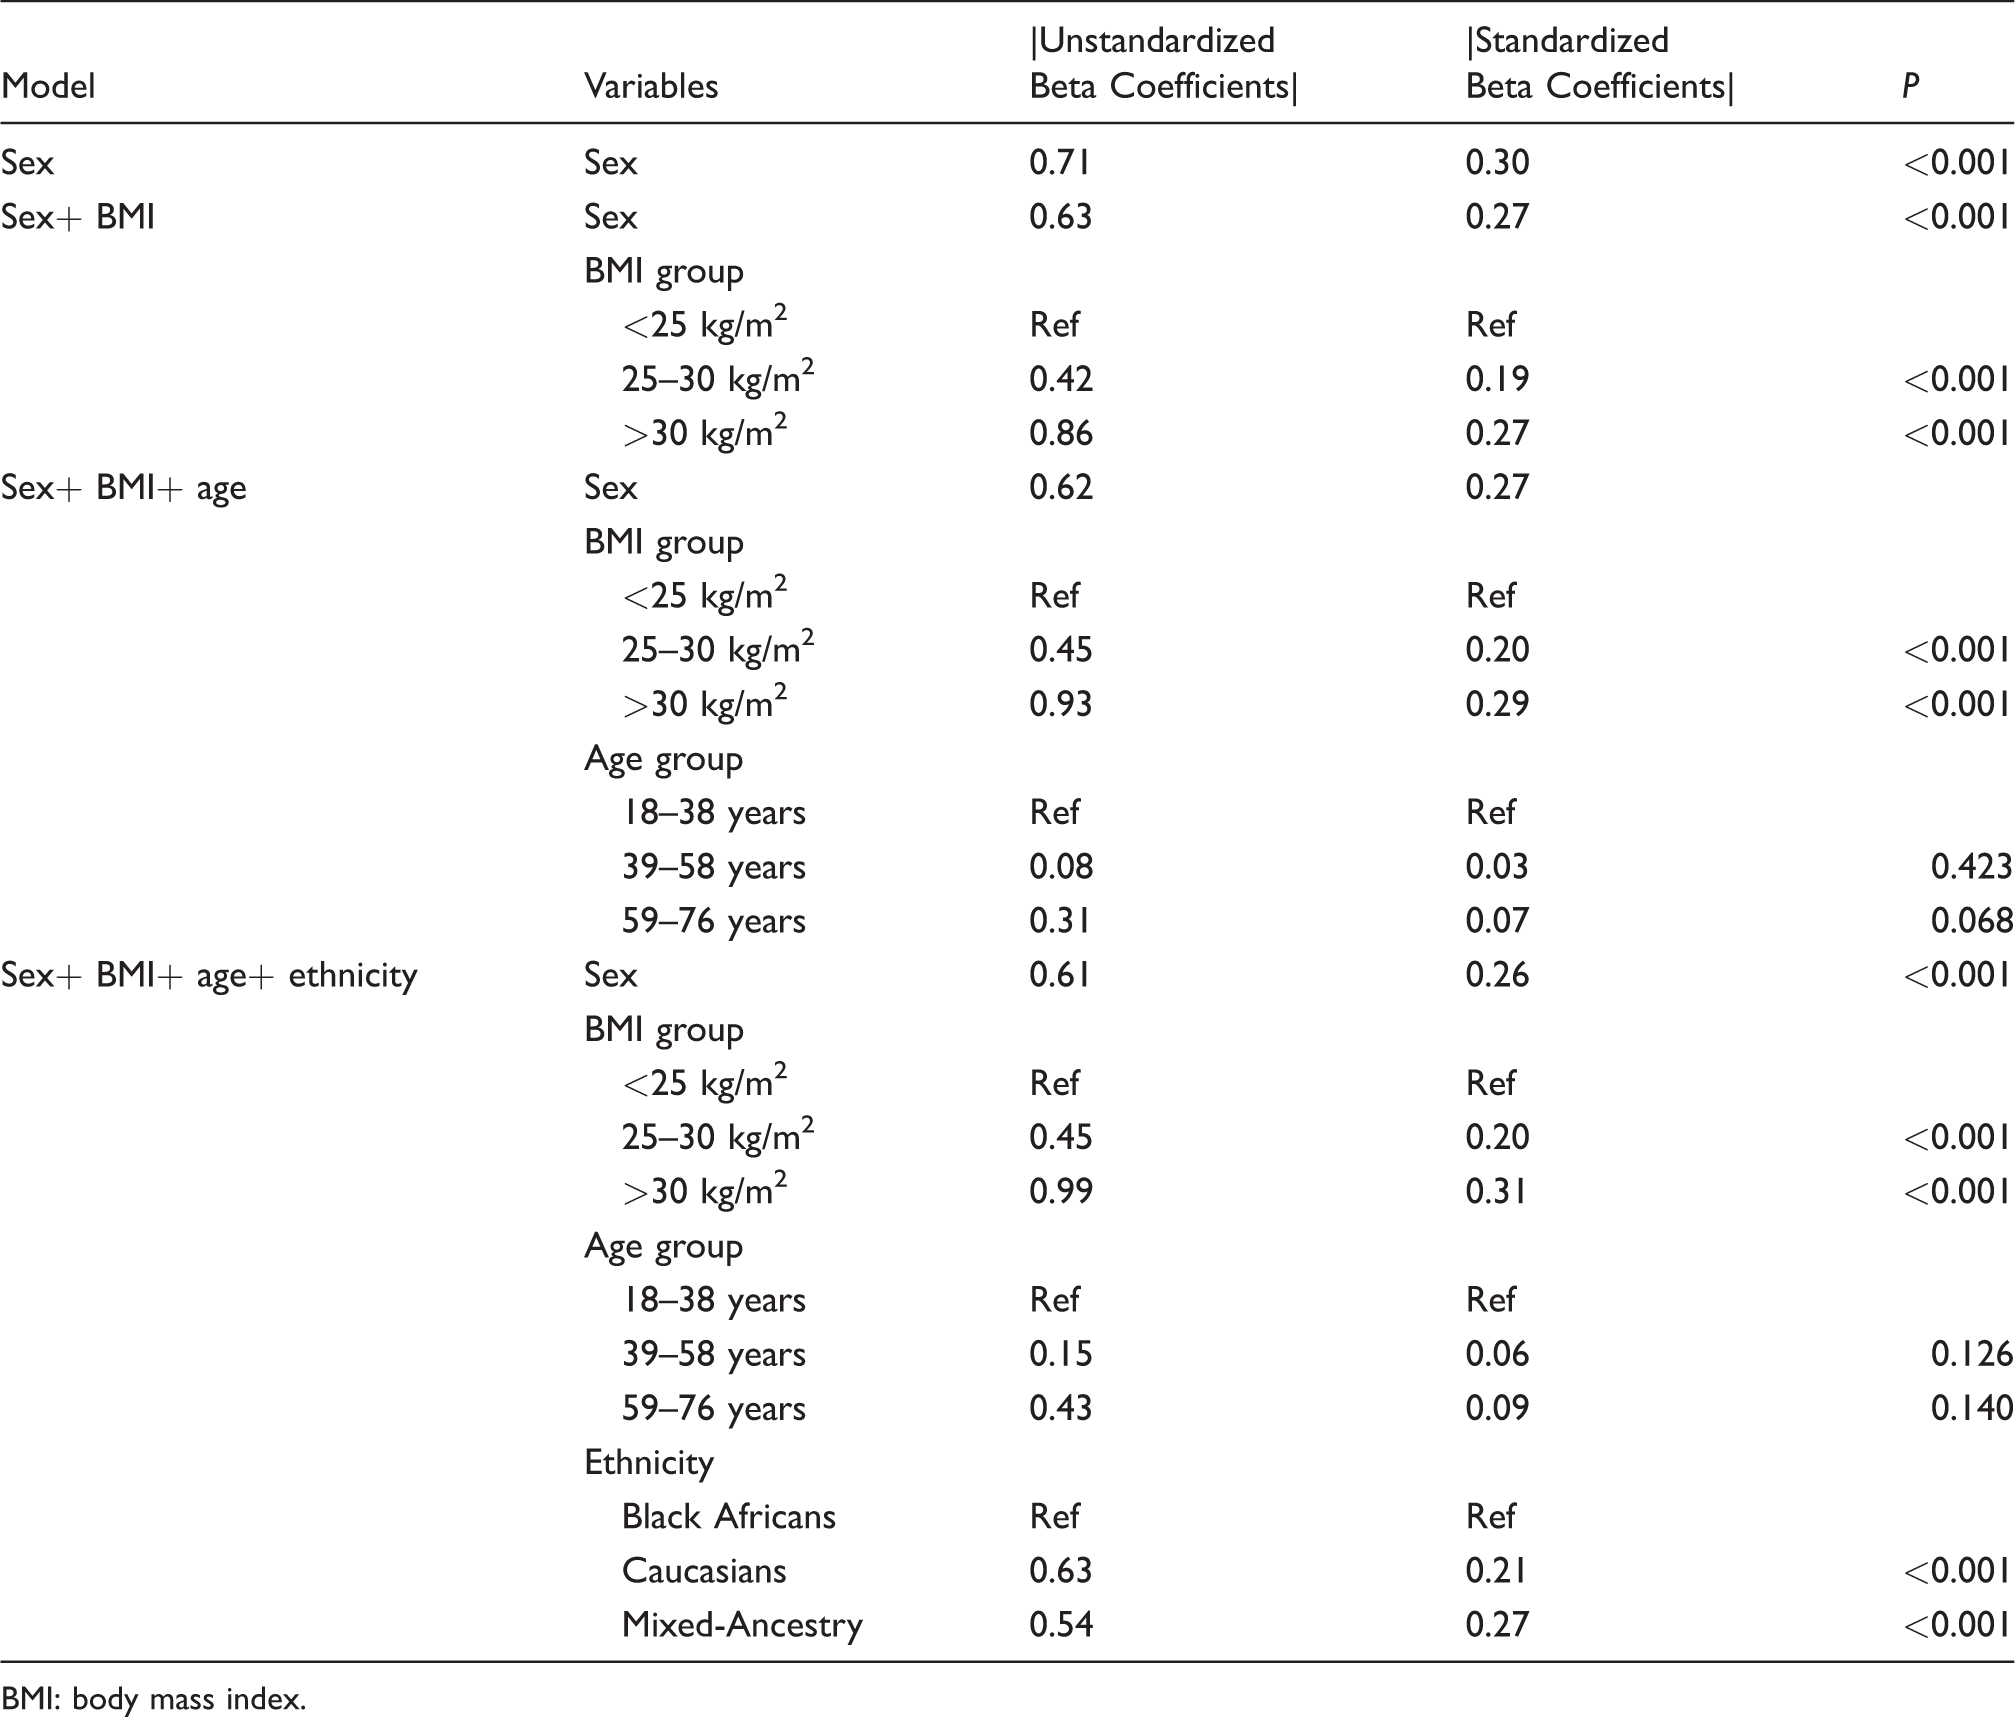
BMI: body mass index.
Discussion
This is the first study on GA RI determination conducted in an African population and included subjects from South Africa. We found that the overall RIs for this population were 10.7% (95% CI 10.5–10.9) to 15.2% (95% CI 15.0–15.3). Importantly, we found that in this population, the RIs were significantly higher in females (P < 0.0001) and differed according to BMI. The GA RIs for subjects with BMI <25 kg/m2 was 11.2% to 15.3%, for BMI 25–30 kg/m2, it was 10.5% to 14.9% and 10.0% to 14.6% for BMI >30 kg/m2 (P = 0.0001). Furthermore, the GA concentrations were statistically significantly higher in Black Africans (13.3%) compared with Caucasians and Mixed-Ancestry subjects, both 12.9%, P = 0.0025.
The RI for GA according to the Werfen package insert is 9% to 16% and is based on a preliminary RI study performed by Testa et al. 20 The RI determined in our study differs from those reported in several studies22–27 but is in keeping with a recent publication by Selvin et al. 19 that demonstrated a RI of 10.7% to 15.1% in middle-aged adults (between 47 and 68 years, mean age 55.3 years) with an equal sex distribution and 15% Black Americans. 19 An important difference between the Selvin et al. study 19 and our study is that we included subjects of a wider age range (between 18 and 76 years, mean age 33.9 years) and also included subjects of Mixed-Ancestry (31.1%). The origin of Mixed-Ancestry individuals in South Africa comprises Khoisan, European, African and Indian origins. 32 The Mixed-Ancestry community of Cape Town was shown to have a high frequency of undiagnosed diabetes, and the prevalence of diabetes and metabolic syndrome is increasing. 33
Another similarity between our study and that of Selvin et al. 19 is the sex-specific RIs, whereby the GA RIs were significantly higher in females. These differences could be attributed to the differences in obesity rates between males and females as observed in this study. However, the inverse relationship we observed between BMI and GA disputes this hypothesis, as it would have resulted in lower median GA in females than in males if this difference was due to differences in BMI alone. The GA and BMI relationship has also been reported in previous studies19,34–36 and is thought to be due to an increase in inflammatory cytokines in overweight and obese non-diabetic subjects.35,37 Further studies are necessary to determine whether a correction factor for BMI could be included in the GA equation. 38 Therefore, the difference observed between females and males is more likely to be due to a true sex-related difference rather than BMI.
Age-specific RIs were determined in our population after dividing the group by terciles. A previous study demonstrated a 0.31% increase in GA for every 10-year increase in age. 39 In our study, there was no statistically significant difference between the age groups, but this may be due to the lower mean ± SD age of our study population (33.9 ± 13.7 years) compared with that of Wu et al., 39 50.4 ± 12.6 years. Although our study comprised of individuals with an age range of 18 to 76 years, we could not compute reliable RIs in subjects between 59 and 76 years as they comprised of only 38 subjects (5.7%).
Ethnic-specific RIs demonstrated a slightly higher interval for Black Africans of 10.9% to 15.9%. This was also demonstrated in previous studies that included different ethnic groups. The Black Americans in the study by Selvin et al. 19 had a RI of 10.9% to 15.5%. Another study that included White and Black Americans demonstrated a mean GA of 13.52% and 14.19% for these groups, respectively. 22 The determination of RIs for subjects of Mixed-Ancestry is very relevant in the South African context, where 48.8% of the Western Cape province population is of Mixed-Ancestry origin. 40 In addition, a previous study demonstrated that a Mixed-Ancestry population in Bellville (Cape Town, South Africa) has a high prevalence of metabolic syndrome, which put them at high risk for the development of diabetes. 33
Our study demonstrated that sex, ethnicity and BMI were important sources of variation in GA RI determination. Therefore, these sources of variation will make the use of population-based RIs for GA unreliable and should be avoided. Further studies are necessary to determine clinical decision limits based on clinical outcomes (e.g. microvascular complications) while considering the effect of confounding factors identified in the current study and previous studies. The DETECT-2 collaboration provided invaluable information for the diagnosis of diabetes by correlating the levels of glycaemic markers with diabetic retinopathy. 41
The strengths are that the study was conducted according to a well-written protocol for a worldwide multicentre RI study and subjects were recruited specifically for a RI study. The wide array of measurements performed during the previous RI study allowed for secondary exclusion of subjects with conditions that may have confounding effects on the results.
A limitation of this study is that there was not an equal distribution of subjects according to sex and ethnicity. The ethnic distribution of the sample was not representative of the ethnic distribution of the South African population at national or provincial (Western Cape) level according to the 2011 national census results, with only 11.6% of subjects being Black Africans. 40 Fasting plasma glucose greater than 7 mmol/L was used to exclude subjects with possible diabetes; however, the diagnosis of diabetes is more complex and diabetes could therefore not be definitely excluded. 42
Future studies are needed to determine GA RIs in other African populations. Also, GA cut-offs in dysglycaemia and its usefulness as a screening tool for diabetes and prediabetes in this population should be determined.
Footnotes
Acknowledgements
The authors thank Ms M Hoffman for technical assistance with setting up the Roche® cobas® 6000, performing the method validation study and analysing study samples.
Declaration of conflicting interests
The author(s) declared no potential conflicts of interest with respect to the research, authorship, and/or publication of this article.
Funding
The author(s) disclosed receipt of the following financial support for the research, authorship, and/or publication of this article: TEM is funded by the South African Medical Research Council (SAMRC) with funds from National Treasury under its Economic Competitiveness and Support Package (MRC-RFA-UFSP-01–2013/VMH Study) and strategic funds from the SAMRC received from the South African National Department of Health. Any opinion, finding and conclusion or recommendation expressed in this material is that of the author(s) and the funders do not accept any liability in this regard. The ‘Establishing Adult Reference Intervals for Selected Analytes in South Africa’ study was supported by the National Health Laboratory Services (South Africa), Beckman Coulter and PathCare Laboratories (South Africa). Werfen (Milan, Italy, ![]() ) contributed free calibration material (ReferrIL Glycated Albumin, Ref 0018251800), controls (SeraChem Glycated Albumin, Ref 0018251900) and kits for glycated albumin (quantILab Glycated Albumin, Ref 0018256640) determination.
) contributed free calibration material (ReferrIL Glycated Albumin, Ref 0018251800), controls (SeraChem Glycated Albumin, Ref 0018251900) and kits for glycated albumin (quantILab Glycated Albumin, Ref 0018256640) determination.
Ethical approval
The Health Research Ethics Committee of Stellenbosch University, Cape Town (South Africa) approved this study (S12/05/147). This study was performed according to the Declaration of Helsinki.
Guarantor
AEZ.
Contributorship
AEZ, RTE and TEM researched the literature and conceived the study; MMK and AEZ were involved in protocol development and gaining ethical approval; MH and FS recruited patients; CM performed the data analysis; MB wrote the first draft of the article. All authors reviewed and edited the article and approved the final version.