
Abstract
Background
Post-transplant diabetes mellitus is one of the most important cardiovascular risk factors after solid organ transplantation. Factors other than hyperglycaemia found in patients post-transplant, affect the level of haemoglobin A1c (HbA1c), and new markers of hyperglycaemia are needed. Our aim was to establish a 95% reference interval for glycated albumin in kidney transplant recipients, and to compare glycated albumin concentrations to the diagnostic criteria for diabetes mellitus post-transplant using oral glucose tolerance test and HbA1c.
Methods
A total of 341 non-diabetic kidney transplant recipients aged ≥18 years who underwent an oral glucose tolerance test at 8 weeks and 1 year after transplantation were included. Glycated albumin was determined by liquid chromatography coupled with tandem mass spectrometry.
Results
The 95% reference interval for glycated albumin was 8.2 (90% CI: 7.2–8.5) to 12.8% (90% CI: 12.2–13.5) which is not significantly different from our laboratory’s 95% reference interval for persons without diabetes. At both 8 weeks and 1 year after transplantation, 35 patients (10.3%) fulfilled one, two or all three diagnostic criteria for diabetes mellitus. One year after transplantation, eight additional patients had glycated albumin concentration >12.8%.
Conclusion
Our findings are in accordance with the notion that kidney transplant recipients form glycation end products like normal controls as estimated by glycated albumin and HbA1c. Further studies should address glycated albumin as a supplemental tool for the diagnosis of post-transplant diabetes mellitus in kidney transplant recipients.
Keywords
Introduction
Diabetes mellitus (DM) after solid organ transplantation is associated with major cardiovascular events, death with a functioning graft and all-cause mortality.1,2 To identify patients at risk after transplantation, the entity post-transplant diabetes mellitus (PTDM) was reintroduced at an international consensus meeting in 2014, including all patients fulfilling the diagnostic criteria for DM after transplantation. 3 The diagnostic criteria for DM are determined according to the risk of developing retinopathy, the most frequent microvascular complication of the disease.4,5 Whether the diagnostic criteria for DM identify persons at risk for major events such as graft loss and death after transplantation is a matter of debate.
The use of the American Diabetes Association (ADA)/World Health Organization (WHO) diagnostic criteria for DM will to some extent, identify different individuals with PTDM. 6 The criteria are fasting plasma glucose (FPG) ≥7.0 mmol/L, random plasma glucose (RPG) ≥11.1 mmol/L together with symptoms of hyperglycaemia, an oral glucose tolerance test (OGTT) with a two-hour plasma glucose (2 h PG) ≥11.1 mmol/L and/or glycated haemoglobin A1c (HbA1c) ≥48 mmol/mol. 7 The OGTT is considered the gold standard test for diagnosing PTDM. 8 The test is cumbersome, has low reproducibility and is time consuming. Screening procedures that could identify patients at risk in a simpler manner are highly warranted.
Kidney transplant recipients (KTRs) have relatively preserved FPG and the test has low sensitivity for diagnosing PTDM.9,10 Glycated albumin (GA) and HbA1c are the result of a non-enzymatic glycation reaction with albumin and haemoglobin, respectively. The exposure of haemoglobin to glucose is a direct result of the life span of the erythrocytes, and the HbA1c concentration is determined by the amount of glucose present and the life span of the erythrocytes. In conditions with reduced red cell survival like end stage renal disease, the HbA1c will be falsely low resulting in a low sensitivity for detecting DM. 11 Erythropoietin stimulating agents (ESA) are widely used to treat anaemia in chronic kidney disease (CKD) patients. ESA stimulates red blood cell (RBC) formation and further complicates the interpretation of the HbA1c result. 12 The HbA1c concentration is in the early post-transplant period influenced by increased RBC turnover and tapering doses of immunosuppressant drugs in addition to hyperglycaemia. Whether a diagnosis of PTDM can be set using the same diagnostic criterion for HbA1c as in the general population remains to be established. 13 The glycation of albumin, the most abundant protein in plasma, is not influenced by RBC survival and most other factors related to renal anaemia in CKD. GA has been proposed as an alternative biomarker both for glucose control and as a prognostic factor in patients with CKD.14,15 An enzymatically based non-standardized method is the most widely used method for the measurement of GA. 16 The different methods may measure different quantities and are thus non-comparable.
Blood-glucose derived characteristics of the study population 8 weeks and 1 year after transplantation.
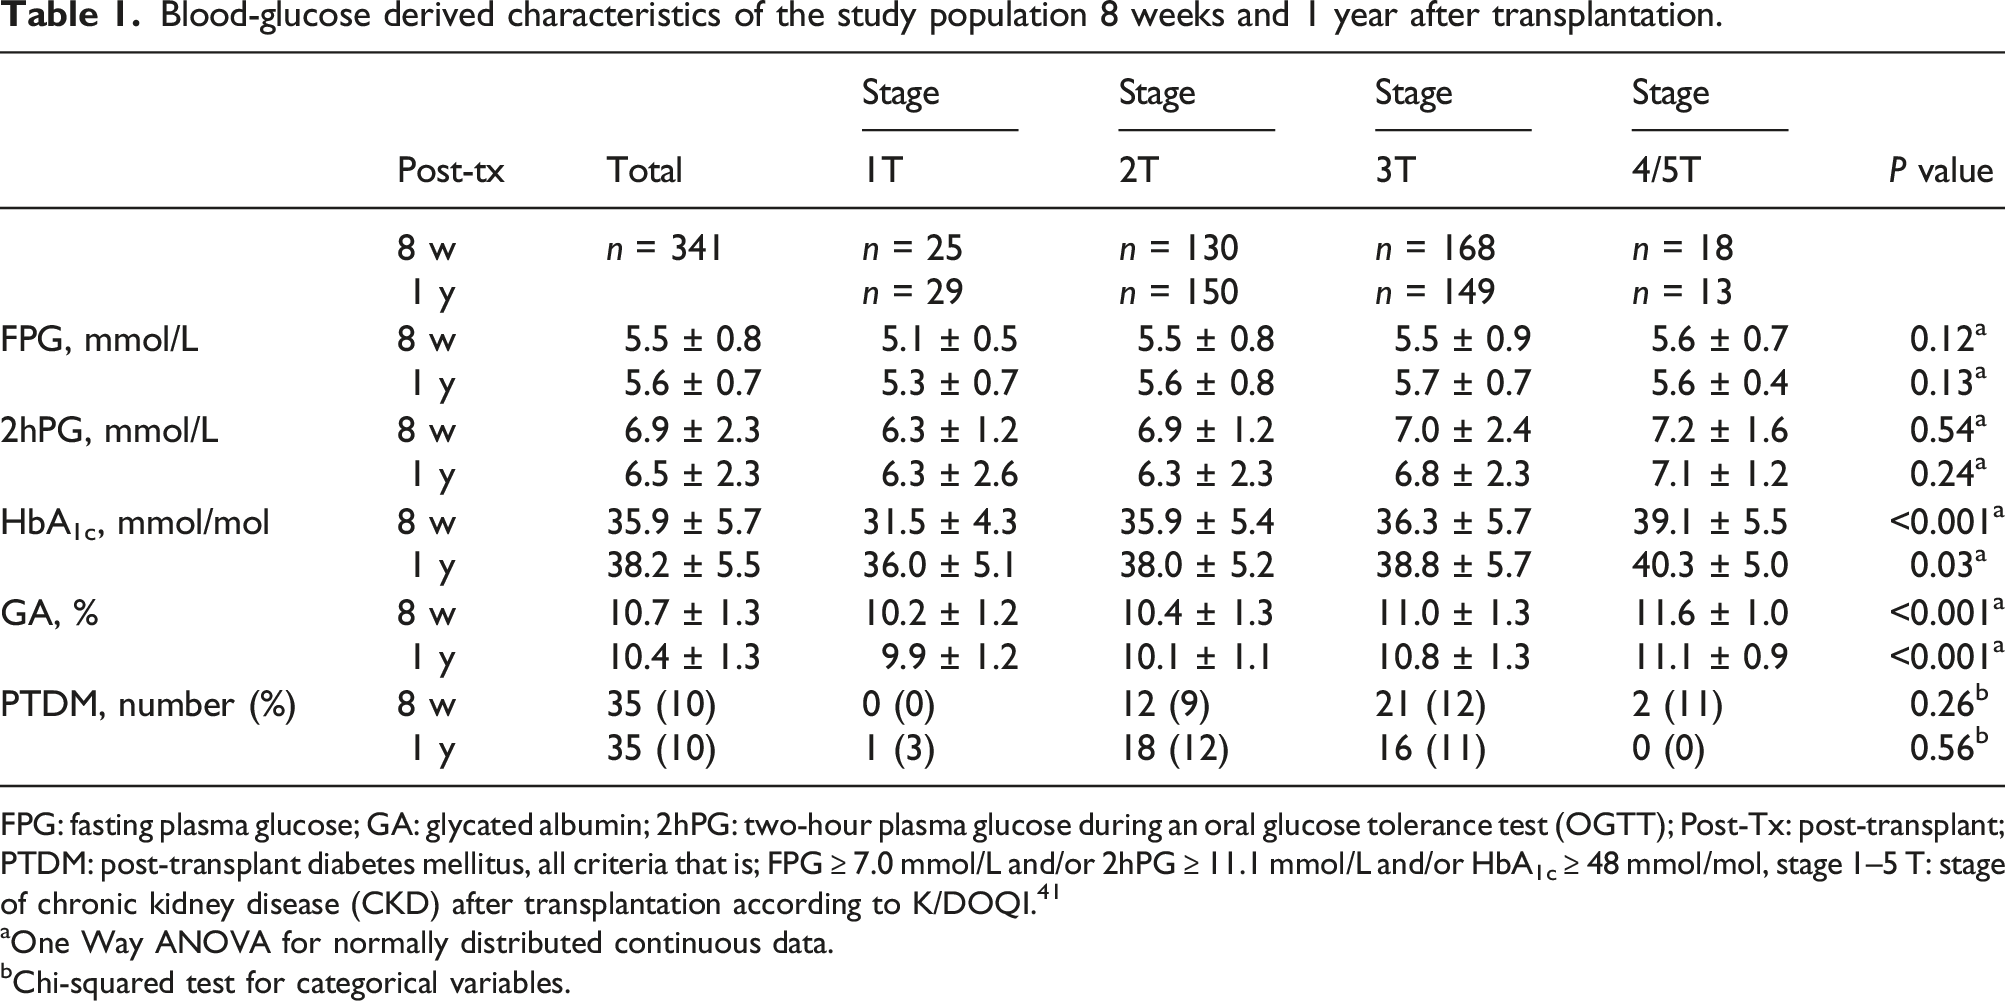
FPG: fasting plasma glucose; GA: glycated albumin; 2hPG: two-hour plasma glucose during an oral glucose tolerance test (OGTT); Post-Tx: post-transplant; PTDM: post-transplant diabetes mellitus, all criteria that is; FPG ≥ 7.0 mmol/L and/or 2hPG ≥ 11.1 mmol/L and/or HbA1c ≥ 48 mmol/mol, stage 1–5 T: stage of chronic kidney disease (CKD) after transplantation according to K/DOQI. 41
aOne Way ANOVA for normally distributed continuous data.
bChi-squared test for categorical variables.
Materials and methods
A total of 341 patients without pretransplant DM, transplanted between 1 January 2013 and 30 June 2015 at Oslo University Hospital, Rikshospitalet Norway, performed a 75 g OGTT and had blood samples biobanked both 8 weeks and 1 year after transplantation. None of the patients fulfilling any of the diagnostic criteria for DM identified at 8 weeks post-transplant received any glucose lowering therapy and a second OGTT was performed after 1 year. In this study, the OGTT was performed once at each time point in each patient. Standard immunosuppressive therapy included basiliximab and methylprednisolone induction followed by maintenance therapy of prednisolone, the cell proliferation inhibitor mycophenolate, and the calcineurin inhibitor tacrolimus. The tacrolimus dose was monitored regularly to an aimed target trough level of 3–7 μg/L.
Blood samples were collected 8 weeks and 1 year after transplantation as part of the routine clinical workup at the transplant centre. Haemoglobin, creatinine and albumin were consecutively analysed at the Department of Medical Biochemistry, Oslo University Hospital, Rikshospitalet contemporaneously to specimens being biobanked. The CKD Epidemiology Collaboration (CKD-EPI) equation was used to estimate the glomerular filtration rate. 18 HbA1c was analysed on collection in whole blood with a standardized immunoassay (Tina-Quant on Roche Modular P) until March 2015, and thereafter with a cross-validated capillary electrophoresis method (Sebia Capillarys 2 Flex Piercing). 19 The results were given in % and converted to mmol/mol by using the formula: IFCC HbA1c mmol/mol = (10.931*NGSP-HbA1c)-23.524. 20 One year post-transplant, 53% of the samples were analysed by the capillary electrophoresis method. OGTT was performed after an overnight fast (a minimum of 8 h) by administration of 75 g anhydrous glucose dissolved in 0.3 L of water. Blood glucose was measured in the fasting state and 2 h after glucose administration in samples of fresh venous blood by a plasma calibrated Haemocue AB B-glucose analyser (Ängelholm, Sweden).
The LC-MS/MS analysis of GA
Glycated albumin was measured at Stavanger University Hospital, an accredited laboratory since 2016 (ISO 15189), by a method developed in our laboratory detecting glycation at the 525K site. 17 The method was applied as reported with some minor modifications described. Serum gel tubes were used for collecting blood samples and stored for 30 min at room temperature. The serum obtained was then stored at −70°C within 1 h and thawed once in conjunction with the current analyses. Enzymatic digestion with trypsin was performed to obtain KQTALVELVK, a proteotypic peptide of human serum albumin. GA was then measured by the relative degree of glycation of the N-terminus lysine (K) of KQTALVELVK. Serum albumin has 57 different lysine glycation sites, of which the 525K is one of the sites with high degree of glycation. Serum samples were diluted with buffer and quickly digested by trypsin protease in a high concentration of acetonitrile solvent, as previously reported.17,21–23 Separation and detection of tryptic peptides was achieved by using LC-MS/MS with multiple reaction monitoring (MRM). The percentage ratio of GA was estimated by neat peak area response of glycated peptide divided by the sum of glycated and non-glycated peptide. The trypsin used was porcine derived trypsin, brand name Novo 4500K (Novozymes, Bagsværd, Denmark). The LC-MS/MS instrument was an Acquity UPLC Classic coupled with a Xevo TQ-S triple quadrupole mass spectrometer (Waters, Milford, MA, USA) and the LC column was an Acquity UPLC with BEH C18 stationary phase, 2.1 mm inner diameter, 50 mm length, and 1.7 μm particle size (part.no. 186002350, Waters). The intra- and inter-assay % coefficient of variation (%CV) for the current analyses was 2.5 and 3.3, respectively.
The modification of the method previously described 17 consists of robot pipetting with an EVO Freedom 150 liquid handling robot (Tecan, Männedorf, Switzerland). By robot pipetting into 96 well PP microplates, 2 μL serum or plasma was diluted and mixed with 450 μL Tris-formate (50 mM, pH 7.6) and 400 μL of this solution discarded. Then 190 μL acetonitrile and 10 μL trypsin solution (0.05 μg/μL) was added before capping the plate and incubation at 37 °C for 1 h and then followed by 11 min centrifugation, 4000 g at 4°C followed by a direct analysis by LC-MS/MS.
Serum samples must be diluted at least as much as described due to the following. When considering a typical serum total protein concentration of 50 μg/μL, the amount of protein left in the well was about 11 μg. The amount of trypsin transferred to the well was 0.5 μg, comprising a typical substrate to enzyme ratio of 22. This would be consistent of a concentration of protein in the incubated solution of less than 50 μg/mL. Proteins can be kept in solution at such low concentrations in various organic solvents. For instance, the solubility of bovine serum albumin in 100% acetonitrile is 20 μg/mL. 24 However, protein solubility increases when water is added to the acetonitrile. For instance, the solubility of plasma proteins in 50% acetonitrile will likely be closer to 750 μg/mL. 25 The issue of protein solubility is of major importance for the success of such a quick trypsin digestion protocol.
A commercially quality control sample (Seronorm Liquid Level 1, Sero, Norway) with an assigned concentration of 13.5% GA was used for method calibration. A different quality control sample (HK 12) with a mean concentration of 8.91% GA was applied to monitor long-term precision, resulting in a %CV of 4.0 (12 months, n = 57). The concentration specific %CV for a batch analysis was 2.0 (mean GA concentration 12.1%).
The RI for GA was determined at the laboratory at Stavanger University Hospital using 226 biobank samples from the Nordic Reference Interval Project Bio-bank and Database (NOBIDA) study and was 7.8 (90% CI: 7.6–8.1) to 12.4% (90% CI: 12.2–12.6). 26
Statistical analysis
SPSS Statistics-Premium (FP 1) version 24.0.0.1 was used for the descriptive statistics. Descriptive statistics are presented as mean ± SD when normally distributed, median and range when not normally distributed unless otherwise stated. The Shapiro–Wilk test and the quantile–quantile (QQ) plot was used to assess whether the data were normally distributed. The receiver operating characteristic (ROC) curves and RIs were calculated by Analyse-It for Microsoft Excel 5.65 using the Quantile method, a distribution-free (non-parametric) quantile estimator based on the order statistics. For the RIs, the 90% confidence intervals (CI) for the upper limit of normal (ULN) and the lower limit of normal (LLN) are presented, otherwise 95% CI are presented.
Results
Patient characteristics
The age of the included patients were 52.8 ± 14.3 years, 239 males and 102 females. A total of 288 patients (84%) received a first, 41 (12%) a second, 11 (3%) a third, and one patient (0.2%) received a fourth kidney transplant. Median dose of prednisolone was 10.0 mg (range 5.0–30.0) per day 8 weeks post-transplant and 5.0 mg (range 2.5–20.0) per day 1 year post-transplant. At 8 weeks and 1 year post-transplant the estimated glomerular filtration rate (eGFR) was 60 ± 20 mL/min/1.73 m2 and 62 ± 19 mL/min/1.73 m2, respectively, the haemoglobin level 122 ± 14 g/L and 139 ± 1.7 g/L, respectively, and the albumin level 42.3 ± 2.9 g/L and 43.5 ± 2.6 g/L, respectively. At 8 weeks after transplantation the body mass index (BMI) was 25.1 ± 4.2 kg/m2 and at 1 year after transplantation 26.0 ± 4.5 kg/m2.
Thirty-three patients fulfilled the plasma glucose criteria for PTDM (FPG ≥7.0 mmol/L and/or 2hPG ≥ 11.1 mmol/L during an OGTT), and an additional two patients when adding HbA1c ≥ 48 mmol/mol as a diagnostic criterion 8 weeks after transplantation as compared with 25 and 10 patients, respectively, 1 year after transplantation (Table 1). Eight weeks after transplantation, 10 patients fulfilled both the plasma glucose-based criteria for PTDM, 10 patients only the FPG criterion and 13 patients only the 2hPG criterion. One year after transplantation, 10 patients fulfilled both the plasma glucose-based criteria for PTDM, eight patients only the FPG criterion, and seven patients only the 2hPG criterion. When applying both glucose-based and HbA1c criteria for the diagnosis of DM, we thus identified 35 patients (10.3%) with PTDM at both time points, but different individuals were mainly identified, Figure 1. Twenty of the 35 patients identified at 8 weeks, did not fulfil the diagnostic criteria for PTDM at 1 year after transplantation, and 27 of the 35 patients identified at 8 weeks after transplantation had a normal OGTT 1 year after transplantation. Euler diagram showing the patients with the different diagnostic criteria for post-transplant diabetes mellitus (PTDM) 1 year after transplantation and glycated albumin (GA) above upper limit of normal (ULN) of the estimated 95% reference interval. FPG: fasting plasma glucose ≥7 mmol/mol (n = 17), 2hPG: two-h plasma glucose ≥11.1 mmol/l (n = 17) during an oral glucose tolerance test (OGTT), HbA1c: haemoglobin A1c ≥ 48 mmol/mol (n = 20), GA: glycated albumin > 12.8% (n = 16).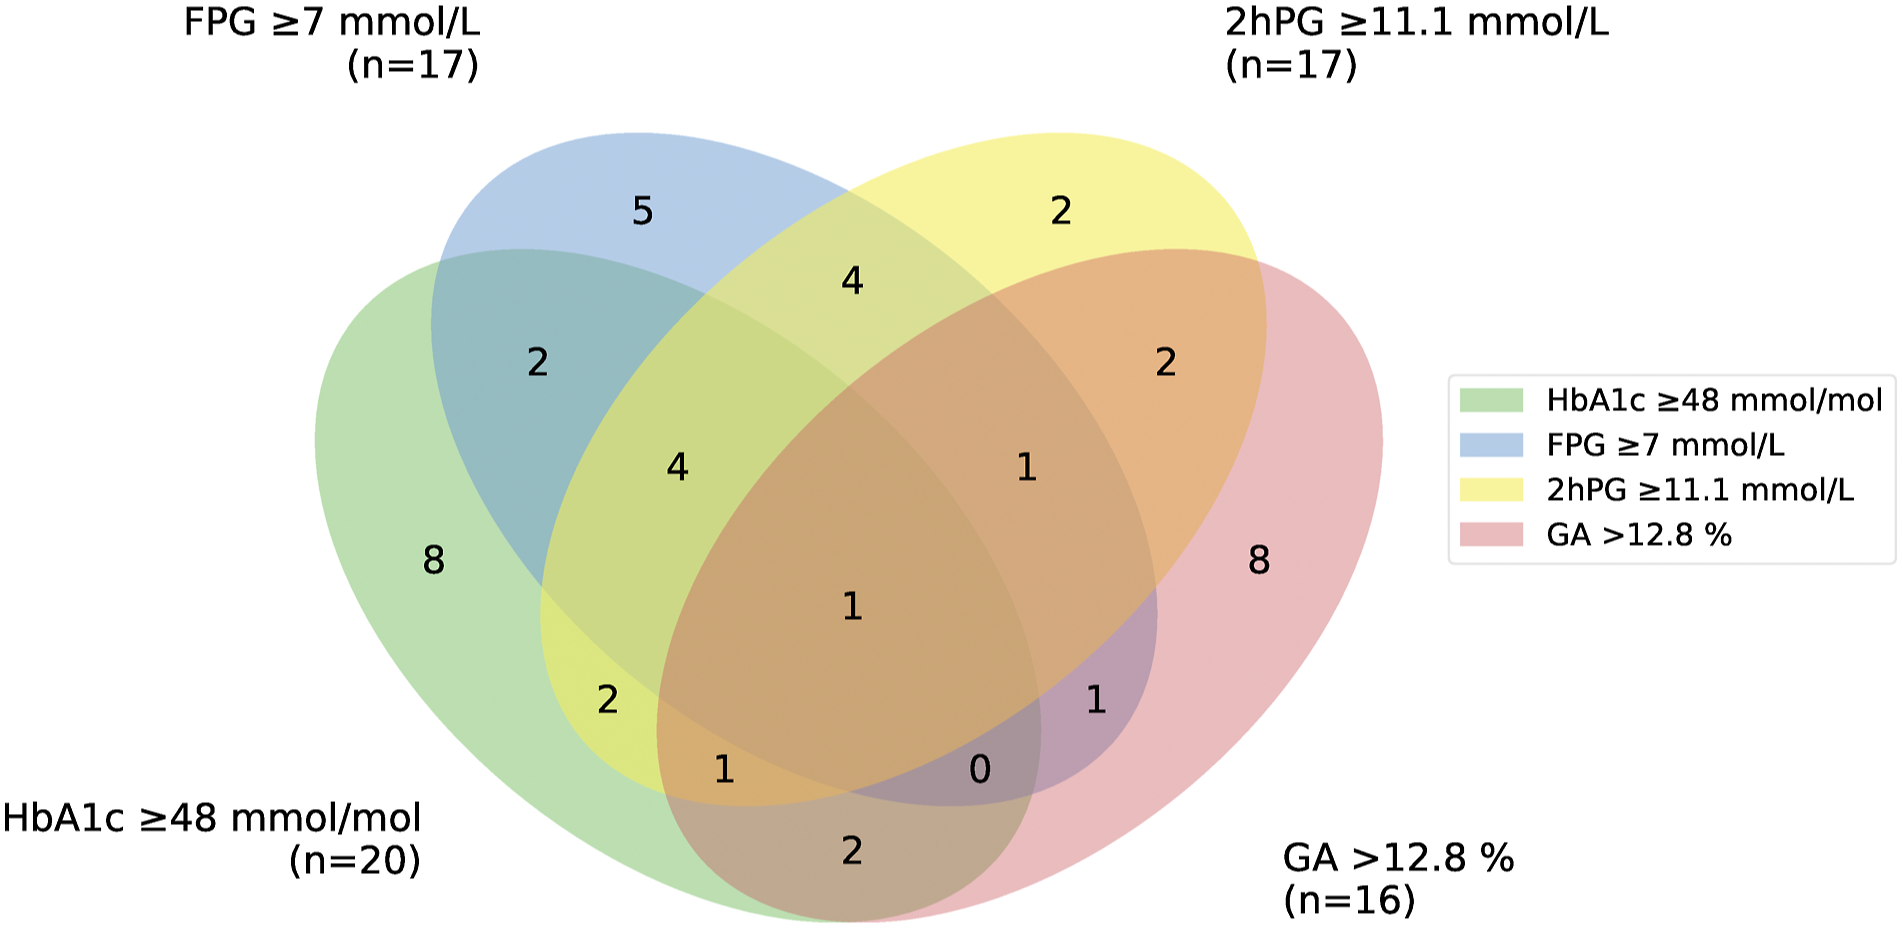
RI
The RI for GA in KTRs was estimated 1 year after transplantation in the patients with normal glucose tolerance according to the American Diabetes Association (ADA) guidelines, that is, FPG <5.6 mmol/L and 2hPG <7.8 mmol/L. Of the 341 included patients, 169 had normal glucose levels; 108 male and 61 female, age 50.6 ± 14.9 years, eGFR 65 ± 20 mL/min/1.73 m2, Hb 140 ± 18 g/L and albumin 43.5 ± 2.6 g/L. The FPG was 5.1 ± 0.3 mmol/L, 2hPG mmol/L 5.5 ± 1.1 mmol/L, GA 10.1 ± 1.1% (8.2–12.8% [2.5 and 97.5 percentile]) and HbA1c 36.3 ± 4.5 mmol/mol (27.4–44.2 [2.5 and 97.5 percentile]). A total of 138 patients were living with their first kidney transplant, 23 with their second, 7 with their third, and 1 patient had received a fourth kidney transplant.
The RI for GA was estimated to 8.2 (90% CI: 7.2–8.5) to 12.8% (90% CI: 12.2–13.5).
The GA results were not normally distributed (assessed by the Shapiro–Wilk test [p = 0.028] and QQ plot), and two near-outliers (13.2 and 13.5%) were included in the estimation.
ROC analysis 1 year after transplantation
The area under the ROC curve (AUC) for GA and HbA1c with the glucose-based criteria for PTDM (FPG ≥ 7.0 mmol/L and/or 2hPG ≥ 11.1 mmol/L) as the gold standard, was 0.78 (CI 0.68–0.87) and 0.84 (CI 0.74–0.93), respectively. The AUC for HbA1c and GA was not statistically different (difference 0.06, CI: −0.07–0.19). In this model, the sensitivity and specificity for PTDM using GA >12.8% (ULN for the population) as the diagnostic criterion was 24 and 97%, respectively. For HbA1c ≥ 48 mmol/mol as the diagnostic criterion for PTDM, the sensitivity and specificity were 8 and 99% and for HbA1c > 44 mmol/mol (ULN for the population) 60 and 88%, respectively, Figure 2(a). ROC curves 1 year after transplantation.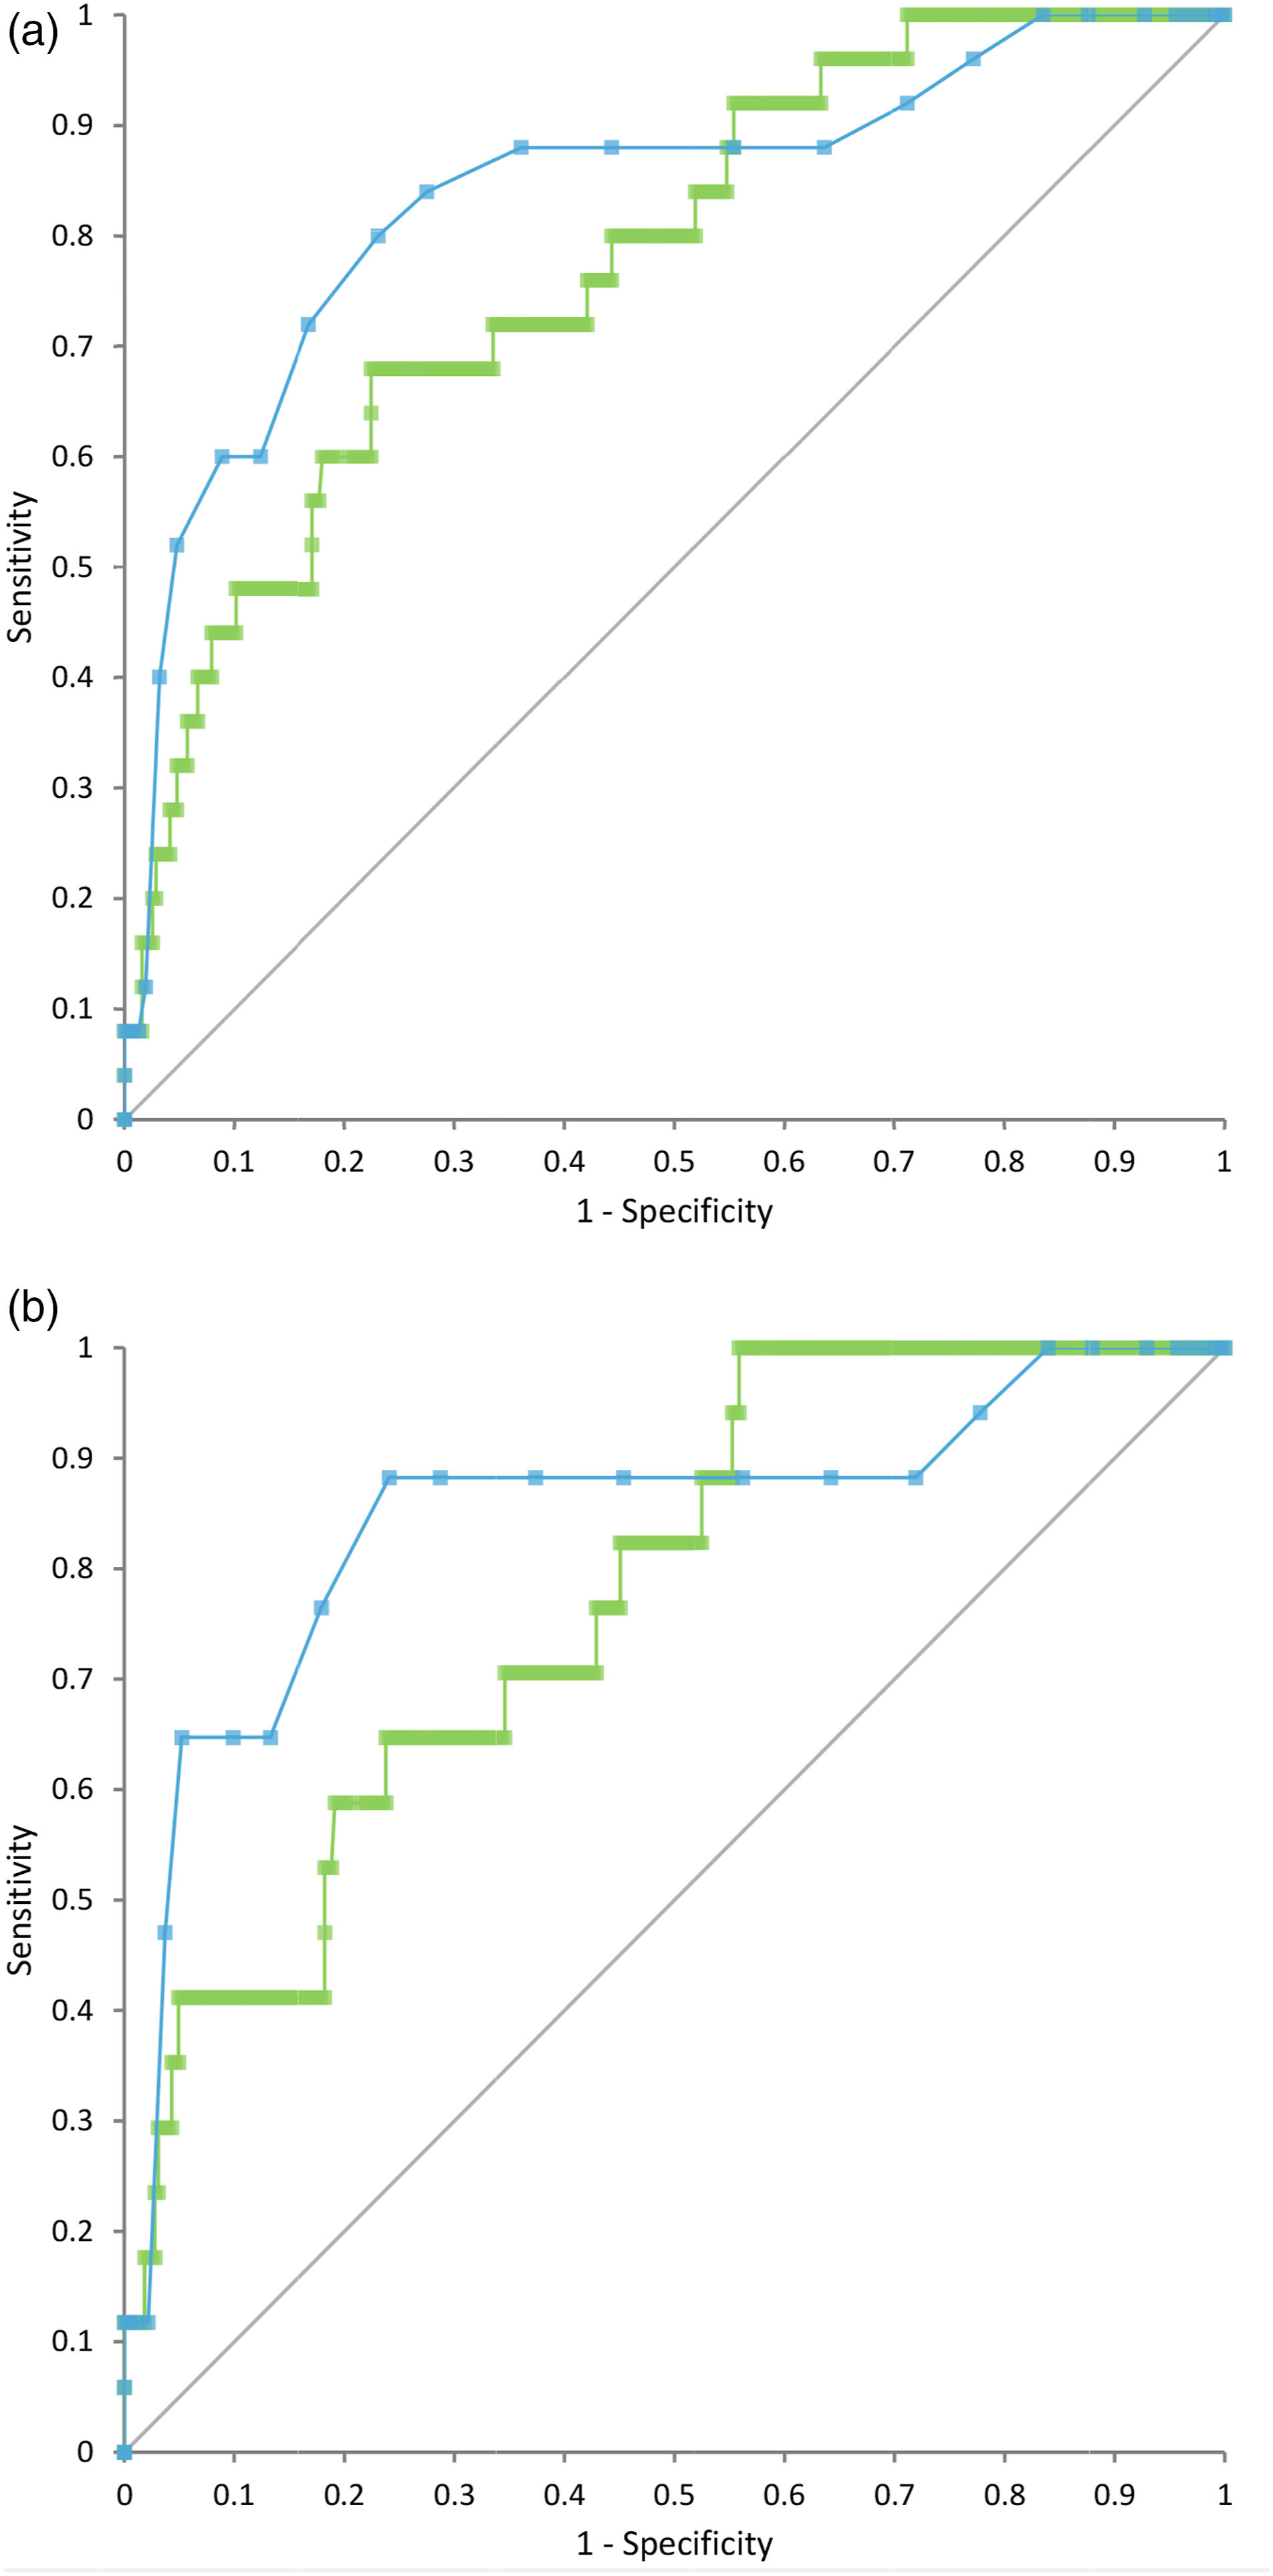
The AUC for GA and HbA1c with the OGTT (2hPG ≥ 11.1 mmol/L) as the gold standard was 0.78 (CI 0.67–0.88) and 0.85 (CI 0.73–0.97), respectively. The AUC for HbA1c and GA was not statistically different (difference 0.07, CI: −0.12–0.26). In this model, the sensitivity and specificity for PTDM using GA > 12.8% as the diagnostic criterion was 29 and 97%, respectively. For HbA1c ≥ 48 mmol/mol as the diagnostic criterion for PTDM the sensitivity and specificity were 12 and 98% and for HbA1c > 44 mmol/mol (ULN for the population) 65 and 90%, respectively, Figure 2(b).
Discussion
We have established RIs for GA analysed by LC-MS/MS and HbA1c in KTRs with normal glucose tolerance. One year after transplantation, the RI was not significantly different from our laboratory’s RI for the normal population. GA determined by an enzymatically based method is more widely used in Asia where levels of ≥15.5% has been reported optimal for predicting DM. 27 In a European population with normal glucose concentrations according to ADA the RI was recently found to be 9.0 (90% CI: 8.7–9.5) to 16.0% (90% CI: 15.6–16.4). 28 To our knowledge, a RI for GA analysed by LC-MS/MS has not been estimated in an unselected population of KTRs.
In the present study, we performed the different tests for identifying patients with hyperglycaemia at both 8 weeks and 1-year after transplantation. This resulted in the identification of mainly different individuals. The difference between the results may be due to poor reproducibility of OGTT used as the gold standard, changes in confounding factors or changes in causal factors for hyperglycaemia in itself. At 1 year after transplantation, only four patients had a normal FPG and HbA1c level but an abnormal OGTT. In 4 out of 35 patients (11%) the diagnosis of PTDM would have been missed without an OGTT 1 year post-transplant. This is in accordance with another study from our transplant center. 7 Ten patients would on the other hand been missed without the HbA1c test in the diagnostic workup, Figure 1.
When applying GA >12.8%, the ULN of the RI from our transplant population as a diagnostic criterion, another eight patients would have been identified 1 year after transplantation in addition to the 35 patients already diagnosed, Figure 1. The cut off values for GA for identifying patients with DM or those at risk for graft loss and cardiovascular events are, however, not established. The diagnostic criteria for DM in the general population have been applied 29 and these criteria are based on the association between DM and the risk for diabetic retinopathy. All the tests in current use for identifying patients with DM, including HbA1c, correlates with the risk for retinopathy equally well as do GA.30,31 In a diagnostic accuracy study of GA determined by an enzymatic method, GA was not found to be superior to HbA1c in detecting PTDM 4 month after kidney transplantation. 32 The ULN in our study was for HbA1c and GA 44.4 mmol/mol and 12.8%, respectively. It has been discussed whether the HbA1c diagnostic threshold level should be lowered from 48 to 44 mmol/mol in KTRs as the sensitivity for detecting PTDM then would increase from 38.0 to 57.8% using the OGTT as the gold standard. 33 This is in accordance with our findings. Accordingly, we speculate that a threshold value for GA of 12.8% will identify KTRs at risk for graft loss and cardiovascular events and future studies should address this question.
Albumin has a half-life of approximately 14–21 days and GA reflects glycaemic control approximately 2 weeks prior to testing as opposed to 2–3 months for HbA1c due to the RBC life span of approximately 90–120 days under normal conditions. When used alone, HbA1c identifies fewer patients than the use of FPG and the OGTT and has its limitations in hereditary haemoglobinopathies, anaemias with changed lifespan of erythrocytes, iron deficiency, in patients with CKD and in pregnancies. 30 Whether the limitations for the HbA1c also apply in stable KTRs on maintenance immunosuppression therapy have been a matter of debate.8,33 GA is more sensitive to glycation than haemoglobin (the rate of glycation is 9–10 fold higher) and has a larger range of glycation. 34 The method for analysing GA developed in our laboratory is based on LC-MS/MS methodology and thus highly specific. Our methodology for identifying the glycation of albumin is restricted to one site, the lysine residue 525K. This albumin glycation site was identified in all in vitro glycated serum samples of albumin during the development of the method and exhibits a fast pattern of glycation. The %CV of the method has been reduced from 6 to <4 after the method was established as part of the routine. 17 Postprandial hyperglycaemia and hyperglycaemia of shorter duration may be identified by GA before any changes in HbA1c is detectable. In KTRs with relatively preserved FPG and elevated postprandial glucose, GA has the potential for providing additional information to HbA1c of clinical importance, and in patients with reduced graft function and renal anaemia the potential for replacing HbA1c altogether.
One outcome-study found that patients fulfilling the standard blood glucose criteria for PTDM in the early post-transplant period (8–10 weeks after transplantation) had a higher risk of overall mortality (but not cardiovascular mortality) as opposed to those fulfilling the HbA1c criteria for DM who did not. 35 The authors recommend the use of OGTT as the gold standard for identifying persons at risk in the early post-transplant period. These findings are in some conflict with another study of persons with prediabetes post-transplant (defined as FPG ≥5.6 mmol/L and <7.0 mmol/L, 2hPG ≥7.8 mmol/L and ≤11.1 mmol/L) or PTDM with a follow-up of 8 years. In patients having prediabetes or PTDM 3 months after transplantation, they found an increase in fatal or non-fatal cardiovascular disease the first 12 months after transplantation but no increase in the rest of the observation-period. However, patients with prediabetes or PTDM 12 months after transplantation had an increased risk of cardiovascular disease compared with patients with a normal glucose metabolism. A large proportion of the patients with prediabetes or PTDM 3 months after transplantation had normalized their glucose metabolism at 12 months. The authors recommend the use of OGTT 12 months after transplantation for identifying patients at risk. 36 Whether glucose-lowering therapy for PTDM will reduce the risk for adverse outcomes are not known as intervention studies to date have been of short duration (<1 year) and have focussed on safety and possible interactions with the immunosuppressant therapy. 13
Oral glucose tolerance test as the gold standard test for risk assessment raises further questions as the test is not only cumbersome and time consuming but have some well-known confounding factors, especially frequent in the early post-transplant period. Stressors like acute illness and hospitalization and several medications like glucocorticoids and other immunosuppressives that are mandatory after transplantation, can affect plasma glucose levels. 37 Body size has also been identified as a confounding factor, and the %CV is high. 38 In epidemiological research, the diagnostic tests for DM is usually done only once despite the WHO requirement for two positive tests for the clinical diagnosis to be made. The greater the %CV of the test, the greater discrepancy between the numbers of patients identified with one test in epidemiological research and by a two-test approach in clinical practice. The total %CV of the OGTT is approximately 16 mainly due to biological variation. 39 The likelihood of confirming a positive test close to the cut-off point is thus lower than 50% and may be as low as 25%. 40 The patient population identified in epidemiological studies will thus not comprise the same persons as in a clinical setting. On the other hand, the analytical %CV for HbA1c and GA is at our local laboratory at present ≤3 and ≤4, respectively.
Conclusion
We have established a 95% RI for GA in KTRs. At present, our findings do not support a routine use of GA analysed by LC-MS/MS methodology in KTRs. GA may contribute to the diagnosis of PTDM after the first year of transplantation as do HbA1c. Further studies should address if glycation end products 1 year after transplantation and thereafter in combination with FPG, can replace the cumbersome OGTT in the identification of patients with PTDM.
Footnotes
Acknowledgements
The authors acknowledge the contribution of Cato Brede, Department of Medical Biochemistry, Stavanger University Hospital, Stavanger, Norway.
Declaration of conflicting interests
The author(s) declared no potential conflicts of interest with respect to the research, authorship, and/or publication of this article.
Funding
The author(s) received no financial support for the research, authorship, and/or publication of this article.
Ethical approval
The study used biobanked samples and clinical data from the transplant center biobank and database. Written informed consent for these samples and information to be used in research was obtained from each individual patient before biobanking samples. The study was approved by the Regional Medical and Health Research Ethics Committees (REC South East 2014/455), Norway.
Guarantor
N/A.
Contributorship
IHB participated in data analysis, and wrote the article, ØS participated in data analysis, revised and reviewed the article, AA participated in research design, collected the registry-based data and revised and reviewed the article, LGG participated in research design, participated in data-analysis and revised and reviewed the article.