
Abstract
Background
Glycated albumin reflects 2–3-week glycaemic controls, and in addition to glycated haemoglobin, it has been used as a glycaemic control indicator. We presumed that glycated albumin also has seasonal variations and is related to temperature, similar to glycated haemoglobin.
Methods
The subjects were diabetic outpatients from April 2007 to March 2013. This resulted in the enrolment of 2246 subjects and the collection of a total of 53,968 measurements. Mean glycated haemoglobin, glycated albumin, and plasma glucose were calculated for each month over six years. The associations of the measures with each other and the average temperature for each month in Tokyo were assessed using Spearman rank correlation coefficients.
Results
Plasma glucose was highest in January and lowest in May. Glycated haemoglobin was highest in March and lowest in September. Glycated albumin was highest in May and lowest in December. Glycated albumin tended to have a disjunction with plasma glucose in winter. Glycated haemoglobin had seasonal variation, but glycated albumin did not. Plasma glucose and glycated haemoglobin showed significant negative correlations with temperature (rs = −0.359, P < 0.001, rs = −0.449, P < 0.001, respectively), but glycated albumin did not. However, glycated albumin was inter-correlated with plasma glucose (rs = 0.396, P < 0.001) and glycated haemoglobin (rs = 0.685, P < 0.001), and glycated haemoglobin was inter-correlated with plasma glucose (rs = 0.465, P < 0.001).
Conclusion
Glycated albumin and glycated haemoglobin showed different seasonal variations from each other over the six-year study period. Thus, further studies to identify factors that contribute to glycated albumin are needed.
Background
Type 2 diabetes mellitus is the most prevalent metabolic disease in the world. Its complications threaten the human health and also have a great impact on the economy. Maintaining good long-term glycaemic control is important for reducing the risk of diabetes-related complications.1–4 The diagnosis of diabetes mellitus is based on plasma glucose (PG) concentration and glycated haemoglobin (HbA1c) level. 5 The management of type 2 diabetes mellitus starts with the initiation of lifestyle modifications including nutritional therapy and exercise; this is followed by pharmacotherapy with oral agents if the HbA1c level exceeds the target of 7.0%, as recommended by the guidelines of the American Diabetes Association and the European Association for the Study of Diabetes. 6 HbA1c is widely used as the gold standard parameter of long-term glycaemic control in diabetic patients and for diagnosis in this way. Lowering HbA1c to <7.0% is recommended in most patients to reduce the incidence of microvascular disease. But HbA1c may be inaccurate in patients with anaemia or variant haemoglobin, because it is influenced by haemoglobin metabolism. 7
On the other hand, glycated albumin (GA), which is a product of the chemical binding of serum albumin and glucose by non-enzymatic oxidation reaction, is not influenced by haemoglobin metabolism. 7 It reflects 2–3-week glycaemic controls, and in addition to HbA1c, it has been used as a glycaemic control indicator. It is a better glycaemic indicator than HbA1c in diabetic patients on haemodialysis. 8 And in a case-cohort subpopulation of the Diabetes Control and Complications Trial (DCCT), HbA1c and GA had similar associations with retinopathy and nephropathy, which were strengthened when both measures were considered together. 9 It was also reported that GA was associated with vascular outcomes and mortality, and that these associations were similar to those observed for HbA1c in the community-based Atherosclerosis Risk in Communities Study. 10 From these clinical studies, GA has been garnering attention as the new clinical marker for the glycaemic control.
It is a well-known fact that HbA1c has seasonal variations and is closely related to temperature. 11 Considering the same use of both GA and HbA1c, we presumed that GA also has seasonal variations and is related to temperature, similar to HbA1c.
Methods
The subjects were diabetic outpatients of the Keio University Hospital from April 2007 to March 2013 in whom HbA1c and GA were examined simultaneously. This study was approved by the Ethical Committee of the Keio University School of Medicine and was performed in accordance with the Declaration of Helsinki. Casual plasma glucose was also measured simultaneously in most subjects. This resulted in the enrolment of 2246 subjects (1437 men, 809 women, mean age 63.5±13 years) and the collection of a total of 53,968 measurements. As the subjects visited our hospital every 1–3 months according to their diabetic control, the average number of tests per patient was 24 times over six years.
All measurements were performed by the Department of Laboratory Medicine of Keio University School of Medicine using routine automated laboratory methods. HbA1c was measured by high-performance liquid chromatography using an automated analyser (HLC-723G9; TOSOH), GA by an enzymatic method using a liquid chemistry system (GA assay, Lucica GA-L, Asahi Kasei Corp.), and PG by glucose oxidase method using a GA09 auto-analyser (A&T Corp.). HbA1c level was expressed in accordance with the National Glycohaemoglobin Standardization Program (NGSP) guidelines (%) as recommended by the Japanese Diabetes Society 14 in addition to International Federation of Clinical Chemistry (IFCC) (mmol/mol) calculated by the following equation: HbA1c-IFCC = 10.93 × HbA1c-NGSP−23.52. 15 Some samples were subjected to fasting and postprandial tests, depending on the subject’s condition.
Mean HbA1c, GA, and PG were calculated for each month over six years. Data are expressed as the mean ± SD. The level of significance was set at P < 0.05. The associations of the measures with each other and the average temperature for each month in Tokyo 16 were assessed using Spearman rank correlation coefficients. All statistical analyses were performed using SPSS version 22.0 for Windows (IBM, Armonk, USA).
Results
As a result, mean HbA1c was 7.40 ± 1.36% (57 ± 7.0 mmol/mol), GA was 20.51 ± 5.53%, and PG was 8.63 ± 3.13 mmol/L. Type 1 diabetes was present in 6.5% of the subjects, type 2 diabetes in 82.1%, gestational diabetes in 1.9%, steroid-induced diabetes in 5.4%, pancreatic disease-induced diabetes in 1.6%, hepatic disease-induced diabetes in 1.7%, and other types of diabetes (endocrine disease-induced diabetes, etc.) in 1.0%. The patients with type 2 diabetes who used steroids were classified as steroid-induced diabetes. The mode of therapy was life style modification in 18.2%, an oral hypoglycaemic agent in 52.6%, and insulin in 29.2%.
Figure 1(a) and (b) shows the monthly averages of HbA1c, GA, and PG in the combined calendar months over the six years. PG was highest in January and lowest in May. HbA1c was highest in March and lowest in September. GA was highest in May and lowest in December. GA tended to have a disjunction with PG in winter.
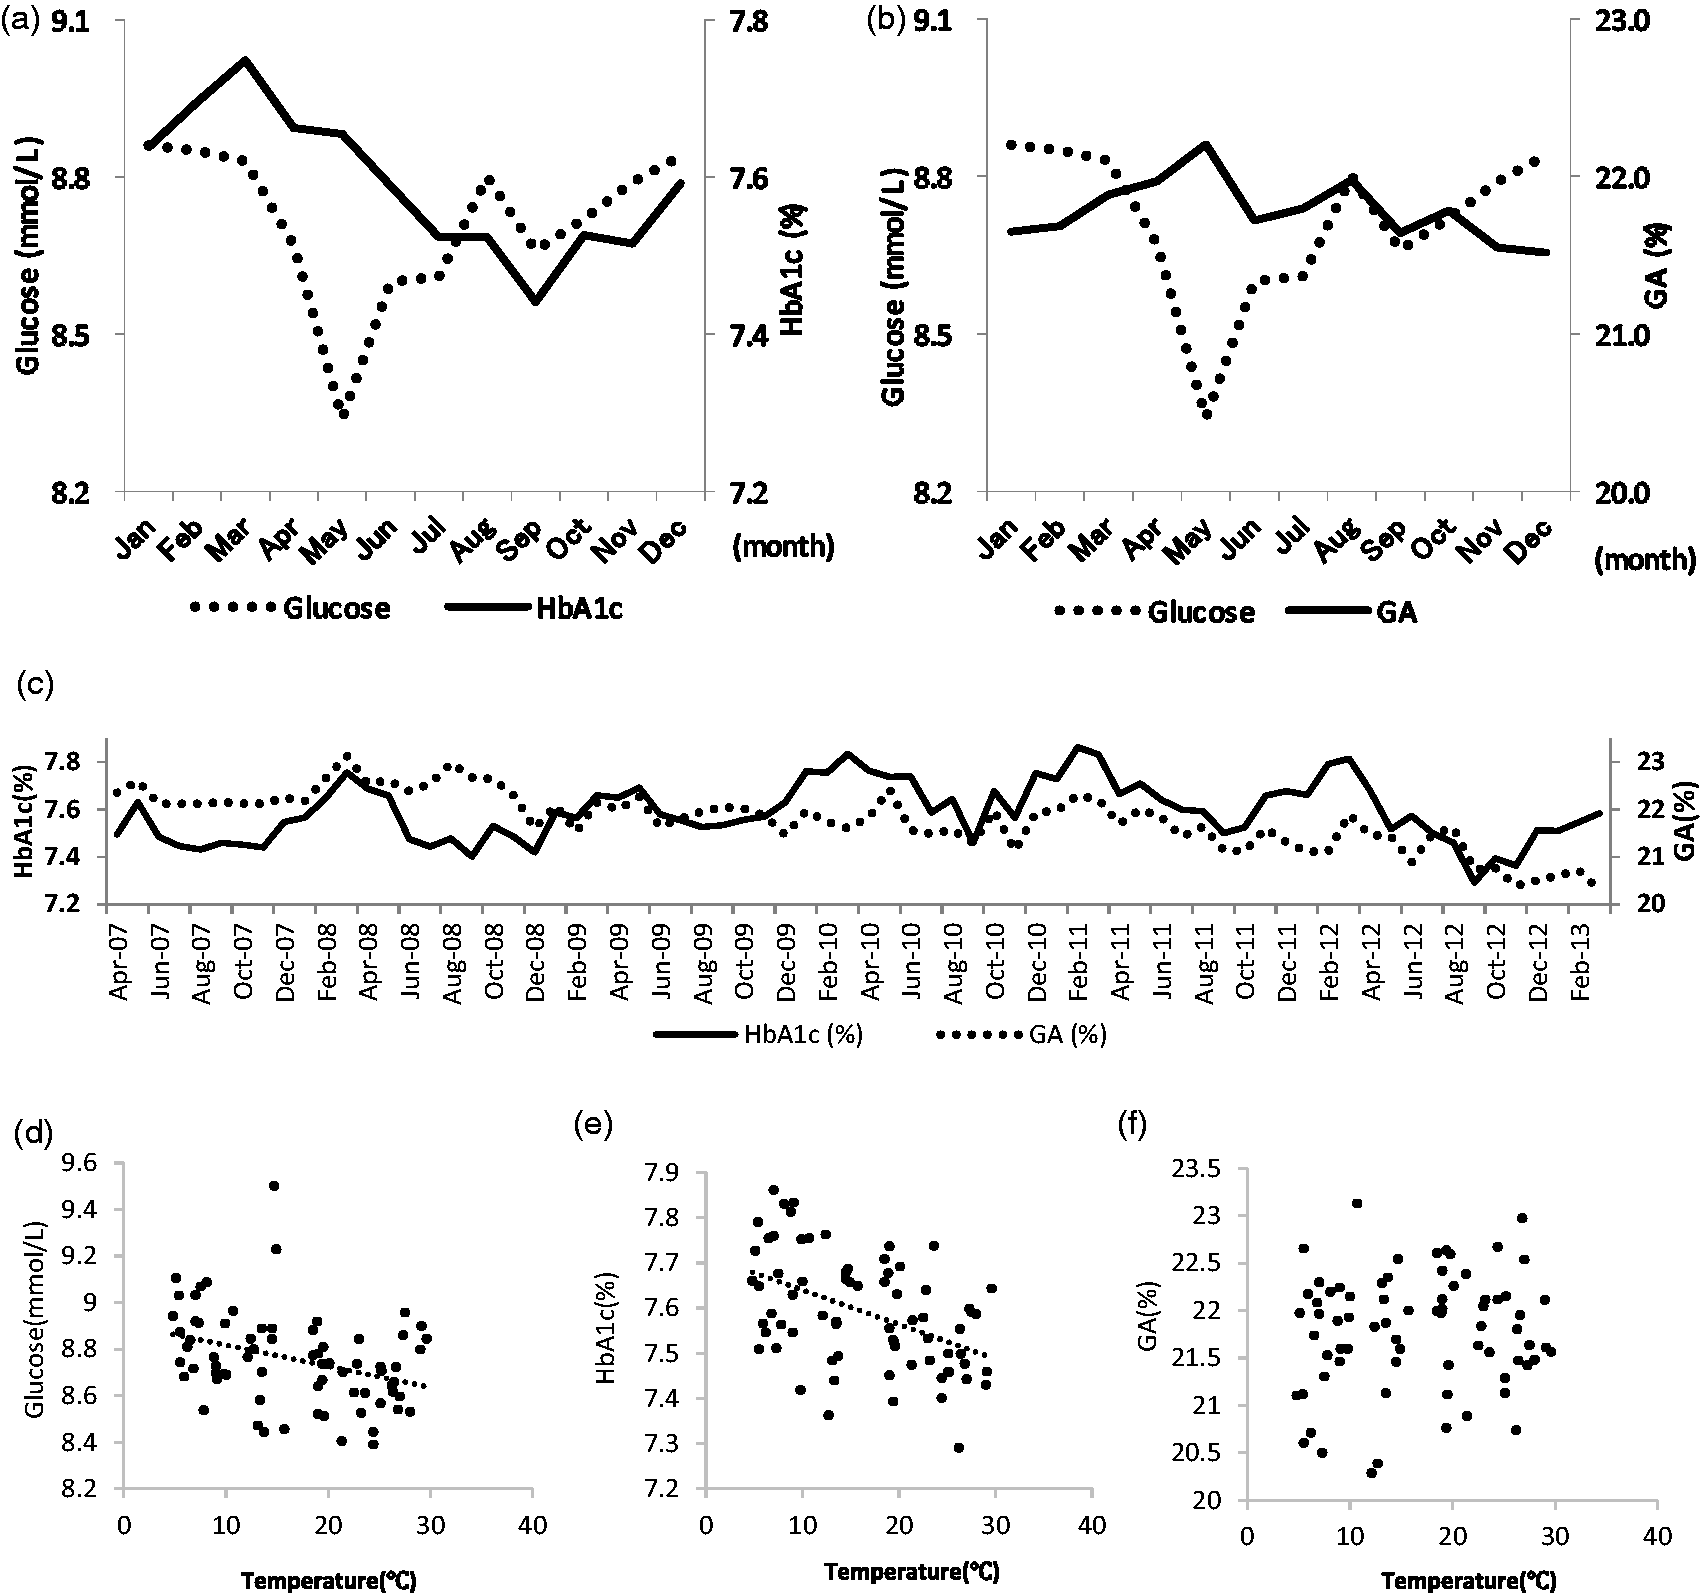
Monthly averages of HbA1c (a), glycated albumin (b), and plasma glucose in the combined calendar month over six years. PG was highest in January and lowest in May. It then reascended in August and declined in September. HbA1c was highest in March and lowest in September (a). GA was highest in May and lowest in December. It also reascended in August then declined in September (b). Monthly averages of HbA1c and glycated albumin in the separated calendar month over six years (c). HbA1c had similar variation (higher in winter, lower in summer) every year, but GA did not. Correlation diagrams between plasma glucose (d), HbA1c (e), glycated albumin (f) and monthly mean temperature in Tokyo. There are 72 plots, one for every month over six years. PG and HbA1c showed significant negative correlations with monthly mean temperature in (rs = −0.359, P < 0.001, rs = −0.449, P < 0.001, respectively), but GA did not.
Figure 1(c) shows the monthly averages of HbA1c and GA in the separated calendar months over the six years. HbA1c had similar variation (higher in winter, lower in summer) every year, but GA did not.
Figure 1(d) to (f) shows the correlation diagrams among PG, HbA1c, GA and monthly mean temperature in Tokyo. There are 72 plots, one for every month over six years. PG and HbA1c showed significant negative correlations with temperature (rs = −0.359, P < 0.001, rs = −0.449, P < 0.001, respectively), but GA did not.
However, GA was inter-correlated with PG (rs = 0.396, P < 0.001) and HbA1c (rs = 0.685, P < 0.001), and HbA1c was inter-correlated with PG (rs = 0.465, P < 0.001).
Conclusion
This is the first report for the seasonal variation of GA in the subjects with diabetes mellitus. Contrary to our presumption, this study revealed that the seasonal variation of GA was different from that of HbA1c, although they were highly correlated each other.
The explanation of seasonal fluctuation in HbA1c has been reported in many studies. Tseng et al. 11 and Sakura et al. 13 reported that HbA1c had seasonal variations and was well related to temperature. And those patterns of seasonal variation of HbA1c were consistent with our study findings.
Higgins et al. evaluated HbA1c data from eight different locations of the world and found that HbA1c was higher in cooler months and lower in the warmer months. They concluded that the difference in HbA1c over a year appears to be related to the difference in temperature. 12
Seasonal variation of GA has not been reported in previous studies. GA had no cyclic seasonal variation and no correlation with temperature in our study. However, previous studies showed that GA is correlated with HbA1c. 7 Indeed, in our study, it was demonstrated that GA was inter-correlated with PG and HbA1c, and HbA1c was inter-correlated with glucose.
While HbA1c is influenced by haemoglobin metabolism, GA is affected by albumin metabolism. 7 Therefore, GA value may be higher in patients with liver cirrhosis and hypothyroidism, lower with nephrotic syndrome and hyperthyroidism.
However, we suppose that these factors would not contribute greatly to the difference in seasonal variation between GA and HbA1c, because the population who had such conditions was not so high and we repeated the tests in almost the same population in our study. At present, the cause of difference in seasonal variation between them remains unidentified.
GA gets noticed as a new glycaemic indicator which can be useful in patients with renal anaemia or variant haemoglobin, whose HbA1c may be inaccurate. 7 Indeed, it was established that GA was useful for predicting diabetic complications in DCCT/EDIC study 9 and it was a risk factor for mortality and morbidity in haemodialysis patients with diabetes. 17 Our study did not disprove the usefulness of GA which was established in such qualified clinical studies. However, our study supposed that we cautiously interpret the result of GA, as there were some differences between HbA1c and GA from unknown origin.
In conclusion, GA and HbA1c showed different seasonal variations from each other over the six-year study period. They do not necessarily have same relationship with glucose elevation. Physiological and metabolic factors, related to temperature such as lack of exercise, overeating and increased plasma cortisol in winter might induce the seasonal variations in glucose and HbA1c values. Thus, further studies to identify factors that contribute to GA are needed.
Footnotes
Acknowledgements
The authors would like to thank Honyaku Center Co., Ltd and Christopher Brière for their respective assistance for English proofreading.
Declaration of conflicting interests
The author(s) declared no potential conflicts of interest with respect to the research, authorship, and/or publication of this article.
Funding
The author(s) disclosed receipt of the following financial support for the research, authorship, and/or publication of this article: SM received a scholarship grant from Asahi Kasei Corp.
Ethical approval
The ethics committee of Keio University approved this study (ID: 2010–0260).
Guarantor
SM.
Contributorship
SM and KT designed and performed this clinical study. KT and SM wrote the manuscript. HI, MT, JI, YS supervised the project. All authors read and approved the final manuscript.