
Abstract
Background
Glycated albumin, in contrast to glycated haemoglobin, precisely reflects glycaemic control and predicts all-cause mortality in haemodialysis patients with diabetes mellitus. However, whether those associations exist in diabetes mellitus patients receiving peritoneal dialysis remains unclear.
Methods
This was a retrospective cross-sectional and longitudinal observational study. We measured glycated albumin, glycated haemoglobin and casual plasma glucose for two months in diabetes mellitus-peritoneal dialysis (n = 44) and diabetes mellitus-haemodialysis (n = 88) patients (age-, gender-matched). The diabetes mellitus-peritoneal dialysis patients were followed for three years to monitor occurrence of all-cause mortality.
Results
Glycated albumin and glycated albumin/casual plasma glucose ratios, but not casual plasma glucose, glycated haemoglobin, or glycated haemoglobin/casual plasma glucose, were significantly lower in the diabetes mellitus-peritoneal dialysis as compared with the diabetes mellitus-haemodialysis patients. The regression lines between casual plasma glucose and glycated albumin showed a significant parallel shift downwards in diabetes mellitus-peritoneal dialysis as compared with diabetes mellitus-haemodialysis patients, while the slope did not differ significantly between the groups, resulting in underestimation of glycaemic control by 4.5%. Kapan-Meier analysis of the diabetes mellitus-peritoneal dialysis patients revealed that higher glycated albumin (median >18.0%), but not glycated haemoglobin (median >6.6%), indicated significantly elevated risk for all-cause mortality, which occurred in 15 patients (34.1%), as compared with those with a lower glycated albumin concentration. Higher glycated albumin concentration was also significantly and independently associated with all-cause mortality in multivariate Cox proportional hazards analysis.
Conclusions
Glycated albumin, in contrast to glycated haemoglobin, more precisely reflects glycaemic control in diabetes mellitus-peritoneal dialysis patients, based on its significant association with all-cause mortality. Furthermore, adjustment of the true glycated albumin concentration by adding 4.5% might provide a more precise measurement for determining glycaemic control in such patients.
Background
Glycated haemoglobin (HbA1c) is widely used as a marker of glycaemic control, although it is known to be influenced by the lifespan of red blood cells. 1 In patients with advanced chronic kidney disease (CKD) or receiving dialysis, it is becoming increasingly recognized that HbA1c measurement might underestimate glycaemic condition due to anaemia, use of erythropoiesis stimulating agents (ESA) and/or iron, independent of glycaemic control. 2 We previously demonstrated that glycated albumin (GA), which is not influenced by the lifespan of red blood cells, provides a significantly better estimate of glycaemic control in haemodialysis (HD) patients with diabetes mellitus (DM) as compared with HbA1c.3,4 On the other hand, subjects with increased albumin metabolism are considered to have lower GA values, due to the shortened time of serum albumin exposure to glucose in plasma. 5 Patients receiving peritoneal dialysis (PD) lose protein in peritoneal dialysate or urine; thus, it is possible that increased albumin turnover can falsely suppress GA in PD patients with DM, making it unclear whether GA and/or HbA1c are reliable markers of glycaemic control in DM-PD patients.
Strict glycaemic control has favourable effects not only on diabetes complications6–8 but also cardiovascular disease, a leading cause of death in DM patients.9–11 We previously found that GA, but not HbA1c, is independently and positively associated with pulse wave velocity and peripheral vascular calcification in DM-HD patients.12,13 In addition, we reported that GA predicts all-cause mortality, 14 which is confirmed by other studies that clearly demonstrated that GA, rather than HbA1c, precisely predicts all-cause mortality in DM-HD patients, 15 likely because it accurately reflects glycaemic control status. Although a recent study showed that GA, but not HbA1c, predicts all-cause mortality in DM-PD patients, 16 no comparisons of GA with HbA1c or plasma glucose were performed because of a lack of simultaneous measurements of the three markers. In the present investigation, those three glycaemic markers were simultaneously determined; thus, this is the first study to precisely assess the clinical significance of GA as a marker for glycaemic control as well as predictor of all-cause mortality in DM-PD patients.
Methods
Subjects and study design
This was a retrospective cross-sectional and longitudinal observational study. The entry criteria for this study included diagnosis of DM-PD in patients who had been treated while in a stable condition at the Inoue Hospital, and whose therapeutic regimen for DM had not been altered during the preceding six months and weekly dose of ESA had not been changing during the preceding three months prior to simultaneous determination of GA and HbA1c (n = 51). Those who had been receiving dialysis therapy for less than six months were excluded (n = 2). Furthermore, patients with liver cirrhosis, malignancy, infection, acute illness or history of peritonitis were also excluded from the analysis (n = 5). As a result, 44 DM-PD patients (32 males, 12 females) were enrolled as subjects in the present study. We previously performed a cross-sectional study (Osaka CKD Expert Research) that included 538 DM-HD patients who also underwent simultaneous measurements of GA and HbA1c, and whose therapeutic regimen for DM and weekly dose of ESA had not been altered during the preceding six and three months, respectively, prior to those measurements. That study aimed to assess whether GA might provide a better indication as compared with HbA1c of glycaemic control in DM-HD patients. 3 Corresponding to the present 44 enrolled patients, we sequentially selected 88 age- and gender-matched DM-HD patients from the Osaka CKD Expert Research cohort for analysis. The diagnosis of DM was based on history of diabetes or criteria presented in the Report of the Expert Committee on the Diagnosis and Classification of Diabetes Mellitus. 17
The present study was conducted in accordance with the principles of the Declaration of Helsinki and retrospectively approved by the Ethics Committee of Inoue Hospital (approval no. 219). Institutional approval for an opt-out consent method was given because of the observational nature (retrospective analysis) of this study.
Laboratory measurements
Blood was drawn without overnight fasting from DM-PD patients between 8:00 and 10:00 am, and from DM-HD patients just prior to starting their first dialysis session of the week. GA was measured with an enzymatic method using a Lucica GA-L kit (Asahi Kasei Pharma Corp., Tokyo, Japan), as previously reported.
18
Briefly, GA was hydrolysed to amino acids by albumin-specific proteinase and then oxidized by ketoamine oxidase to produce hydrogen peroxide, which was quantitatively measured. The GA value was calculated as the percentage of GA relative to total albumin, which was measured using the new bromocresol purple method.
18
GA assay findings are not influenced by the physiologic concentrations of ascorbic acid, bilirubin, or glucose up to 1000 mg/dL. HbA1c was measured by routine HPLC and latex agglutination immunoassay techniques, and was then standardized according to the method of the Japan Diabetes Society. HbA1c values were converted to National Glycohemoglobin Standardization Program equivalent values, according to the recommendations of the Japanese Diabetes Society and International Federation of Clinical Chemistry.
19
The mean values of three measurements of casual plasma glucose (CPG) obtained during the two months prior to determination of serum GA and HbA1c were used in the present analyses. We calculated Geriatric Nutritional Risk Index (GNRI) values based on serum albumin and body weight, as follows20–22

Outcome data collection
The DM-PD patients were followed for three years. At the end of the follow-up period, 18 patients were alive and receiving PD, 11 were transferred to HD and the remaining 15 had died.
Statistical analysis
Data are expressed as the mean ± standard deviation. A non-repeated t-test (continuous variables with normal distribution) and Fisher's exact test (categorical variables) were used to compare variables between groups. To compare variables between the three measured factors, we used one-way analysis of variance (ANOVA), followed by a Tukey-Kramer post hoc test. Pearson’s correlation test was used to determine correlations between continuous variables. Analysis of covariance was used to compare regression lines. Survival curves were estimated using the Kaplan-Meier analysis method with a log-rank test. A receiver operator characteristic (ROC) curve was constructed to identify the optimum cut-off value for predicting all-cause mortality. Prognostic variables for survival were examined using a Cox proportional hazards regression model. All statistical analyses were performed using the SPSS 22.0 statistical package for Windows (SPSS Inc., Chicago, IL, USA). All reported P values are two-tailed and were considered to be statistically significant at <0.05.
Results
Clinical characteristics of DM-PD and DM-HD patients
Table 1 shows the clinical characteristics of the 44 DM-PD and 88 DM-HD patients. The DM-PD group exhibited significantly lower concentrations of serum albumin and significantly shorter dialysis durations as compared with the DM-HD group, and also tended to have higher haemoglobin concentrations and body mass index (BMI). Although the average CPG concentration was not significantly different between the groups, GA was significantly lower and HbA1c tended to be higher in the DM-PD group. In addition, the GA/CPG and GA/HbA1c ratios were significantly lower in the DM-PD patients, while HbA1c/CPG ratio was not significantly different between the groups.
Clinical characteristics of the patients.
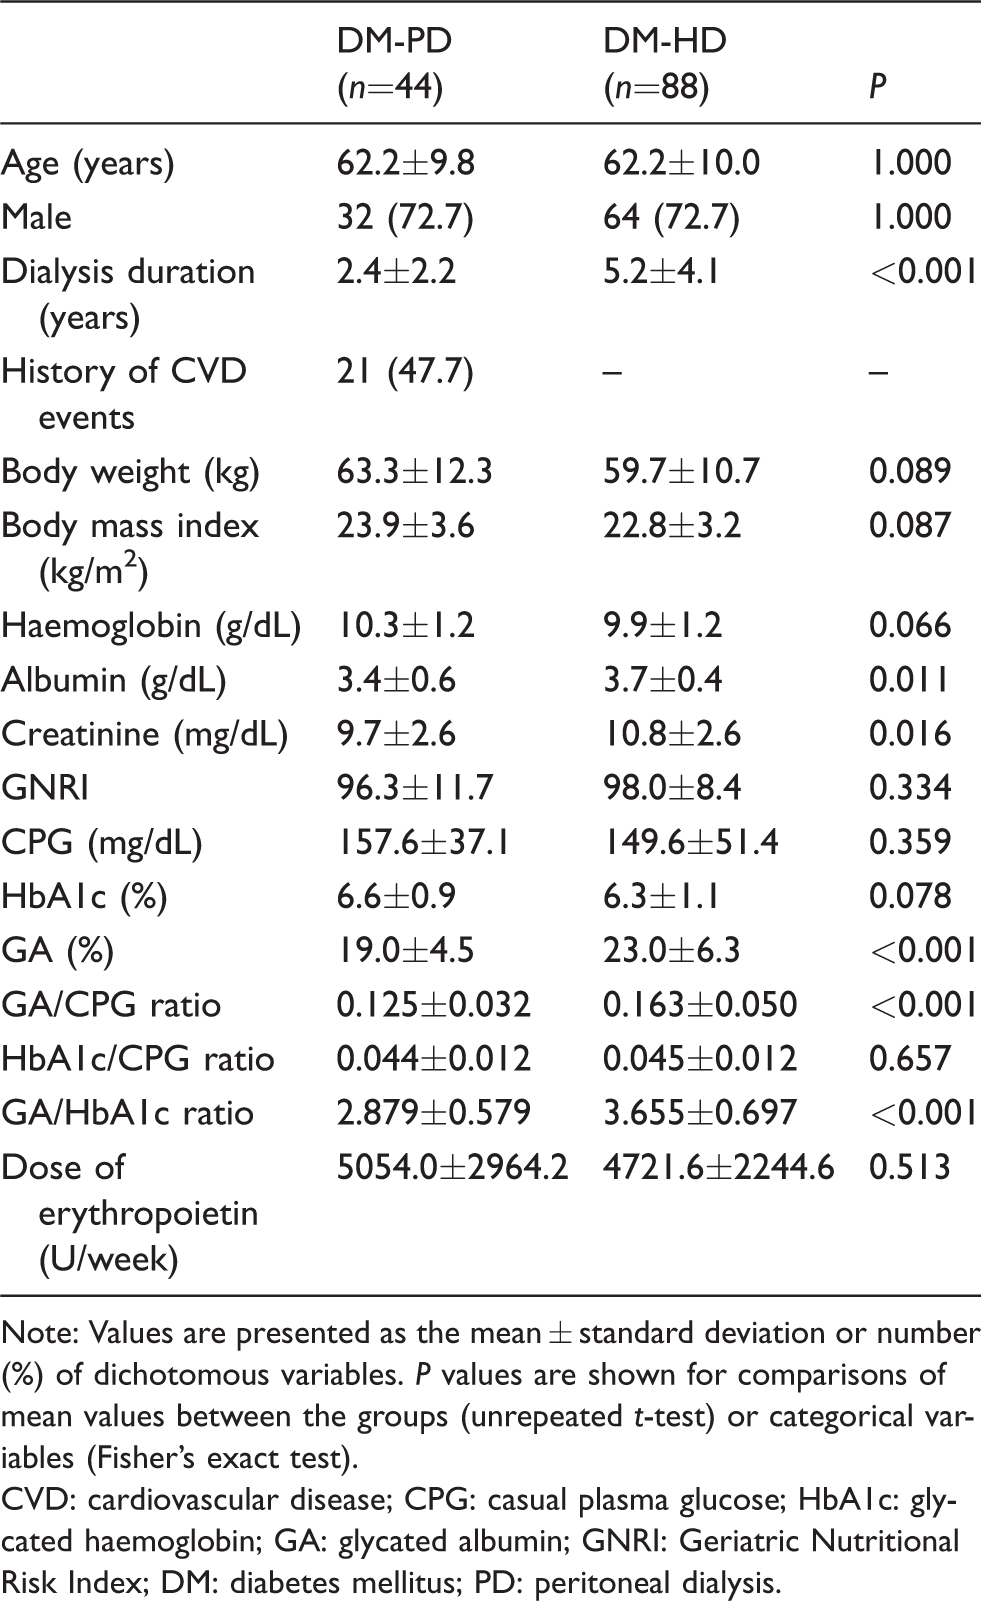
Note: Values are presented as the mean ± standard deviation or number (%) of dichotomous variables. P values are shown for comparisons of mean values between the groups (unrepeated t-test) or categorical variables (Fisher's exact test).
CVD: cardiovascular disease; CPG: casual plasma glucose; HbA1c: glycated haemoglobin; GA: glycated albumin; GNRI: Geriatric Nutritional Risk Index; DM: diabetes mellitus; PD: peritoneal dialysis.
CPG concentration variations during the two-month study period in DM-PD and DM-HD patients
CPG concentrations in the DM-PD patients obtained at two months and one month before and at the time (0 months) of the GA and HbA1c measurements were 162.5 ± 48.0, 165.3 ± 56.1 and 147.7 ± 40.6 mg/dL, respectively. Findings of one-way ANOVA did not indicate significant differences (P = 0.192), while those of the Tukey-Kramer post hoc test also showed that CPG in DM-PD patients was not significantly different among the three measurement time points (–2 vs. 0 months, P = 0.335; –1 vs. 0 months, P = 0.208; –2 vs. 1 month; P = 0.962). In the DM-HD patients, CPG concentrations were 152.6 ± 68.0, 144.0 ± 55.2 and 152.2 ± 63.3 mg/dL, respectively, at the three measurement time points. One-way ANOVA did not show significant differences (P = 0.537), and post hoc Tukey-Kramer test findings also showed that CPG in DM-HD patients was not significantly different among the three measurement time points (–2 vs. 0 months, P = 0.999; –1 vs. 0 months, P = 0.654; –2 vs. 1 month; P = 0.631). These results suggested that glycaemic control in both the DM-PD and DM-HD patients during the two-month examination period, which might have significant effects on HbA1c and GA, were stable enough to determine the association of the average CPG value during the prior two months with GA or HbA1c in such patients.
Correlation of CPG with GA and HbA1c in DM-PD and DM-HD patients
Figure 1 shows simple correlations of CPG with GA (Figure 1(a)) and HbA1c (Figure 1(b)) in DM-PD and DM-HD patients. Although the slope of the regression lines between CPG and GA did not differ significantly between the groups (P = 0.772), those lines for the DM-PD patients showed a significant downward direction as compared with those for the DM-HD patients (P < 0.001) (Figure 1(a)). On the other hand, the slope or position of the regression lines between CPG and HbA1c in both groups was nearly identical (Figure 1(b)).
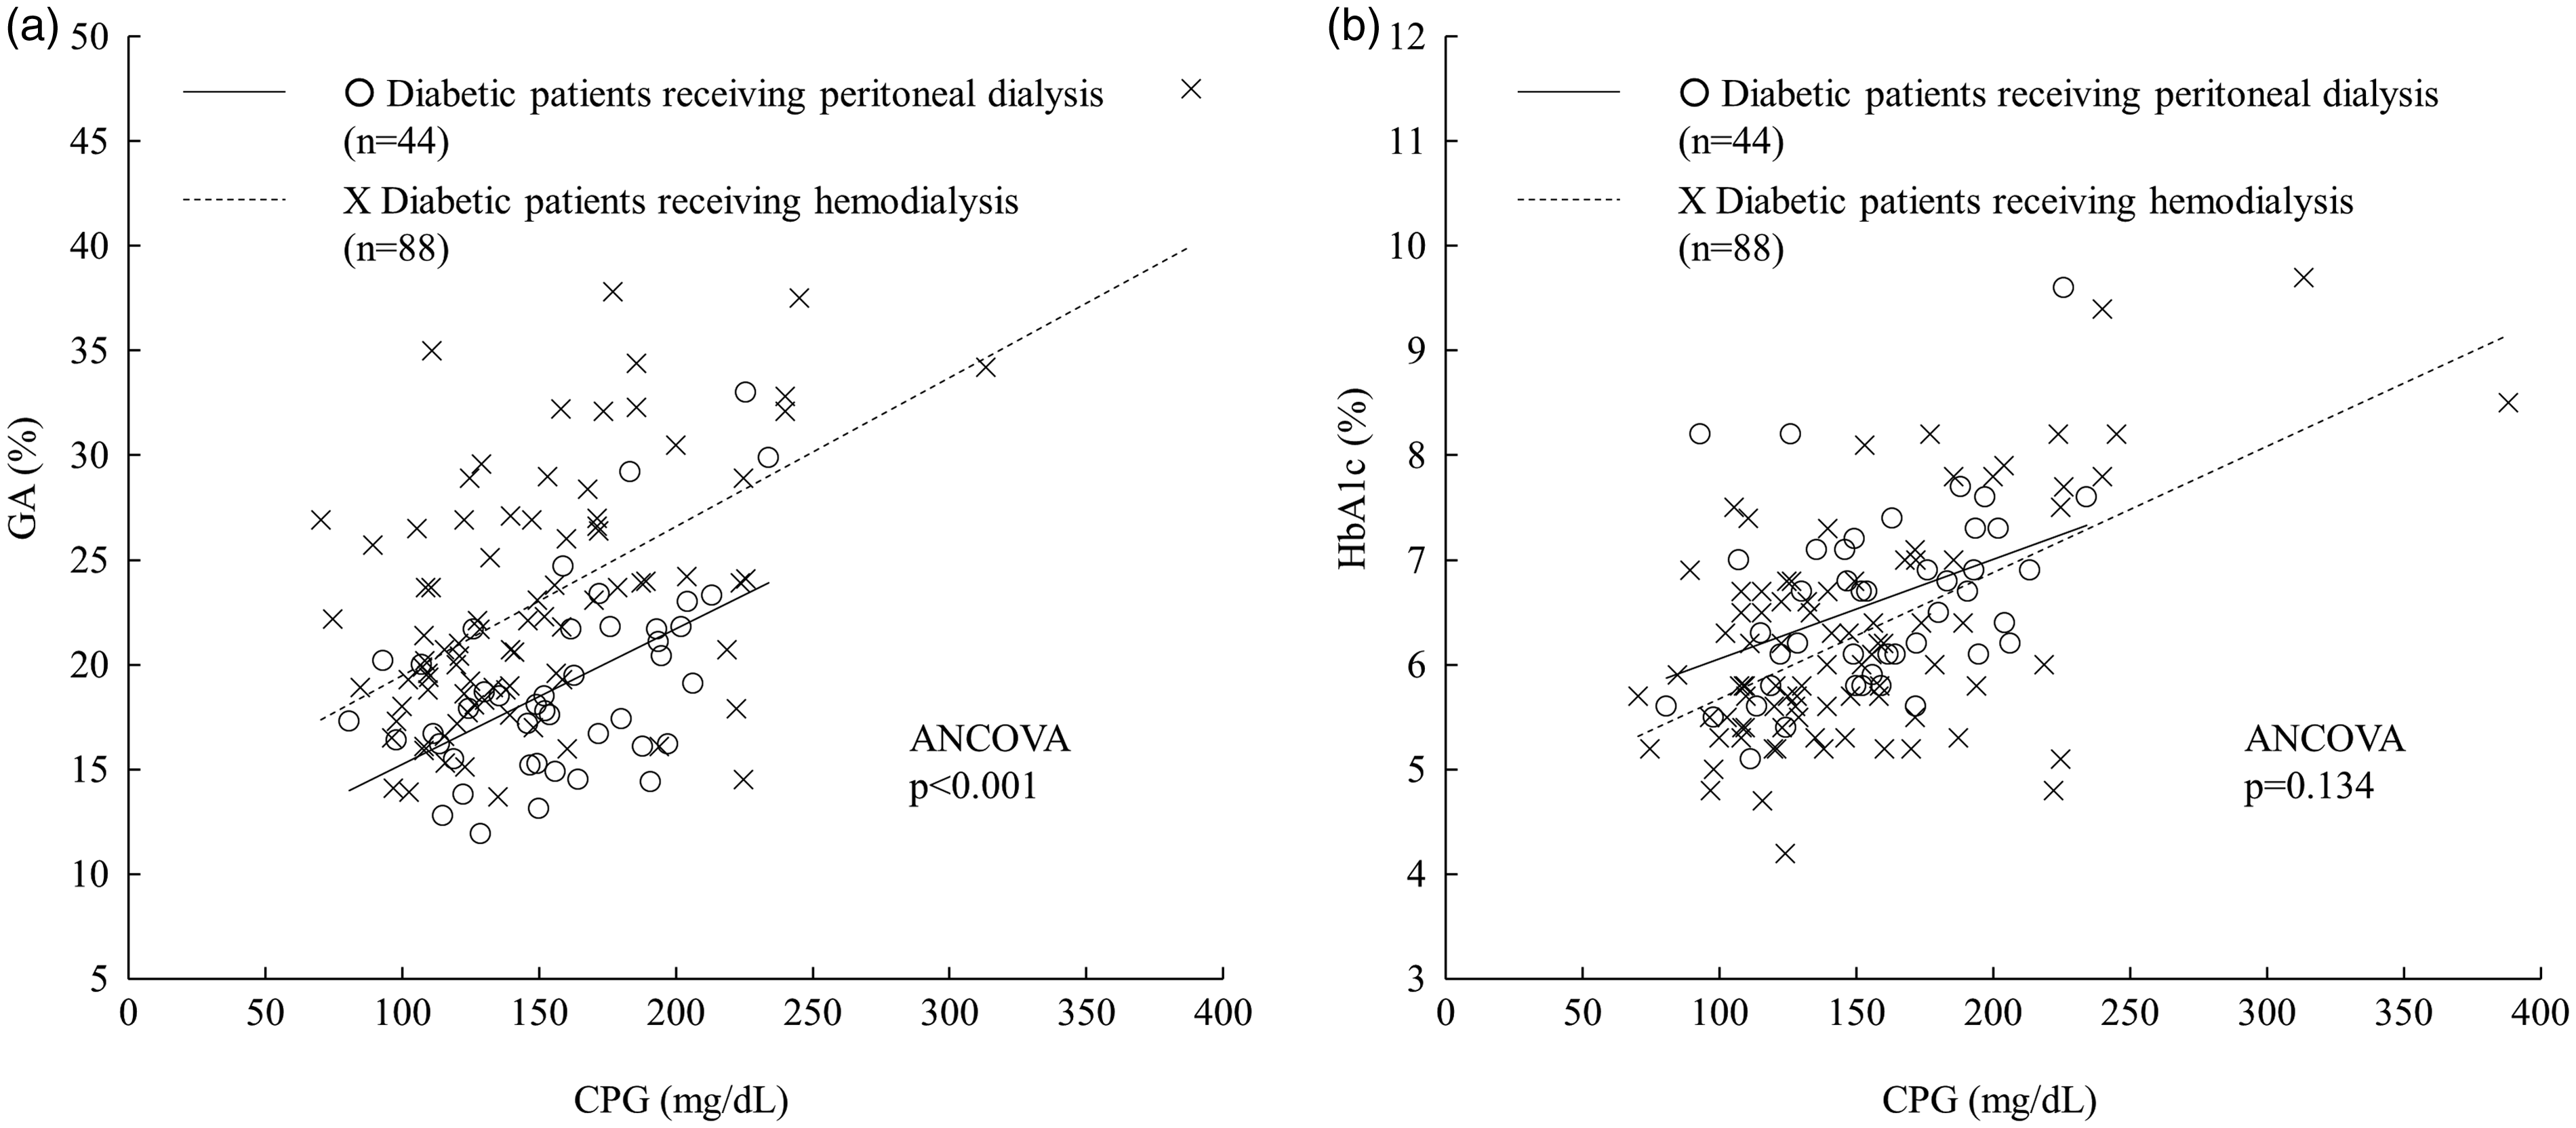
Correlations of CPG with GA and HbA1c in DM-PD and DM-HD patients. (a) Linear regression equations used. (1) Patients receiving peritoneal dialysis: y = 0.065x + 8.76, r = 0.538, P < 0.001; (2) Patients receiving haemodialysis: y = 0.071x + 12.39, r = 0.578, P < 0.001. Analysis of covariance (ANCOVA) findings indicated that the regression line was significantly different between the groups (P < 0.001). (b) Linear regression equations used: (1) Patients receiving peritoneal dialysis: y = 0.0095x + 5.107, r = 0.401, P = 0.007; (2) Patients receiving haemodialysis: y = 0.012x + 4.473, r = 0.582, P < 0.001. ANCOVA findings indicated that the regression line was not significantly different between the groups (P = 0.134).
Correlation of clinical parameters with GA in DM-PD patients
Among the clinical parameters examined, CPG (r = 0.538, P < 0.001) and HbA1c (r = 0.500, P = 0.001) were significantly and positively correlated with GA, whereas there was no correlation shown for age (r = 0.110, P = 0.478), gender (r = –0.039, P = 0.802), dialysis duration (r = –0.015, P = 0.925), serum albumin (r = –0.116, P = 0.455), serum creatinine (r = –0.055, P = 0.723), haemoglobin (r = –0.190, P = 0.216), BMI (r = –0.174, P = 0.260) or GNRI (r = –190, P = 0.217).
Association of clinical parameters with all-cause mortality in DM-PD patients
During the follow-up period of 36 months, 15 of 44 DM-PD patients died, including seven from cardiovascular causes (cardiovascular disease [n = 3], cerebrovascular disease [n = 4]) and eight from non-cardiovascular causes (infectious disease [n = 6], malignancy [n = 2]). When the DM-PD patients were divided into two subgroups based on the median levels of GA (18.0%), HbA1c (6.6%) and CPG (155 mg/dL), Kaplan-Meier analysis (Figure 2) showed that a higher GA value was positively associated with all-cause mortality, whereas higher HbA1c and CPG were not. ROC analysis also showed that GA had a greater AUC (AUC = 0.711, P = 0.023) to predict all-cause mortality as compared with that of HbA1c (AUC = 0.602, P = 0.271) and CPG (AUC = 0.632, P = 0.155) (Figure 3). The cut-off value for greatest sensitivity and specificity for GA was 18.0% (sensitivity 0.800, specificity 0.345), which was consistent with the median value of GA. To confirm the independent association of higher GA with all-cause mortality in DM-PD patients, multivariate Cox proportional hazards analyses were performed (Table 2). In model 2, which included higher GA and albumin as covariates, higher GA concentration and lower albumin concentration were significantly associated with all-cause mortality. When age, gender, dialysis duration, BMI, haemoglobin, past cardiovascular disease events, dose of erythropoietin, serum creatinine and GNRI were sequentially added to model 2 (models 3–11, respectively), higher GA remained significantly associated with greater mortality in all of the models.
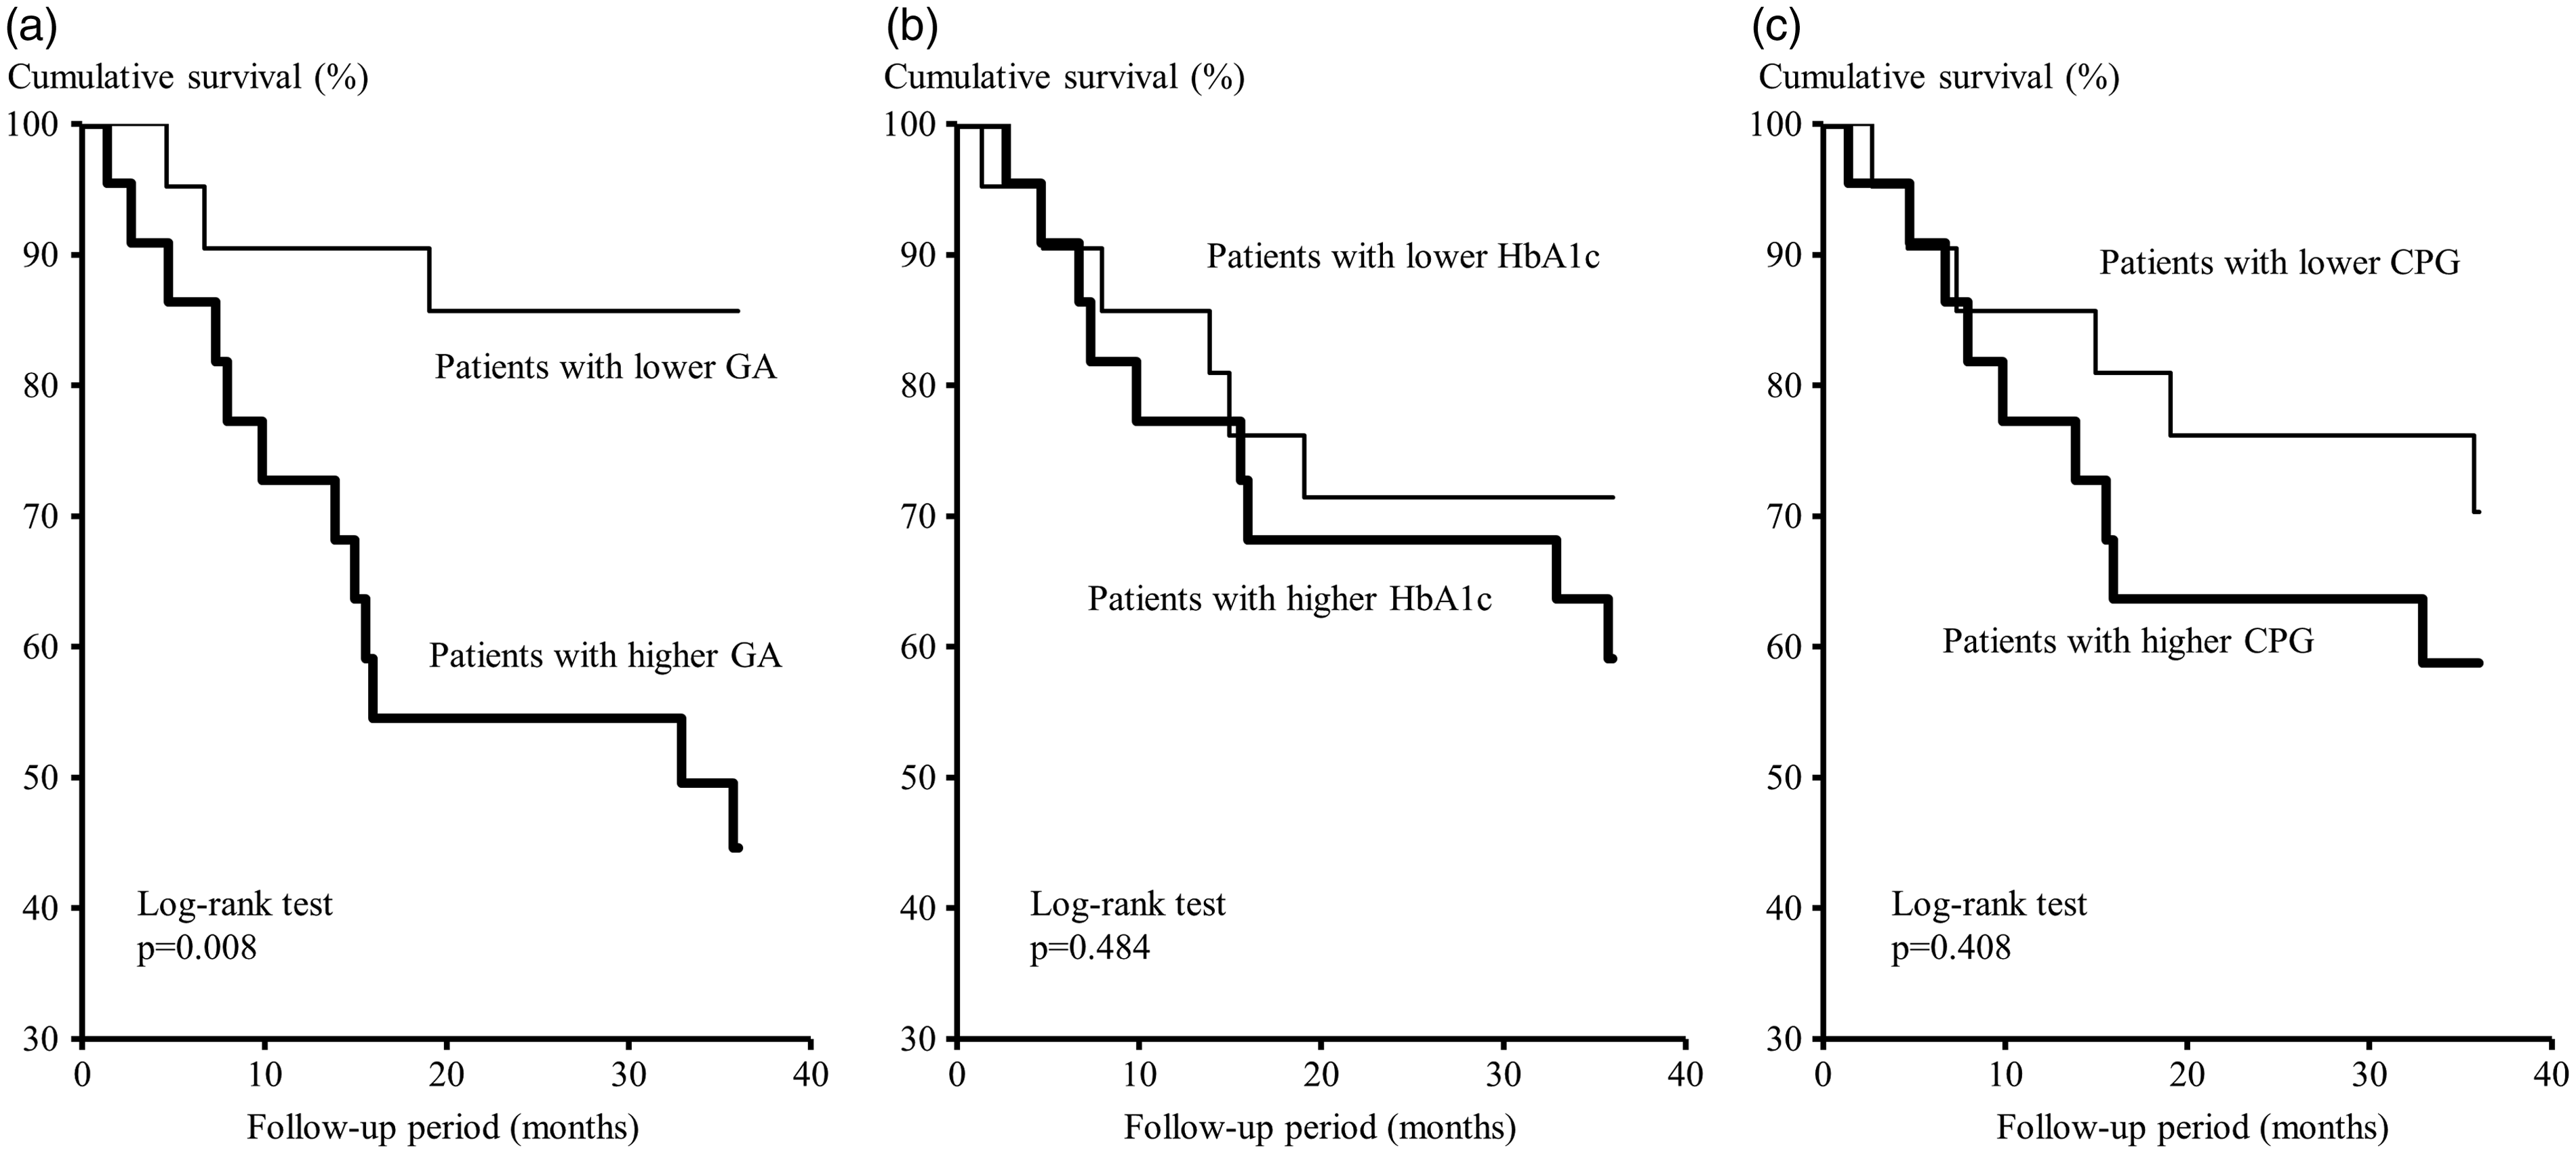
Findings of Kaplan-Meier analysis of associations of GA, HbA1c and CPG with all-cause mortality. The patients were divided into two groups according to the median values for GA (18.0%), CPG (155 mg/dL) and HbA1c (6.6%). Probability was analysed using a log-rank test.
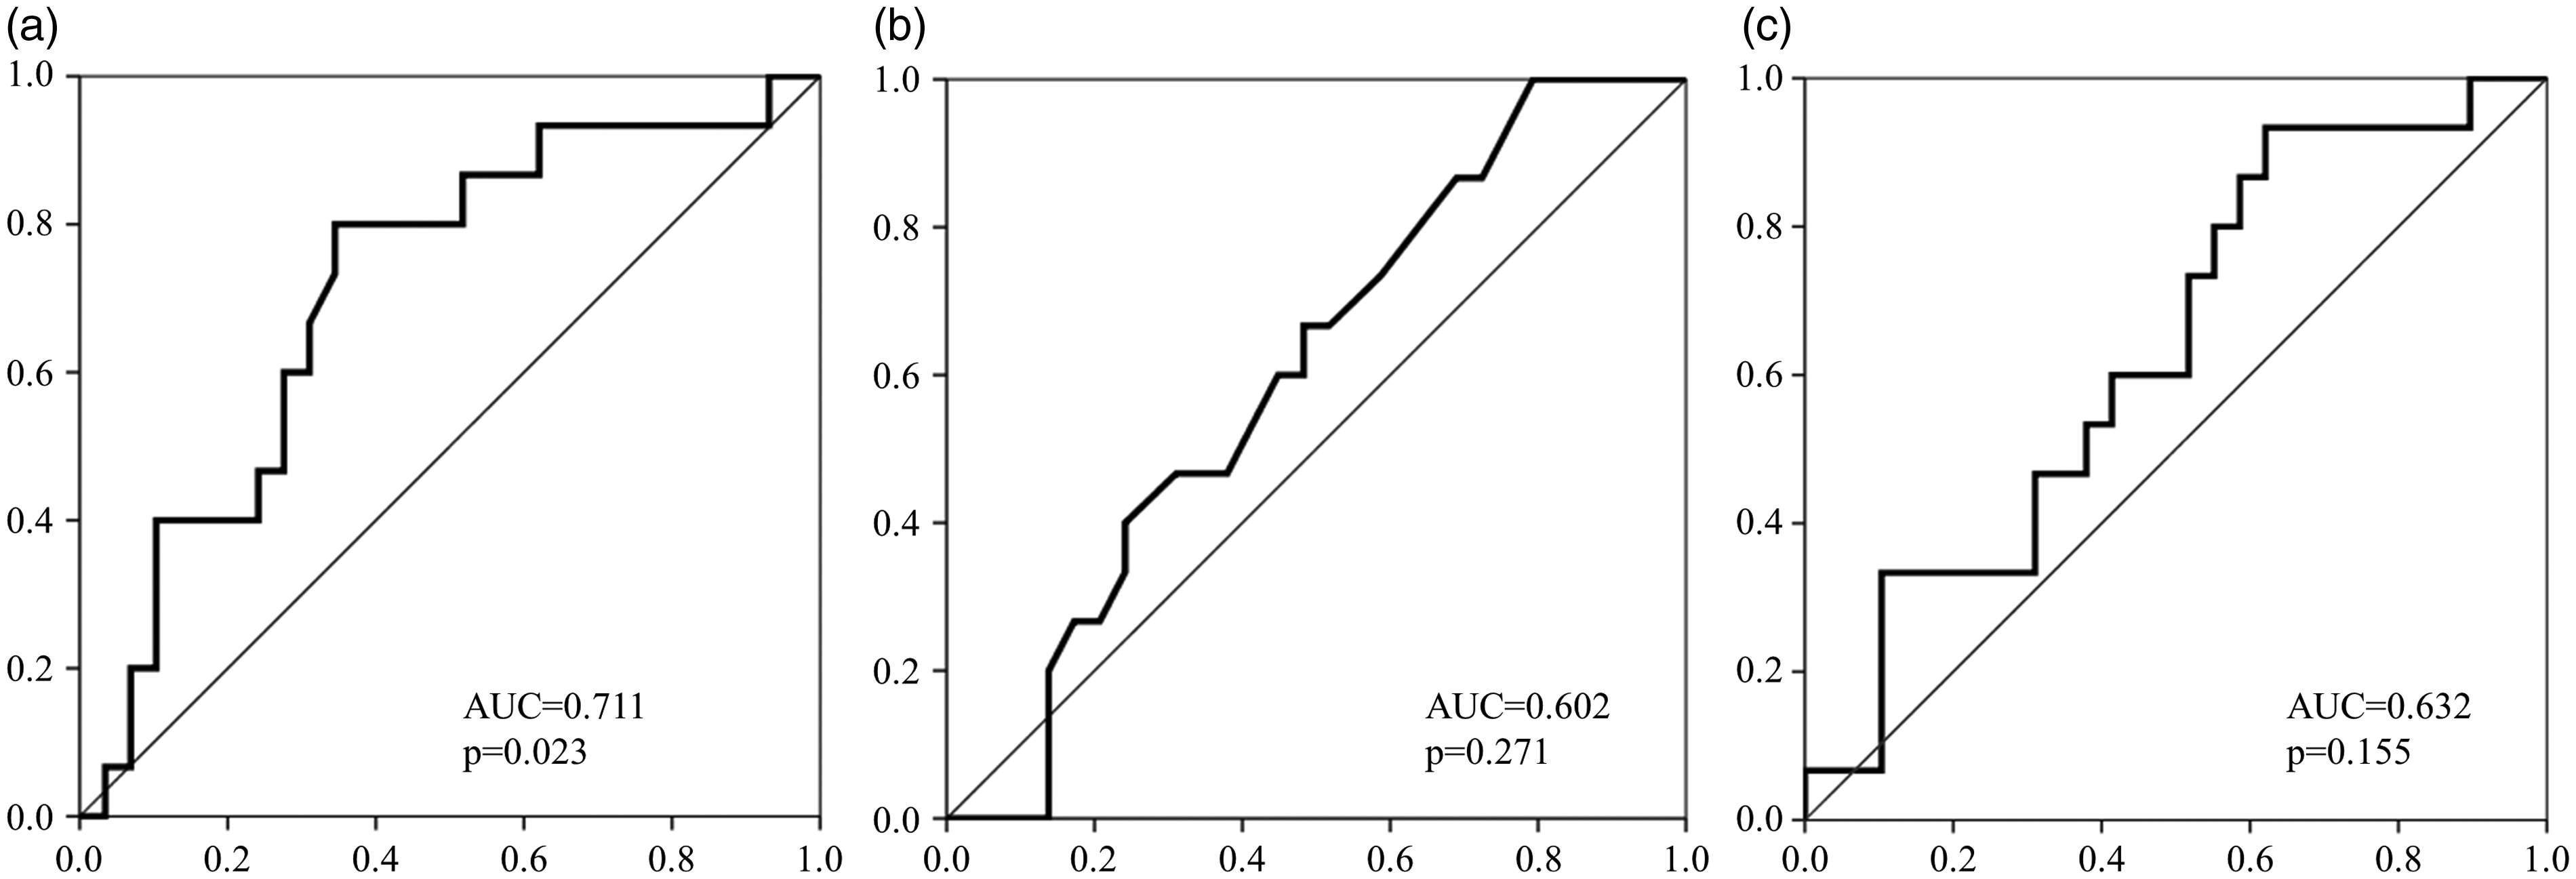
Receiver operating characteristic (ROC) curves for GA, HbA1c and CPG to predict all-cause mortality. (a) GA, (b) HbA1c, (c) CPG.
Independent association of higher GA concentration with all-cause mortality determined by multivariate Cox proportional analysis.
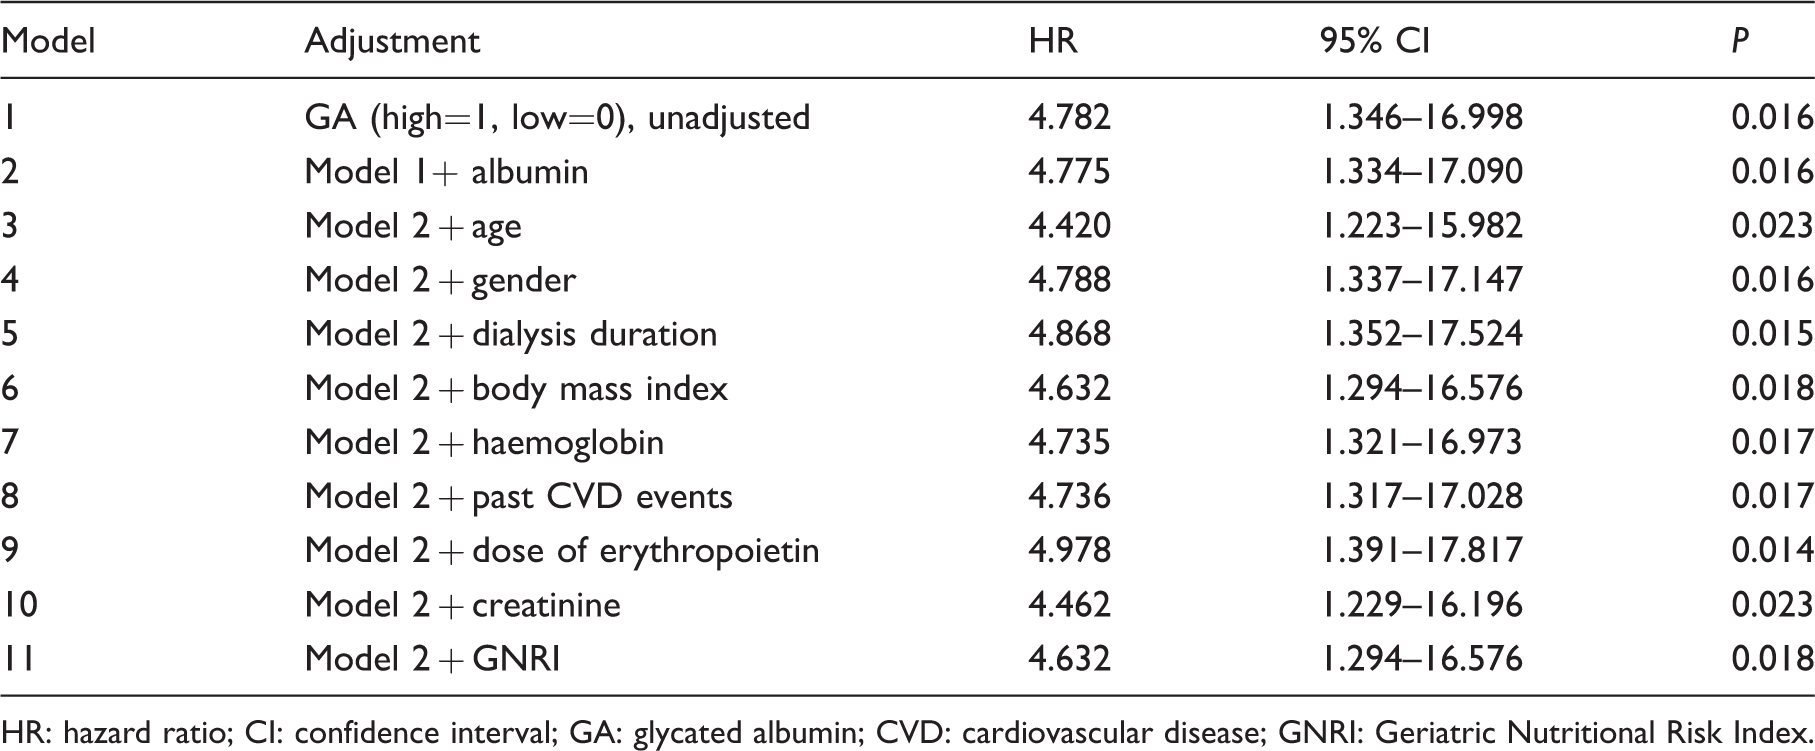
HR: hazard ratio; CI: confidence interval; GA: glycated albumin; CVD: cardiovascular disease; GNRI: Geriatric Nutritional Risk Index.
Discussion
In the present study, GA concentration and GA/CPG ratio were significantly lower in DM-PD as compared with DM-HD patients, while CPG was not significantly different between the groups. This suggests that GA was significantly low for CPG in the DM-PD patients as compared with the DM-HD patients. Interestingly, the regression lines between CPG and GA for the DM-PD and DM-HD patients were parallel, though shifted significantly downwards in the former as compared with the latter group. It seems that GA value may reflect glycaemic control in DM-PD patients as precisely as seen in DM-HD patients, although measured GA in DM-PD patients may lead to underestimation of glycaemic control (Figure 1). Furthermore, the present study showed that impaired glycaemic control in DM-PD patients determined by GA, but not HbA1c value is able to independently predict all-cause mortality (Table 2).
Other studies including ours3,4 have accumulated results, indicating that GA provides a more precise measurement to indicate glycaemic control than HbA1c in DM-HD patients. This conclusion is based on findings showing that suppression of HbA1c by renal anaemia, as well as the use of ESA and/or iron independent of glycaemic control can lead to an underestimation of glycaemic control in DM-HD patients. On the other hand, a large-scale cohort study of 850 DM-PD patients reported that HbA1c values were influenced not only by mean CPG but also by haemoglobin. 23 Therefore, since HbA1c may be suppressed by anaemia independent of glycaemic control in DM-PD patients, glycaemic control might be underestimated in anaemic DM-PD patients as compared with non-anaemic DM patients without CKD when estimated based on HbA1c. In the present study, the regression lines between HbA1c and CPG did not differ between the DM-HD and DM-PD groups, while the slope of those lines was significantly shallower than a regression line previously reported for non-CKD DM patients, 3 suggesting that HbA1c measurements might be falsely reduced by anaemia or ESA dosage in both DM-PD and DM-HD patients.
Previously, only a limited number of studies24–26 have examined the clinical significance of GA measurement for evaluation of glycaemic control in DM-PD patients. Although GA is not affected by anaemia or haemoglobin concentration, albumin metabolism is known to have an influence. 5 Low GA values have been observed in subjects with increased albumin metabolism, such as hyperthyroidism 27 and nephrotic syndrome, 28 due to the shortened exposure time of serum albumin to glucose in plasma. PD patients lose protein at a rate of approximately 5 g/day in peritoneal fluid and urine, 29 and albumin synthesis in the liver is stimulated to compensate for that loss, 30 resulting in a higher turnover of circulating albumin. Therefore, DM-PD patients are considered to exhibit low GA concentrations for their CPG as compared with DM non-PD patients, because of the shortened half-life of albumin in circulation. As expected, the present study found that GA and GA/CPG were significantly lower in DM-PD as compared with DM-HD patients (Table 1), as previously reported in investigations of DM-PD.24,25 Interestingly, we found a downward shift of the regression line without a significant change in the DM-PD as compared with the DM-HD group (Figure 1), suggesting that GA measurement retained its significance as a glycaemic marker, except for underestimation of glycaemic control in those patients. The present findings also confirm those of previous studies showing that serum albumin concentration was not correlated with GA concentration in DM-PD patients.24,26 Considering the parallel downward shift of the regression lines between GA and CPG in the DM-PD as compared with the DM-HD group, it seems that adjustment of the true GA concentration by adding 4.5% might provide more a precise measurement for determining glycaemic control in DM-PD patients.
We previously reported that GA, but not HbA1c, may be a significant measurement for determination of arterial wall stiffening 12 and peripheral vascular calcification 13 in DM-HD patients. Furthermore, several studies including ours14,15 have demonstrated that GA, rather than HbA1c, can precisely predict all-cause mortality in those patients. Consistent with a recent study showing that GA (≥20%) but not HbA1c concentration was associated with all-cause mortality in DM-PD patients, 16 the present results also showed that those patients with elevated GA (>18.0%), but not elevated HbA1c have a greater risk for death, which was independent of serum creatinine concentration as a marker of sarcopenic status 31 and GNRI as a marker of nutritional status.20–22 Furthermore, the adjusted cut-off value increased to 22.5%, when the GA concentration was adjusted (measured GA concentration +4.5%). Our previous report 14 as well as a large-scale epidemiological study 15 both showed that DM-HD patients with a GA concentration >20–21% have significantly higher risk for all-cause mortality; thus, the cut-off GA value to determine increased risk for all-cause mortality might be similar in DM-PD and DM-HD patients.
This study has some important limitations. First, it was retrospective in design, and the number of subjects was small. Also, peritoneal transport function and albumin loss were not fully measured. In addition, the study population consisted of nearly exclusively Japanese patients; thus, it is unclear whether these findings can be generalized for other ethnic groups. Nevertheless, the present study clearly indicated that GA is superior than HbA1c as an indicator of glycaemic control and all-cause mortality in DM-PD patients.
In conclusion, GA, in contrast to HbA1c, more precisely reflects glycaemic control in DM-PD patients, although GA concentration is consistently lower than the CPG concentration in DM-PD patients as compared with DM-HD patients. GA might be a better predictor of all-cause mortality in cases of DM-PD.
Footnotes
Declaration of conflicting interests
The author(s) declared no potential conflicts of interest with respect to the research, authorship, and/or publication of this article.
Funding
The author(s) received no financial support for the research, authorship, and/or publication of this article.
Ethical approval
The present study was approved by the Ethics Committee of Inoue Hospital (Approval No. 219).
Guarantor
MK.
Contributorship
MM researched literature, conceived the study, researched data and contributed to the discussions and edited the manuscript. MK and MI researched literature, contributed to the discussions, wrote and edited the article. KM, Senji O, Shigeki O, ME and YT contributed to the discussion, and reviewed and edited the article. All authors reviewed and edited the article and approved the final version of the article.