
Abstract
Background
The effect of alcohol consumption on glycaemic control indicators is not well known. In this study, we studied the effect of alcohol consumption on the plasma glucose and glycaemic control indicators in non-diabetic men.
Methods
The study enrolled 300 non-diabetic men who received a complete medical checkup (age: 52.8 ± 6.5 years, body mass index: 24.4 ± 2.8 kg/m2). The subjects were divided into four groups by the amount of alcohol consumed, and the plasma glucose, HbA1c, glycated albumin (GA) and 1,5-anhydroglucitol (1,5-AG) concentrations of the groups were compared.
Results
As the level of alcohol consumption increased, significantly high concentrations of fasting plasma glucose (FPG) were observed, and the oral glucose tolerance test 2-h plasma glucose concentrations tended to rise. While no significant effect of alcohol consumption on HbA1c, 1,5-AG, and the 1,5-AG/FPG ratio was observed, the HbA1c/FPG ratio, GA and the GA/FPG ratio exhibited significantly low values as the level of alcohol consumption increased. In stepwise multivariate regression analysis, alcohol consumption was a significant negative independent variable for HbA1c and GA, but not for 1,5-AG.
Conclusions
As the level of alcohol consumption increased, the plasma glucose concentrations rose, but the HbA1c and GA concentrations were lower compared with the plasma glucose concentrations. These findings suggest that alcohol consumption may reduce HbA1c and GA concentrations, but not 1,5-AG.
Introduction
Although a large amount of alcohol consumption poses risk of triggering the onset of diabetes, a small amount of alcohol consumption is known to reduce its risk.1,2 However, studies on Japanese and other Asian subjects have reported that even small amounts of alcohol accelerate the onset of diabetes.3–5 Therefore, it is believed that the effect of alcohol consumption on the risk of developing diabetes depends on factors such as the amount of alcohol consumption and race.
HbA1c, glycated albumin (GA), and 1,5-anhdroglucitol (1,5-AG) are the glycaemic control indicators that are currently used. 6 HbA1c and GA are both glycated proteins. HbA1c reflects the long-term plasma glucose, while GA reflects the intermediate-term plasma glucose. 1,5-AG is one of the polyols with the highest concentration concentrations in human serum, and the 1,5-AG concentrations in the serum reflect the amount of urine glucose that is excreted. Thus, 1,5-AG is known to reflect recent occurrences of hyperglycemia.
Some of reports released in the past state that those who drank large amounts of alcohol exhibited high HbA1c concentrations.7,8 This is the result of a phenomenon in which acetaldehyde, a product of the alcohol metabolism process, forms acetaldehyde-modified haemoglobin in the body and influences HbA1c concentrations measured using the high performance liquid chromatography (HPLC) method. Because the improved resolution of HPLC allows for the peak separation of HbA1c and acetaldehyde-modified haemoglobin, the latter no longer has any influence on the measurement of HbA1c. Recently, there have been some reports which indicate that alcohol consumption led to low HbA1c concentrations.9–11 However, these reports failed to fully discuss the association between HbA1c and plasma glucose. In addition, based on the results of our research, we have found no report about the impact of alcohol consumption on the GA or 1,5-AG concentrations.
In this work, we studied the effect of alcohol consumption on HbA1c, GA and 1,5AG by making comparisons with its effect on glucose tolerance.
Materials and methods
Study design and subjects
The study enrolled 300 non-diabetic men who received a complete medical checkup at the Kinki Central Hospital (age: 52.8 ± 6.5 years, body mass index [BMI]: 24.4 ± 2.8 kg/m2). Patients with kidney disease, liver disease, anaemia and other diseases that could influence glycaemic control indicators were excluded from the study. All subjects were asked to complete a questionnaire about their lifestyle habits, which included a question about the amount of alcohol they consumed. The patients were divided into four groups based on the amount of alcohol consumption indicated in the questionnaire: no alcohol, less than 20 g/day, 20 g/day to 39 g/day and 40 g/day or more. This study was approved by the Ethics Committee of Kinki Central Hospital, and informed written consent was obtained from all subjects.
Measurements
All subjects had a 75-g oral glucose tolerance test (OGTT) and their glucose tolerance status was diagnosed according to the American Diabetes Association guidelines. 12 Plasma glucose was determined by the hexokinase method. HbA1c, expressed in National Glycohemoglobin Standardization Program (NGSP) value, 13 was measured by HPLC. Serum GA was determined by the enzymatic method using albumin-specific proteinase, ketoamine oxidase and albumin assay reagent (Lucica GA-L: Asahi Kasei Pharma Co., Tokyo, Japan). Serum 1,5-AG was measured by the enzymatic method (Lana 1,5-AG Auto Liquid Kit: Nippon Kayaku, Tokyo, Japan). Other biochemical examinations were determined by conducting standard laboratory assays.
Statistical analyses
All the data are shown as means ± SD. Analysis of variance was used for the unadjusted comparisons of continuous variables among groups for the alcohol consumption, and the Bonferroni method was used to estimate the level of significance of differences between means. To analyse the effects of explanatory variables on HbA1c, GA and 1,5-AG, stepwise multivariate regression analysis was performed with age, BMI, FPG, OGTT 2-h plasma glucose, and alcohol consumption as explanatory variables using the StatView computer program (Version 5.0 for Windows, Abacus Concepts, Berkeley, CA). In the stepwise multiple regression analysis, the F value for the inclusion of the variables was set at 4.0. The P value of < 0.05 was considered to be statistically significant.
Results
Clinical characteristics of the study subjects.
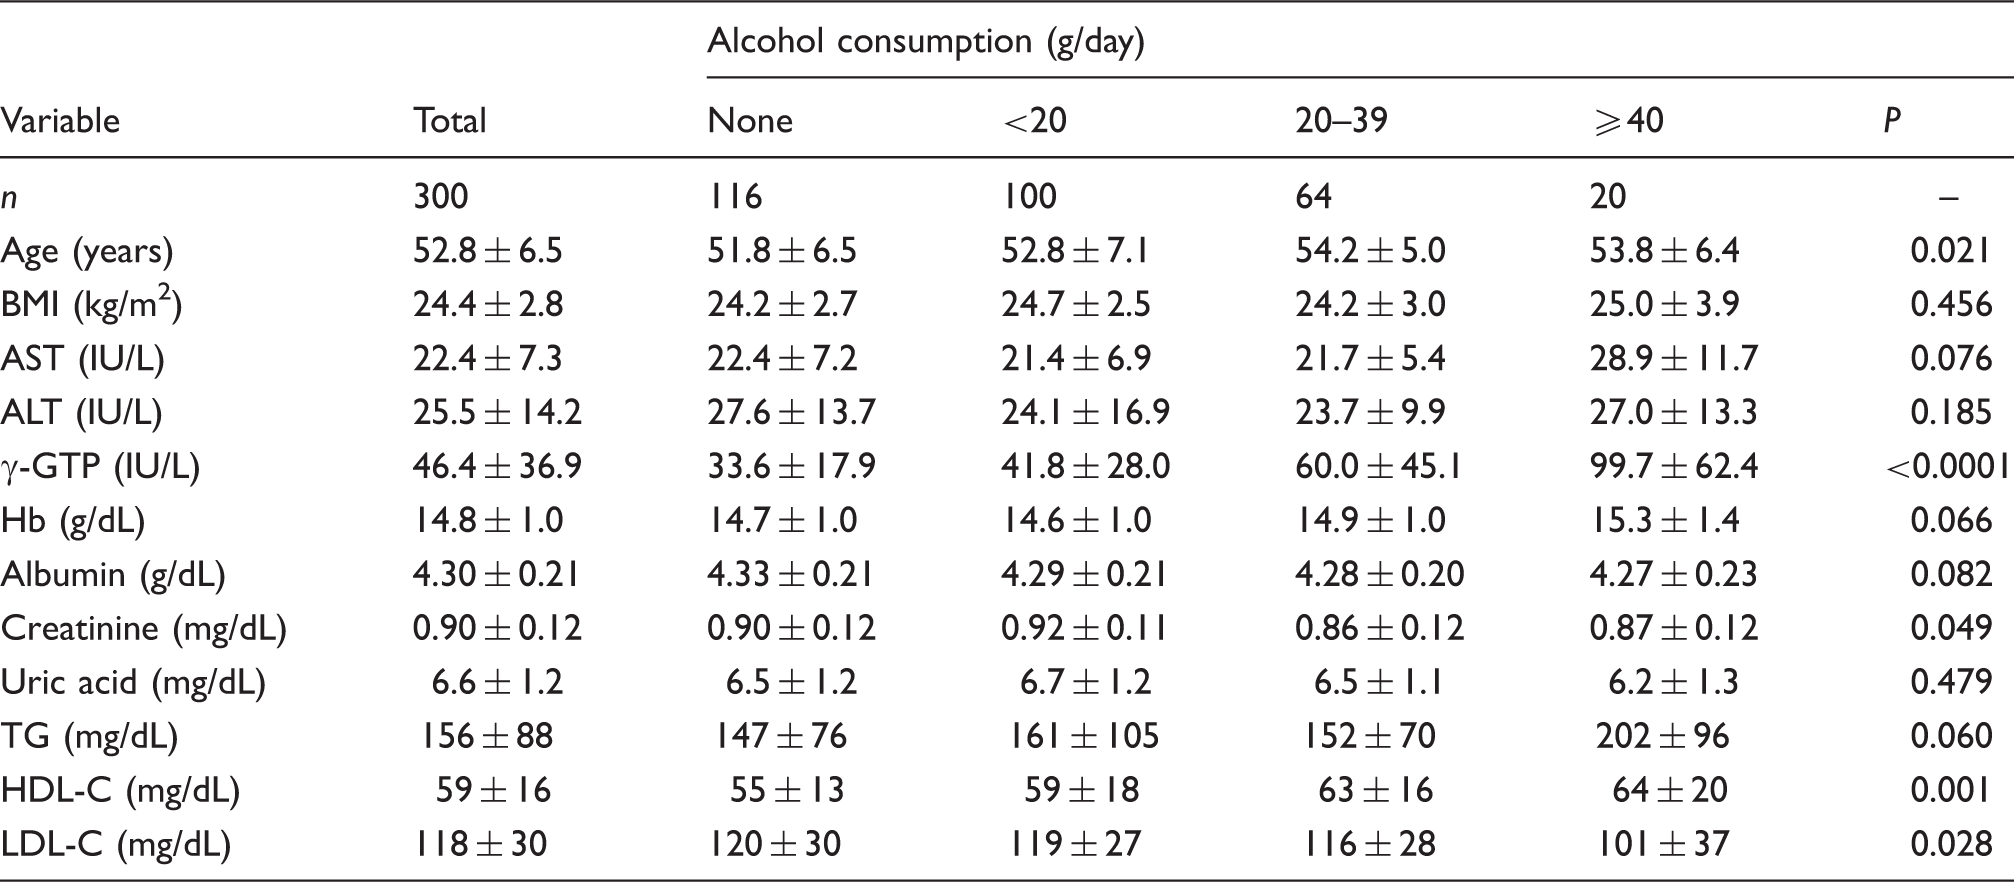
BMI: body mass index: AST: aspartate aminotransferase: ALT: alanine aminotransferase; γ-GTP: γ-glutamyltranspeptidase; TG: triacylglycerol; HDL-C: high density lipoprotein cholesterol; LDL-C: low density lipoprotein cholesterol.
Comparison of diabetes-related examinations among groups categorized by the level of alcohol consumption.
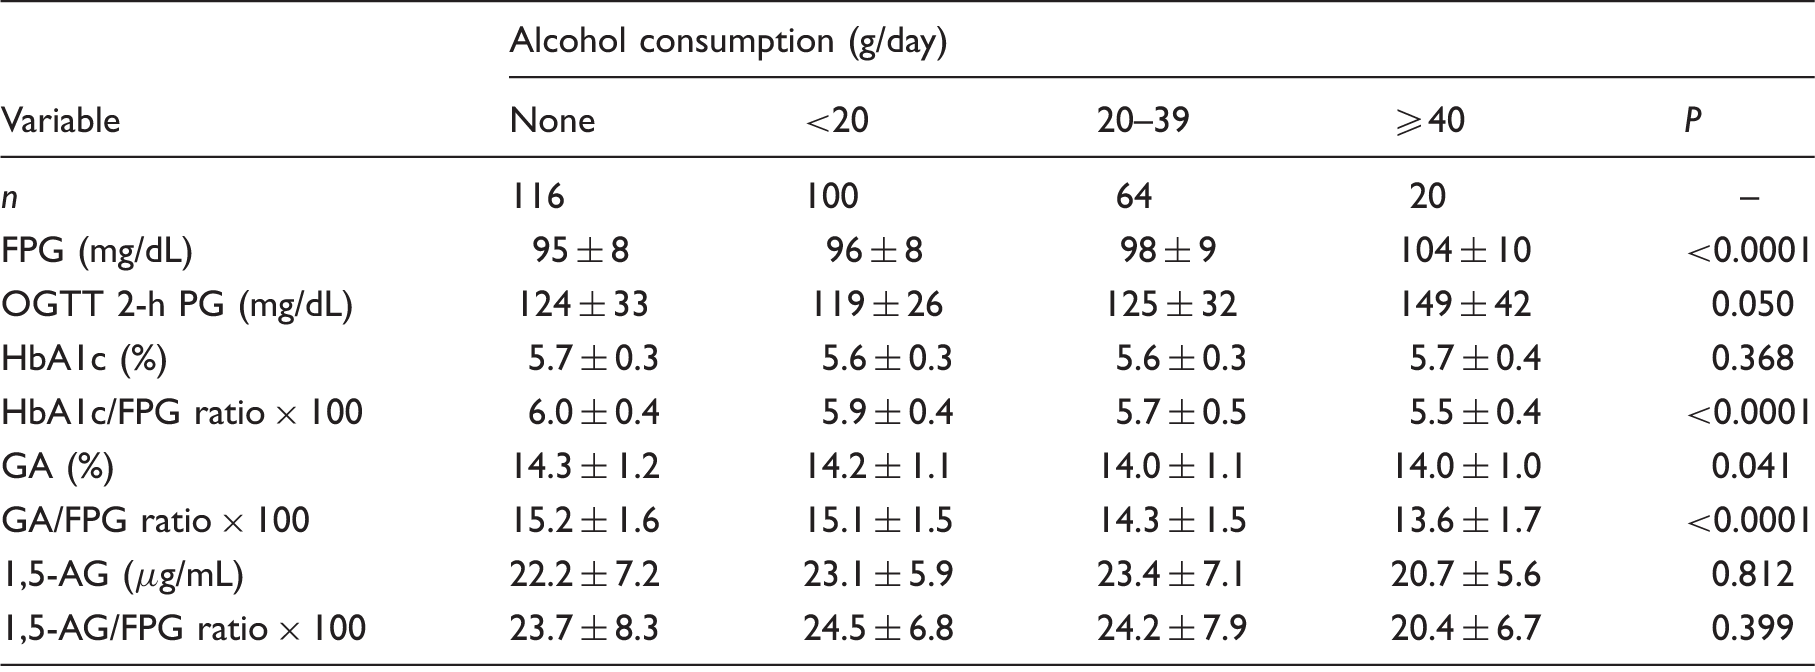
FPG: fasting plasma glucose; OGTT: oral glucose tolerance test; PG: plasma glucose; GA: glycated albumin; 1,5-AG: 1,5-anhydroglucitol.
Stepwise multivariate regression analysis on (A) HbA1c, (B) glycated albumin (GA), and (C) 1,5-anhydroglucitol (1,5-AG).
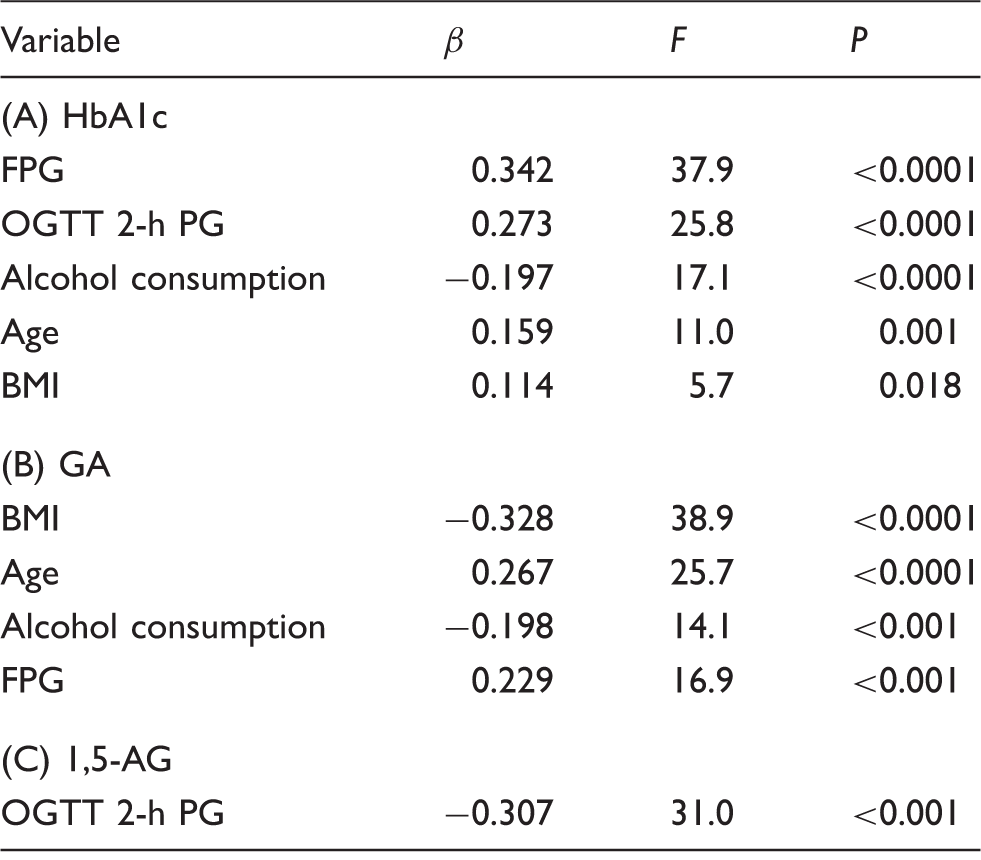
Explanatory variables included are age (years), body mass index (BMI) (kg/m2), fasting plasma glucose (FPG) (mg/dL), OGTT 2-h plasma glucose (PG) (mg/dL) and alcohol consumption (0: none, 1: <20 g/day, 2: 20–39 g/day, 3: ≥40 g/day). Model A: R2 = 0.617, F = 36.2 and P < 0.0001. Model B: R2 = 0.484, F = 22.6, and P < 0.0001. Model C: R2 = 0.307, F = 31.0, and P < 0.0001.
GA: glycated albumin; 1,5-AG: 1,5-anhydroglucitol; β: standard regression coefficient; F: exclusion F value.
Discussion
This study analysed the effect of alcohol consumption on glucose tolerance and glycaemic control indicators in non-diabetic men. As the level of alcohol consumption increased, plasma glucose concentrations rose and glucose tolerance deteriorated. The increase in alcohol consumption did not affect 1,5-AG, but led to significantly low values in the HbA1c/FPG ratio, GA, and the GA/HbA1c ratio. Furthermore, alcohol consumption was a significant negative independent variable for HbA1c and GA, but not for 1,5-AG. These findings suggest that alcohol consumption may decrease the concentrations of HbA1c and GA independent of the effect on plasma glucose.
The increase in alcohol consumption led to a significant increase in FPG, and a tendency towards an increase in the OGTT 2-h plasma glucose. These trends suggest that alcohol consumption may worsen glucose tolerance. Studies on subjects in Western countries reported that drinking small amounts of alcohol on a regular basis may improve glucose tolerance.1,2 On the other hand, studies on Japanese and other Asian subjects reported that even drinking small amounts of alcohol worsened glucose tolerance.3–5 It has also been reported that the onset of diabetes in obese subjects was inhibited or remained unchanged by drinking small amounts of alcohol, although an increase was observed in thinner subjects.14,15 We reported that alcohol consumption inhibited insulin secretion in Japanese men. 16 The insulin secretion capacity of Asian subjects is known to be inferior to that of Western subjects. 17 The insulin secretion capacity is also known to positively correlate with BMI. 18 Non-obese Asians experienced deteriorations in the insulin secretion capacity, and thus may be susceptible to suffering an adverse effect on glucose tolerance with even small amounts of alcohol.
Alcohol consumption did not have a significant effect on the HbA1c concentration, although it caused glucose tolerance to deteriorate. Therefore, we believed that correcting the drinking-induced deterioration of glucose tolerance would enable us to observe the direct effect of alcohol consumption on HbA1c. The HbA1c/FPG ratio was compared with the amount of alcohol consumed. This comparison revealed that the HbA1c/FPG ratio decreased significantly with the increase in alcohol consumption. The GA concentrations decreased significantly as the amount of alcohol consumption increased, while the GA/FPG ratio also decreased significantly. On the other hand, no significant effect of alcohol consumption on 1,5-AG and the 1.5-AD/FPG ratio was observed. In stepwise multivariate regression analysis, alcohol consumption was a significant explanatory variable for HbA1c and GA, but not for 1,5-AG. Because HbA1c and GA are also glycated proteins, the aforementioned phenomenon suggests that alcohol consumption may inhibit glycation, independent of the effect on glucose tolerance. It is reported that aspirin, which forms modified haemoglobin similar to acetaldehyde, reduces the HbA1c and GA concentrations by means of acetylation both in vitro and in vivo. 19 Acetaldehyde, a metabolic product of alcohol, is an extremely reactive substance because of its chemical structure, and thus induces reactions in many different proteins within a living organism. This led to assumption that acetaldehyde and other alcohol metabolic products may affect the Maillard early-stage reaction and inhibit glycation. According to reports by Rendell et al., 19 the acetylation of albumin was faster because of the difference between albumin and haemoglobin in acetylated sites. GA experienced a more pronounced level of production inhibition than HbA1c did. Our study observed a greater degree of decline in the GA concentrations than in the HbA1c concentrations, a trend that was consistent with the results of the study by Rendell et al. 19 On the other hand, in contrast to glycated proteins such as HbA1c and GA, 1,5-AG is a low-molecular polyol, and thus the effect of alcohol consumption on 1,5-AG or the 1,5-AG/FPG ratio was not observed.
There were some limitations to our study. First, it was a cross-sectional study, and thus was unable to demonstrate the causal relationships between alcohol consumption and glucose tolerance or glycaemic control indicators. The findings from our study need to be verified in prospective studies. Second, our data on alcohol consumption is based on questionnaire survey, and thus cannot rule out the possibility that some information was underreported. Third, this study did not go beyond an analysis based on alcohol consumption, and did not contain any analysis on the types of alcohol.
In conclusion, alcohol consumption deteriorates glucose tolerance, but aside from this effect, it does help to reduce the HbA1c and GA concentrations. As the level of alcohol consumption increased, the plasma glucose concentrations rose, but the HbA1c and GA concentrations were lower compared with the plasma glucose concentrations. These findings suggest that alcohol consumption may reduce HbA1c and GA concentrations, but not 1,5-AG.
Footnotes
Declaration of conflicting interests
The author(s) declared no potential conflicts of interest with respect to the research, authorship, and/or publication of this article.
Funding
The author(s) received no financial support for the research, authorship, and/or publication of this article.
Ethical approval
The ethics committee at Kinki Central Hospital (reference number, 175) approved this study.
Guarantor
MK.
Contributorship
SI researched literature, contributed to the discussion, wrote the first draft of the manuscript and edited the manuscript. MK conceived the study, edited and supervised the manuscripts and contributed to the discussions. All authors approved its final version.