
Abstract
Introduction
Reference intervals are dependent on the reference population, the analytical methods and the way the data are handled statistically. Individual method-related differences have been studied but the comparative differences in reference intervals have not.
Methods
We studied a reference population of healthy adult subjects and measured free thyroxine and thyroid-stimulating hormone by the four most commonly used analytical platforms used in the UK. Subjects were excluded if they were > 65 years or had positive thyroid peroxidase antibodies. We also performed a systematic literature review of thyroid hormone reference interval studies in non-pregnant adults.
Results
In total, 303 subjects were recruited and 42 excluded. The central 95th centile values for thyroid-stimulating hormone (mIU/L) were Abbott Architect (0.51–3.67); Beckman Unicel DxI (0.57–3.60); Roche Cobas (0.60–4.31) and Siemens Advia Centaur XP (0.63–4.29). The 95th centile values for thyroxine (pmol/L) were Abbott Architect (10.6–15.5); Beckman Unicel DxI (7.9–13.0); Roche Cobas (12.5–19.6) and Siemens Advia Centaur XP (11.8–19.0). We identified 55 papers describing thyroid reference intervals in male and non-pregnant female adults. The values for upper and lower reference intervals by manufacturer varied but were not significantly different for thyroid-stimulating hormone but were for thyroxine.
Discussion
Our study demonstrates clearly that there are marked variations in the reference intervals for thyroid hormones between analytical platforms. There is an urgent need for standardization of thyroid hormone assays to permit transferability of results. Until then, guidelines will need to reflect this method-related difference.
Introduction
The derivation of reference intervals for laboratory tests is normally delegated to laboratories to ensure that the intervals are relevant to local populations. However, it is clear that most laboratories do not have the resource to do this and they rely on the advisory intervals offered by the diagnostic companies providing their assays and published literature. There are no standards on which to judge the intervals given by laboratories, and surveys show that intervals provided by laboratories that use the same method vary greatly both in Australia and England 1 (Barth JH, Jones RG, West RM, unpublished data).
Many groups have published data on reference intervals but these have shown variation due to a number of factors including: case mix (age, gender and pregnancy, prospective sample collection and data-mining techniques), analytical technique and choice of statistical test. We have recently confirmed the effect of case mix by studying three populations using the same analytical and statistical methods. 2
Method-related variations in thyroid hormones have been studied using reference methods by the International Federation of Clinical Chemistry (IFCC) Working Group on Thyroid hormones.3–5 They have shown marked differences between methods and proposed a need for standardization of these assays. We have aimed to demonstrate the clinical implications of their studies by evaluating the reference intervals for the assays that are in common use in the UK.
We have collected a library of samples from a healthy reference population using a published protocol 6 and measured thyroid function tests using the four commonly used analytical platforms in the UK to determine the relationships between methods. Second, we have performed a systematic review of the literature of thyroid hormone reference interval studies in non-pregnant adults as these should match our reference population.
Methods
Subject recruitment
This study was approved by the National Research Ethics Committee of Yorkshire and the Humber (ref 11/H/1302/5).
A prospective reference population of healthy individuals was recruited using an IFCC-CRIDL (IFCC Committee on Reference Intervals and Decision Limits) approved health status questionnaire for a worldwide reference interval study. Ineligible candidates included, inter alia, pregnant or lactating women, blood donors and individuals on medication or with long-term conditions such as diabetes. Sample collection and pre-analytical processes were standardized according to the IFCC-CRIDL protocol. 6 Detailed questionnaires regarding alcohol intake, smoking and exercise patterns were completed as detailed in the protocol. 6
All volunteers were examined by one of two experienced physicians (AL and WM). A venous blood sample was collected from available volunteers after at least 8 h′ fast (35%), 0–4 h after the last meal (50%) and 4–8 h after the last meal (15%).
Sample exclusion:
All samples with overt hyperthyroidism or thyroid-stimulating hormone (TSH) > 10.0 mIU/L All samples with thyroid peroxidase antibodies (TPOab) greater than 7.0 and 8.5 IU/mL for females and males, respectively, as defined by Tozzoli et al.
7
All samples from subjects aged greater than 65 y.
Analyses
Blood samples were taken into Greiner serum gel separator tubes. They were centrifuged at 3000 g for 10 min at room temperature within 6 h of collection and stored at −80℃ until analysis. On the day of analysis, samples were thawed at room temperature for 1 h and protected from direct sunlight. Homogenization was achieved by inverting samples 10 times and analysis undertaken within 4 h from the start of thawing. Analysis of thyroid hormones was undertaken on a Abbott Architect i2000SR Plus (AL, SS), Beckman Unicel DxI (AL, ESK, DN), Roche Cobas (AL, NJ) and Siemens Advia Centaur XP (AL, JHB). TSH assays were reported to be traceable to WHO 2nd IRP 80/558 for Abbott, Beckman and Roche and to WHO 3rd IRP 81/565 for Siemens assays (pack inserts). Thyroid peroxidase (TPO) was measured on Beckman Access.
Assay performance.
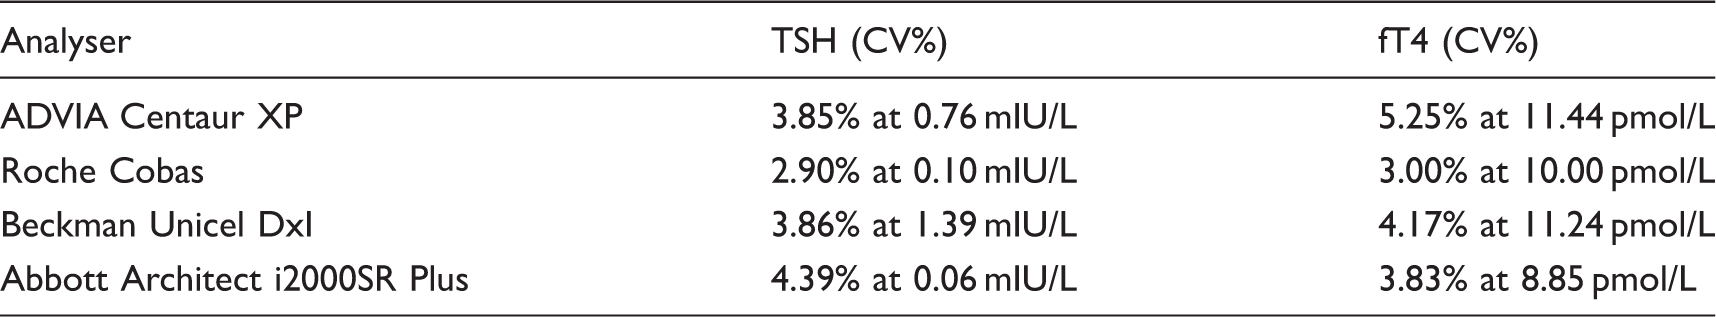
fT4: free thyroxine; TSH: thyroid-stimulating hormone; CV: coefficient of variation.
Note: Assay precision for the four analytical platforms.
Literature search
Search strategy was <<thyroid[Title] AND [Title/Abstract] AND reference[title/abstract]>>. All studies related to children, the elderly and pregnant women were excluded. Further relevant papers cited in these articles were added.
Statistics
Statistical analyses were performed using the Analyse-it v4.51 add-in package for Microsoft Excel (Analyse-it Software Ltd, Leeds, UK). Reference intervals were calculated using the Quantile function method. No outlier exclusion was performed as the subjects were clinically selected to be healthy.
Results
In total, 301 subjects (115 males and 186 females) were recruited. One subject was excluded due to TSH > 10 mIU/L; five due to age > 65 y and 35 with positive TPOabs. Of the 186 women, 54 (29%) were taking oral contraceptives but no partitioning was done of this basis. The final numbers of subjects for each assay are reported in Figure 1 and Table 2. The TSH data were not normally distributed after logarithmic transformation (Shapiro–Wilk).
STARD flow chart showing recruitment pathway. Thyroid function test reference intervals for TPO negative subjects aged 18–65 y. fT4: free thyroxine; TSH: thyroid-stimulating hormone. Note: Central 95% reference intervals with 90% confidence intervals. See ‘Methods’ section for reference population selection, exclusion and analytical and statistical methods.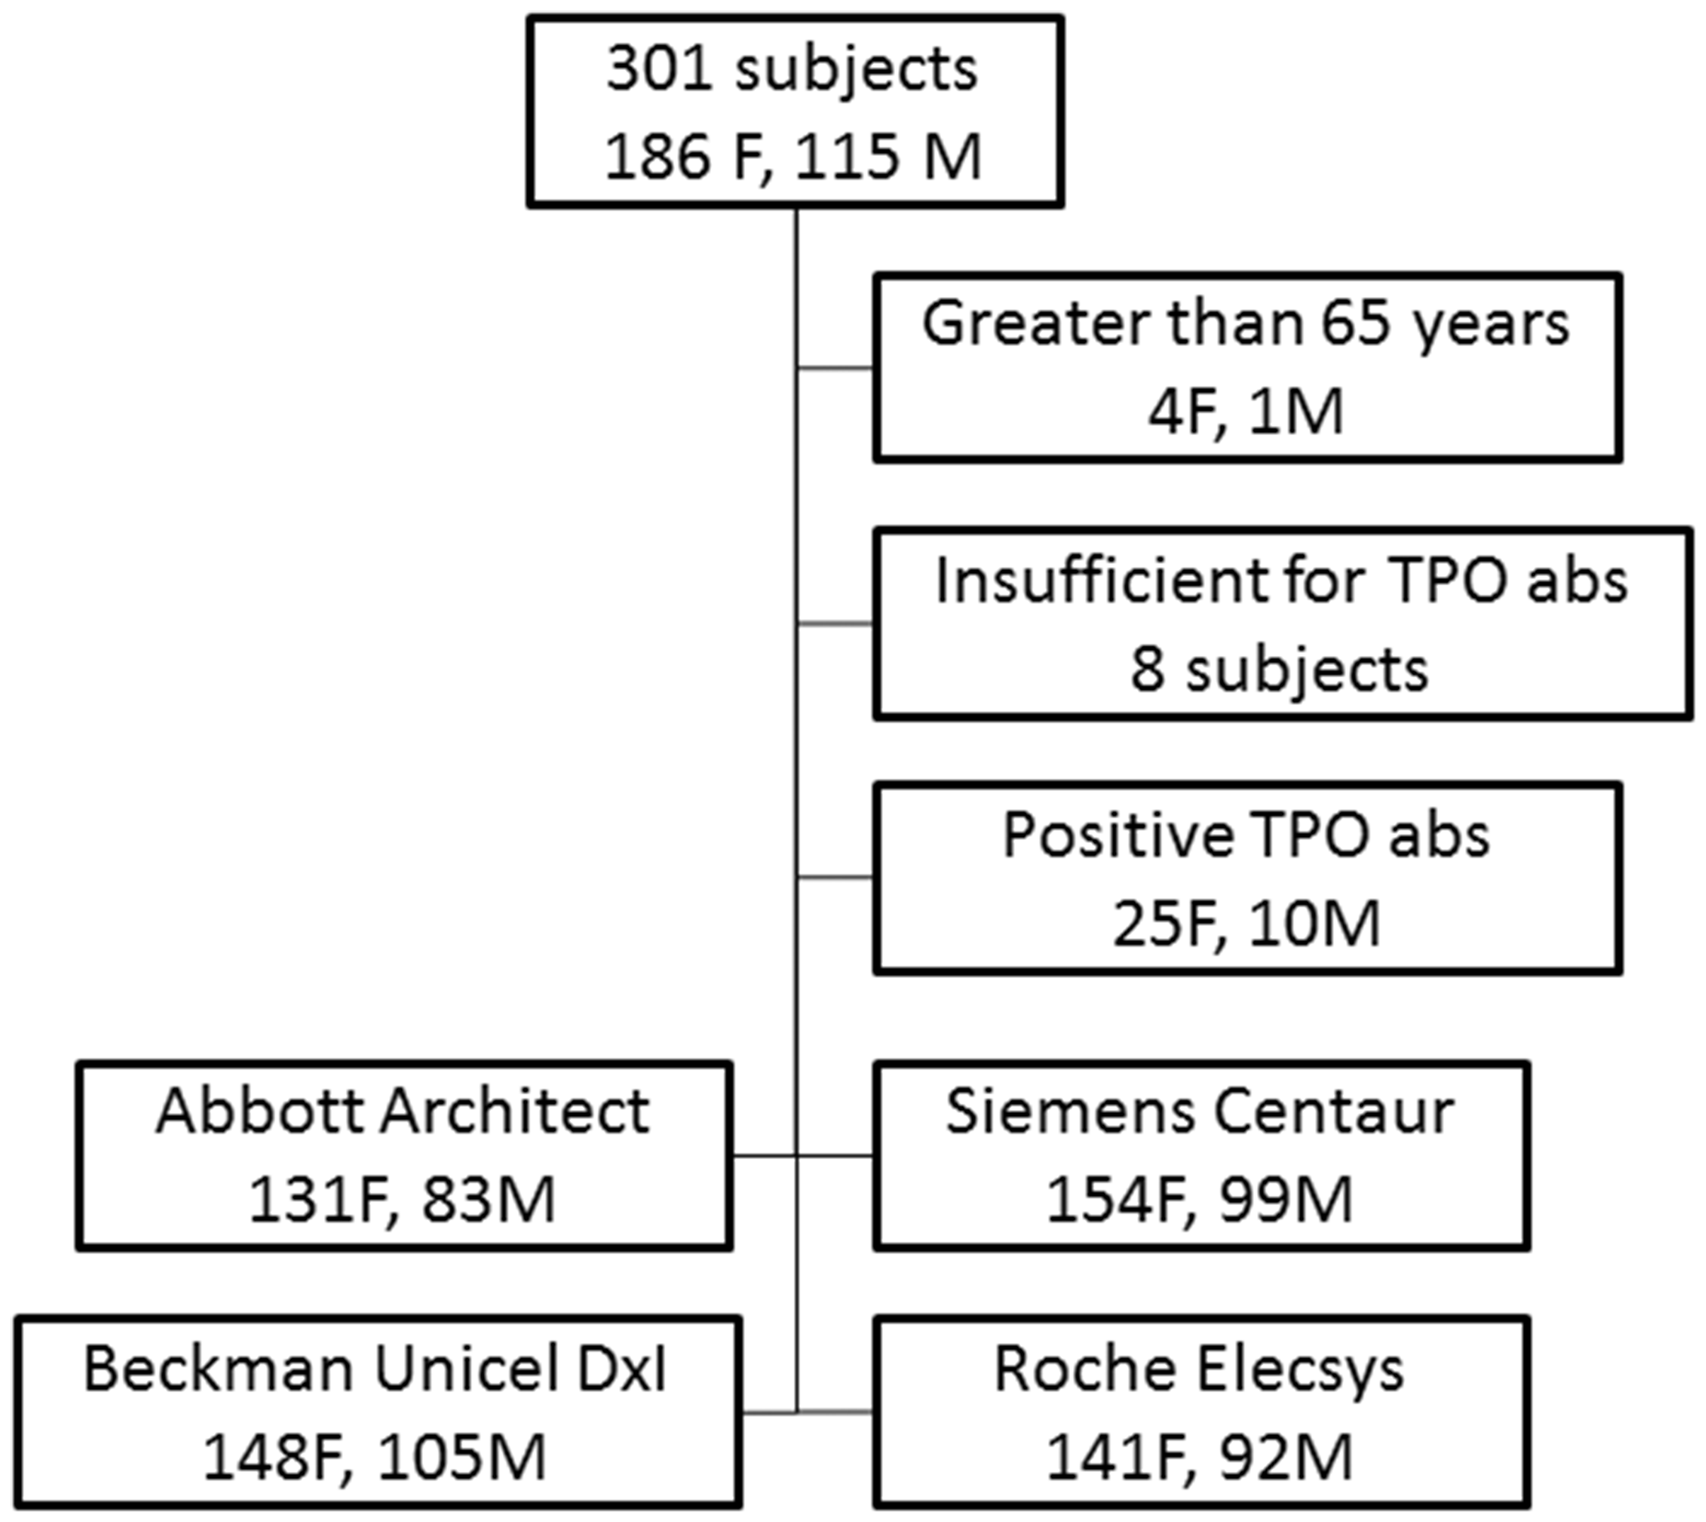
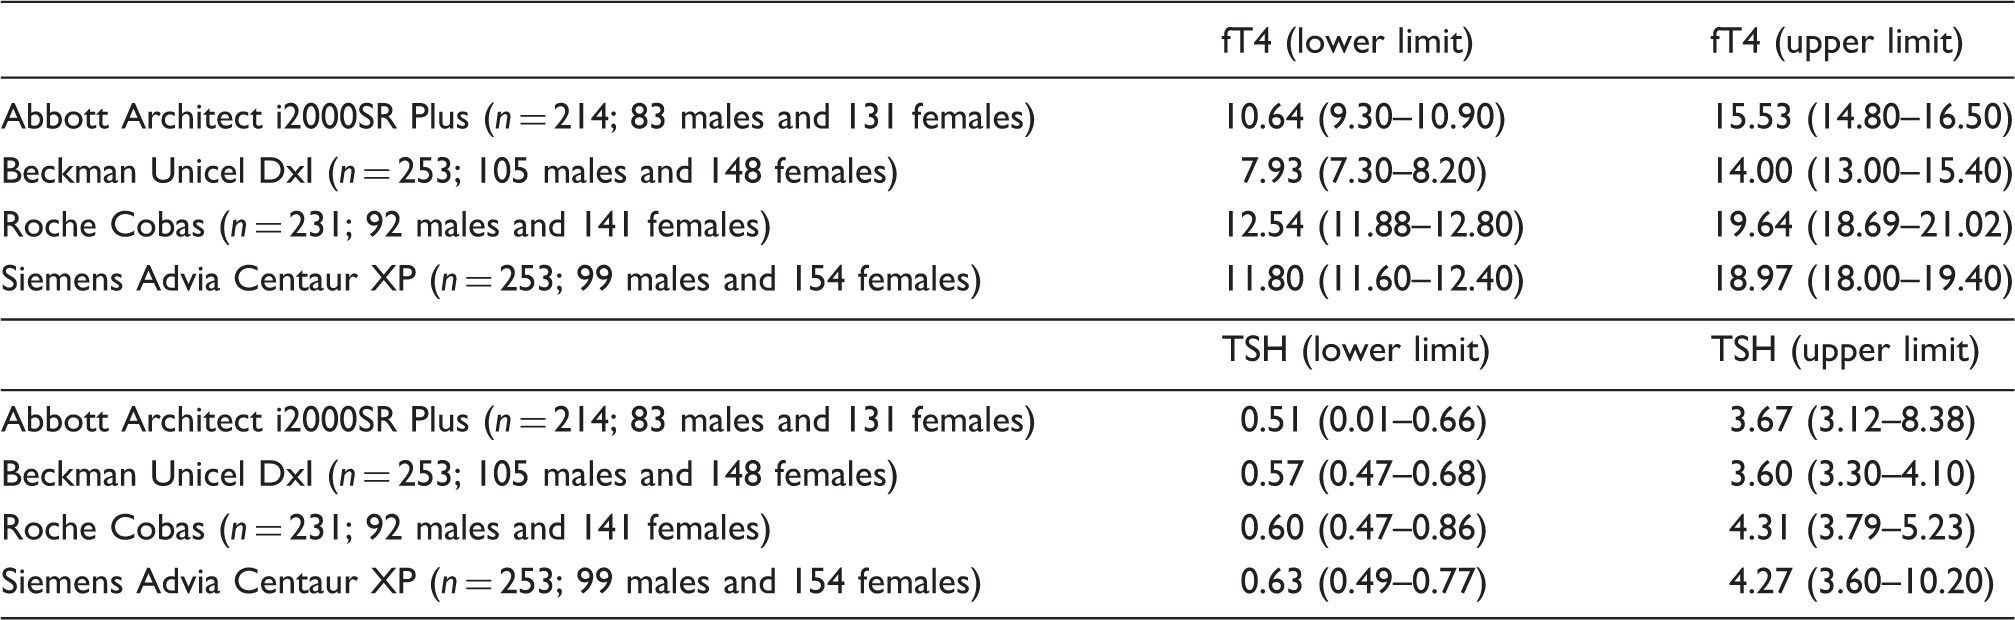
Central 95 centile reference intervals for all four assay systems are shown in Table 2. TSH values were not significantly different (analysis of variance (ANOVA), p = 0.244) but free thyroxine (fT4) values did differ between method groups (ANOVA, p < 0.0000).
Literature search
We found 55 papers describing thyroid reference intervals: Abbott Architect (10), Beckman (4), Roche Elecsys and E170 (14), Siemens Centaur and Bayer ACS-180 (12), Siemens Immulite (6) and others (9). The literature review of reference interval studies for TSH and fT4 collected data on upper and lower reference ranges, the number of subjects, the selection criteria and whether statistical methods were described. The full data set is in the on-line appendix.
The literature data are shown in Figures 1 and 2. No attempt has been made to weight the values on the basis of the sample size. In those studies where partitioned values are given but no overall ranges, then the values were arbitrarily chosen to be for males aged 40–50 y.
Literature review of reference interval studies for TSH; selected as in the methods section and separated by different manufacturer. Each figure has an upper panel showing the scatter of the higher reference values and the lower panel shows the lower reference value. None of the data points are weighted by sample size. Siemens Centaur and Immulite are separated as the Immulite was developed by DPC, and therefore the two Siemens assays did not necessarily use the same standards. The ‘others' is a heterogeneous group containing nine different methods. Literature review of reference interval studies for free thyroxine (fT4). See legend for Figure 2 for other details.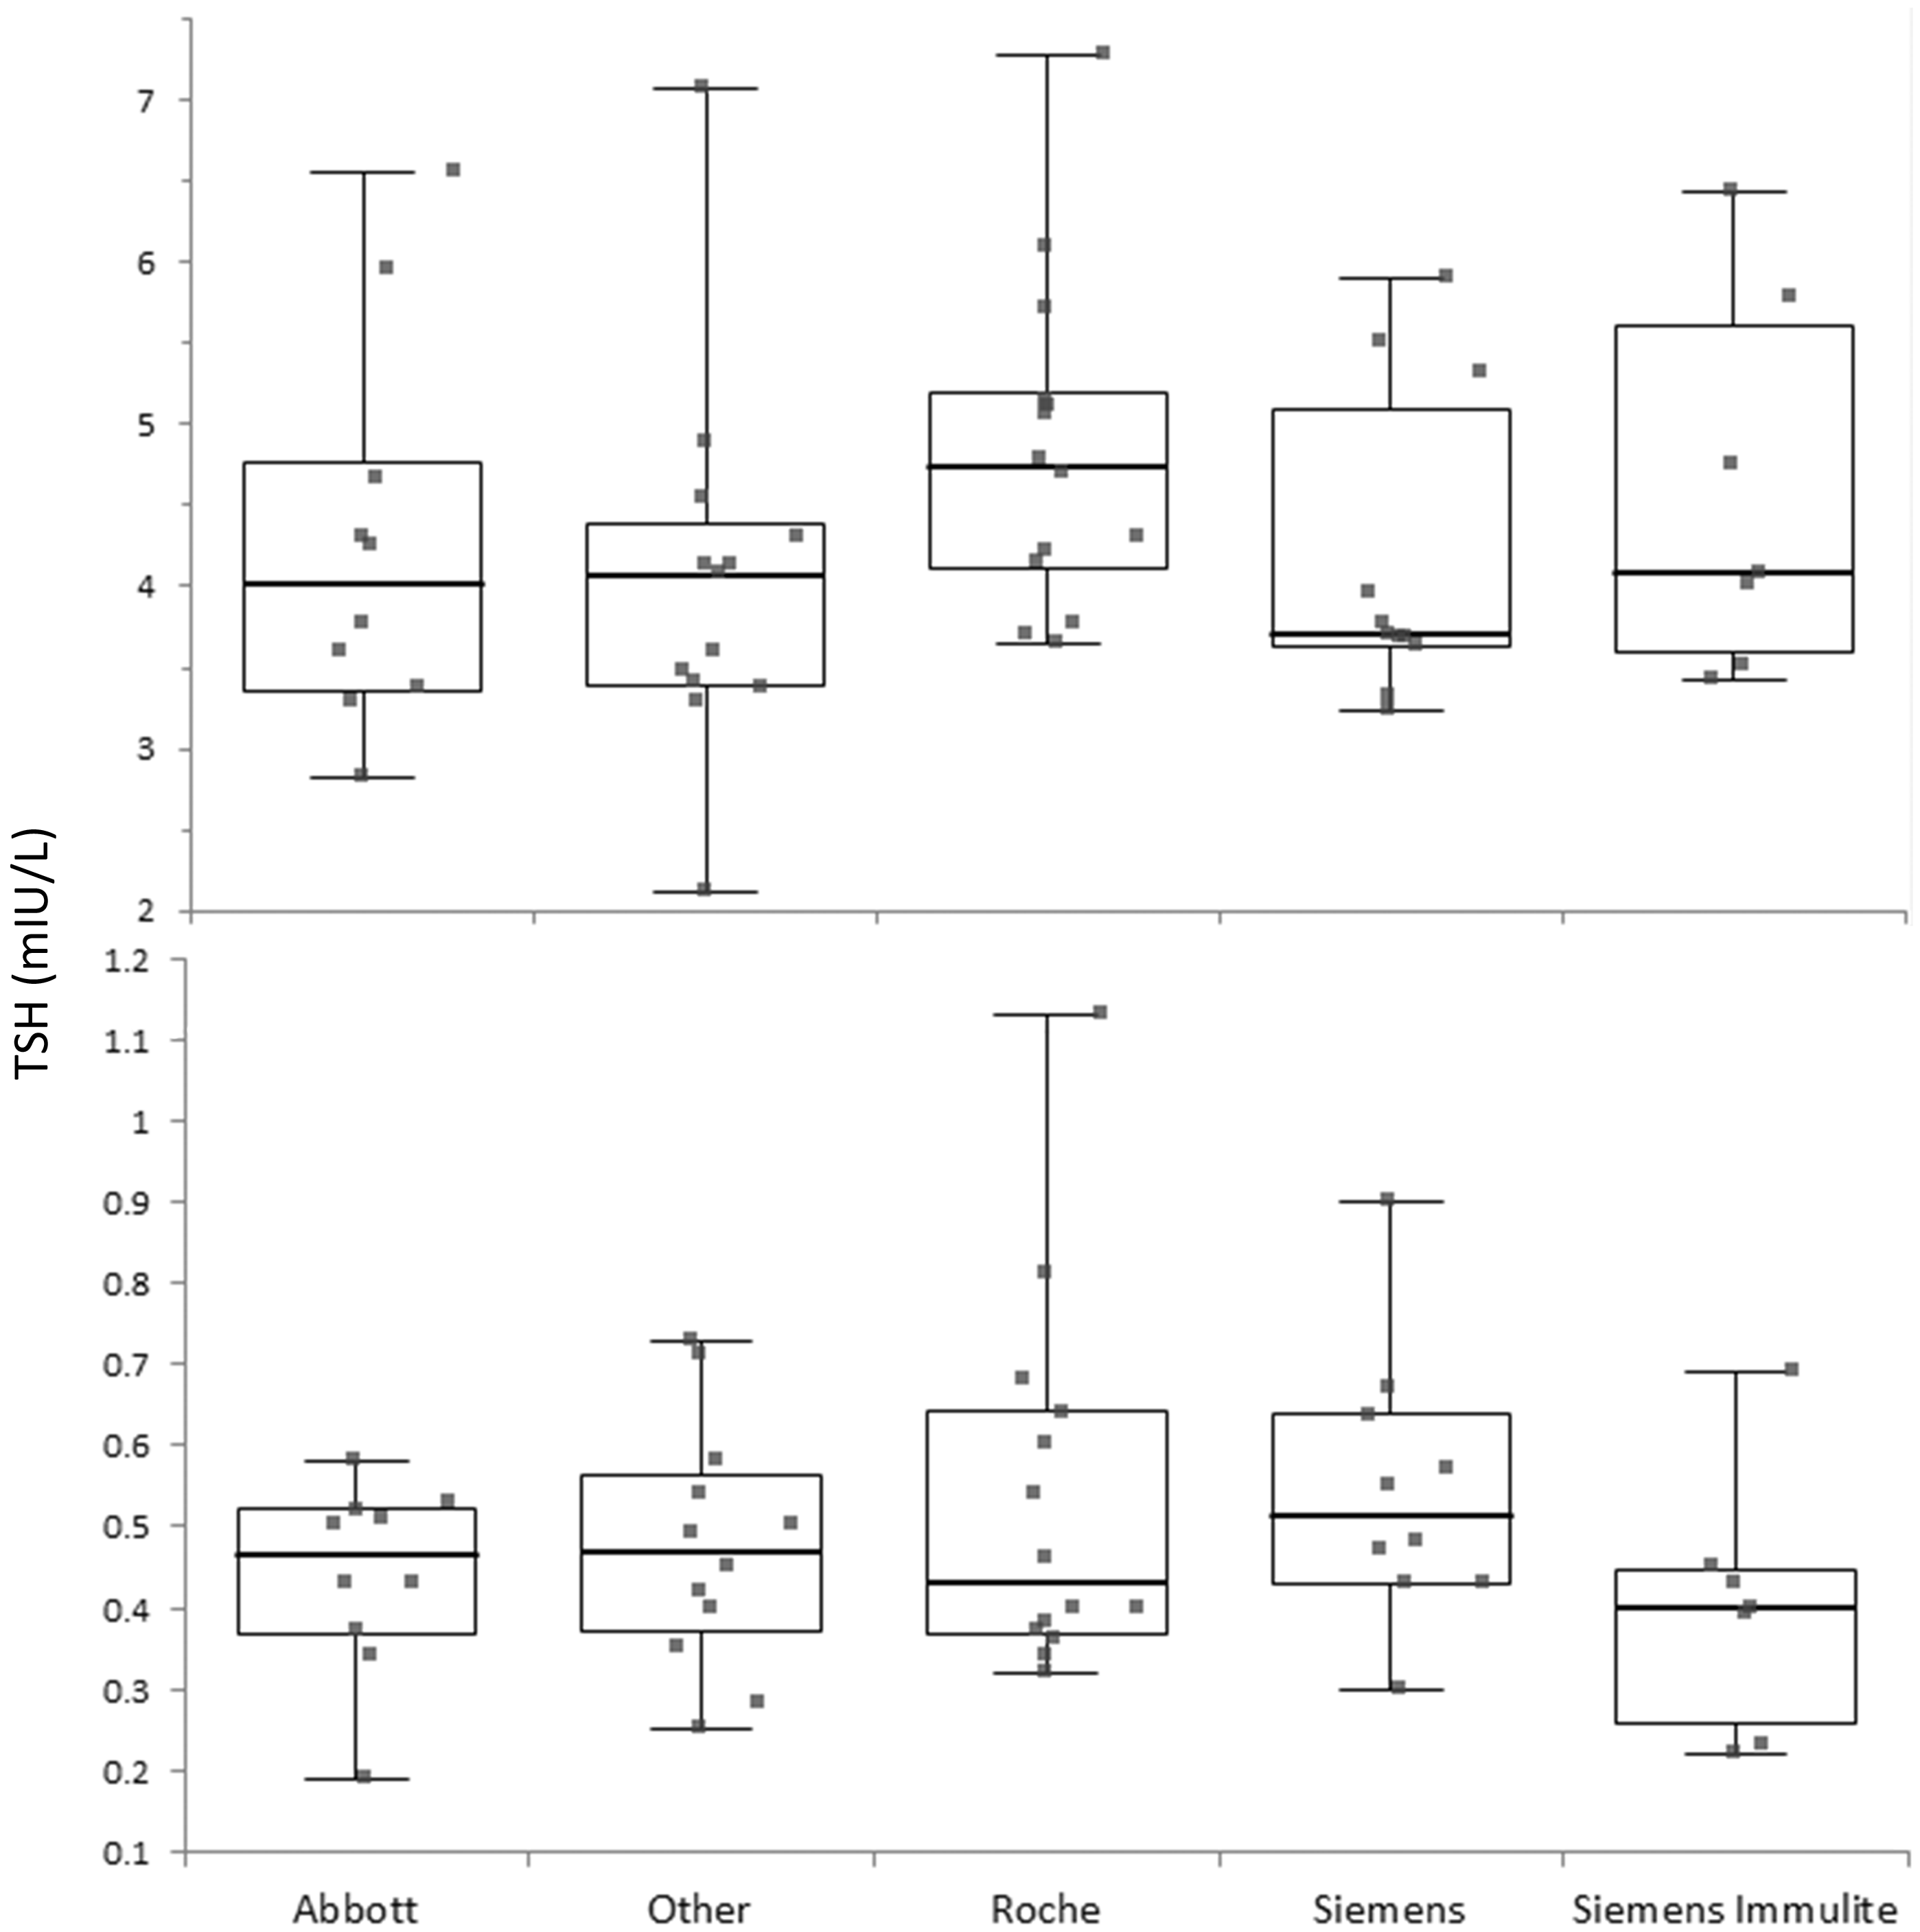
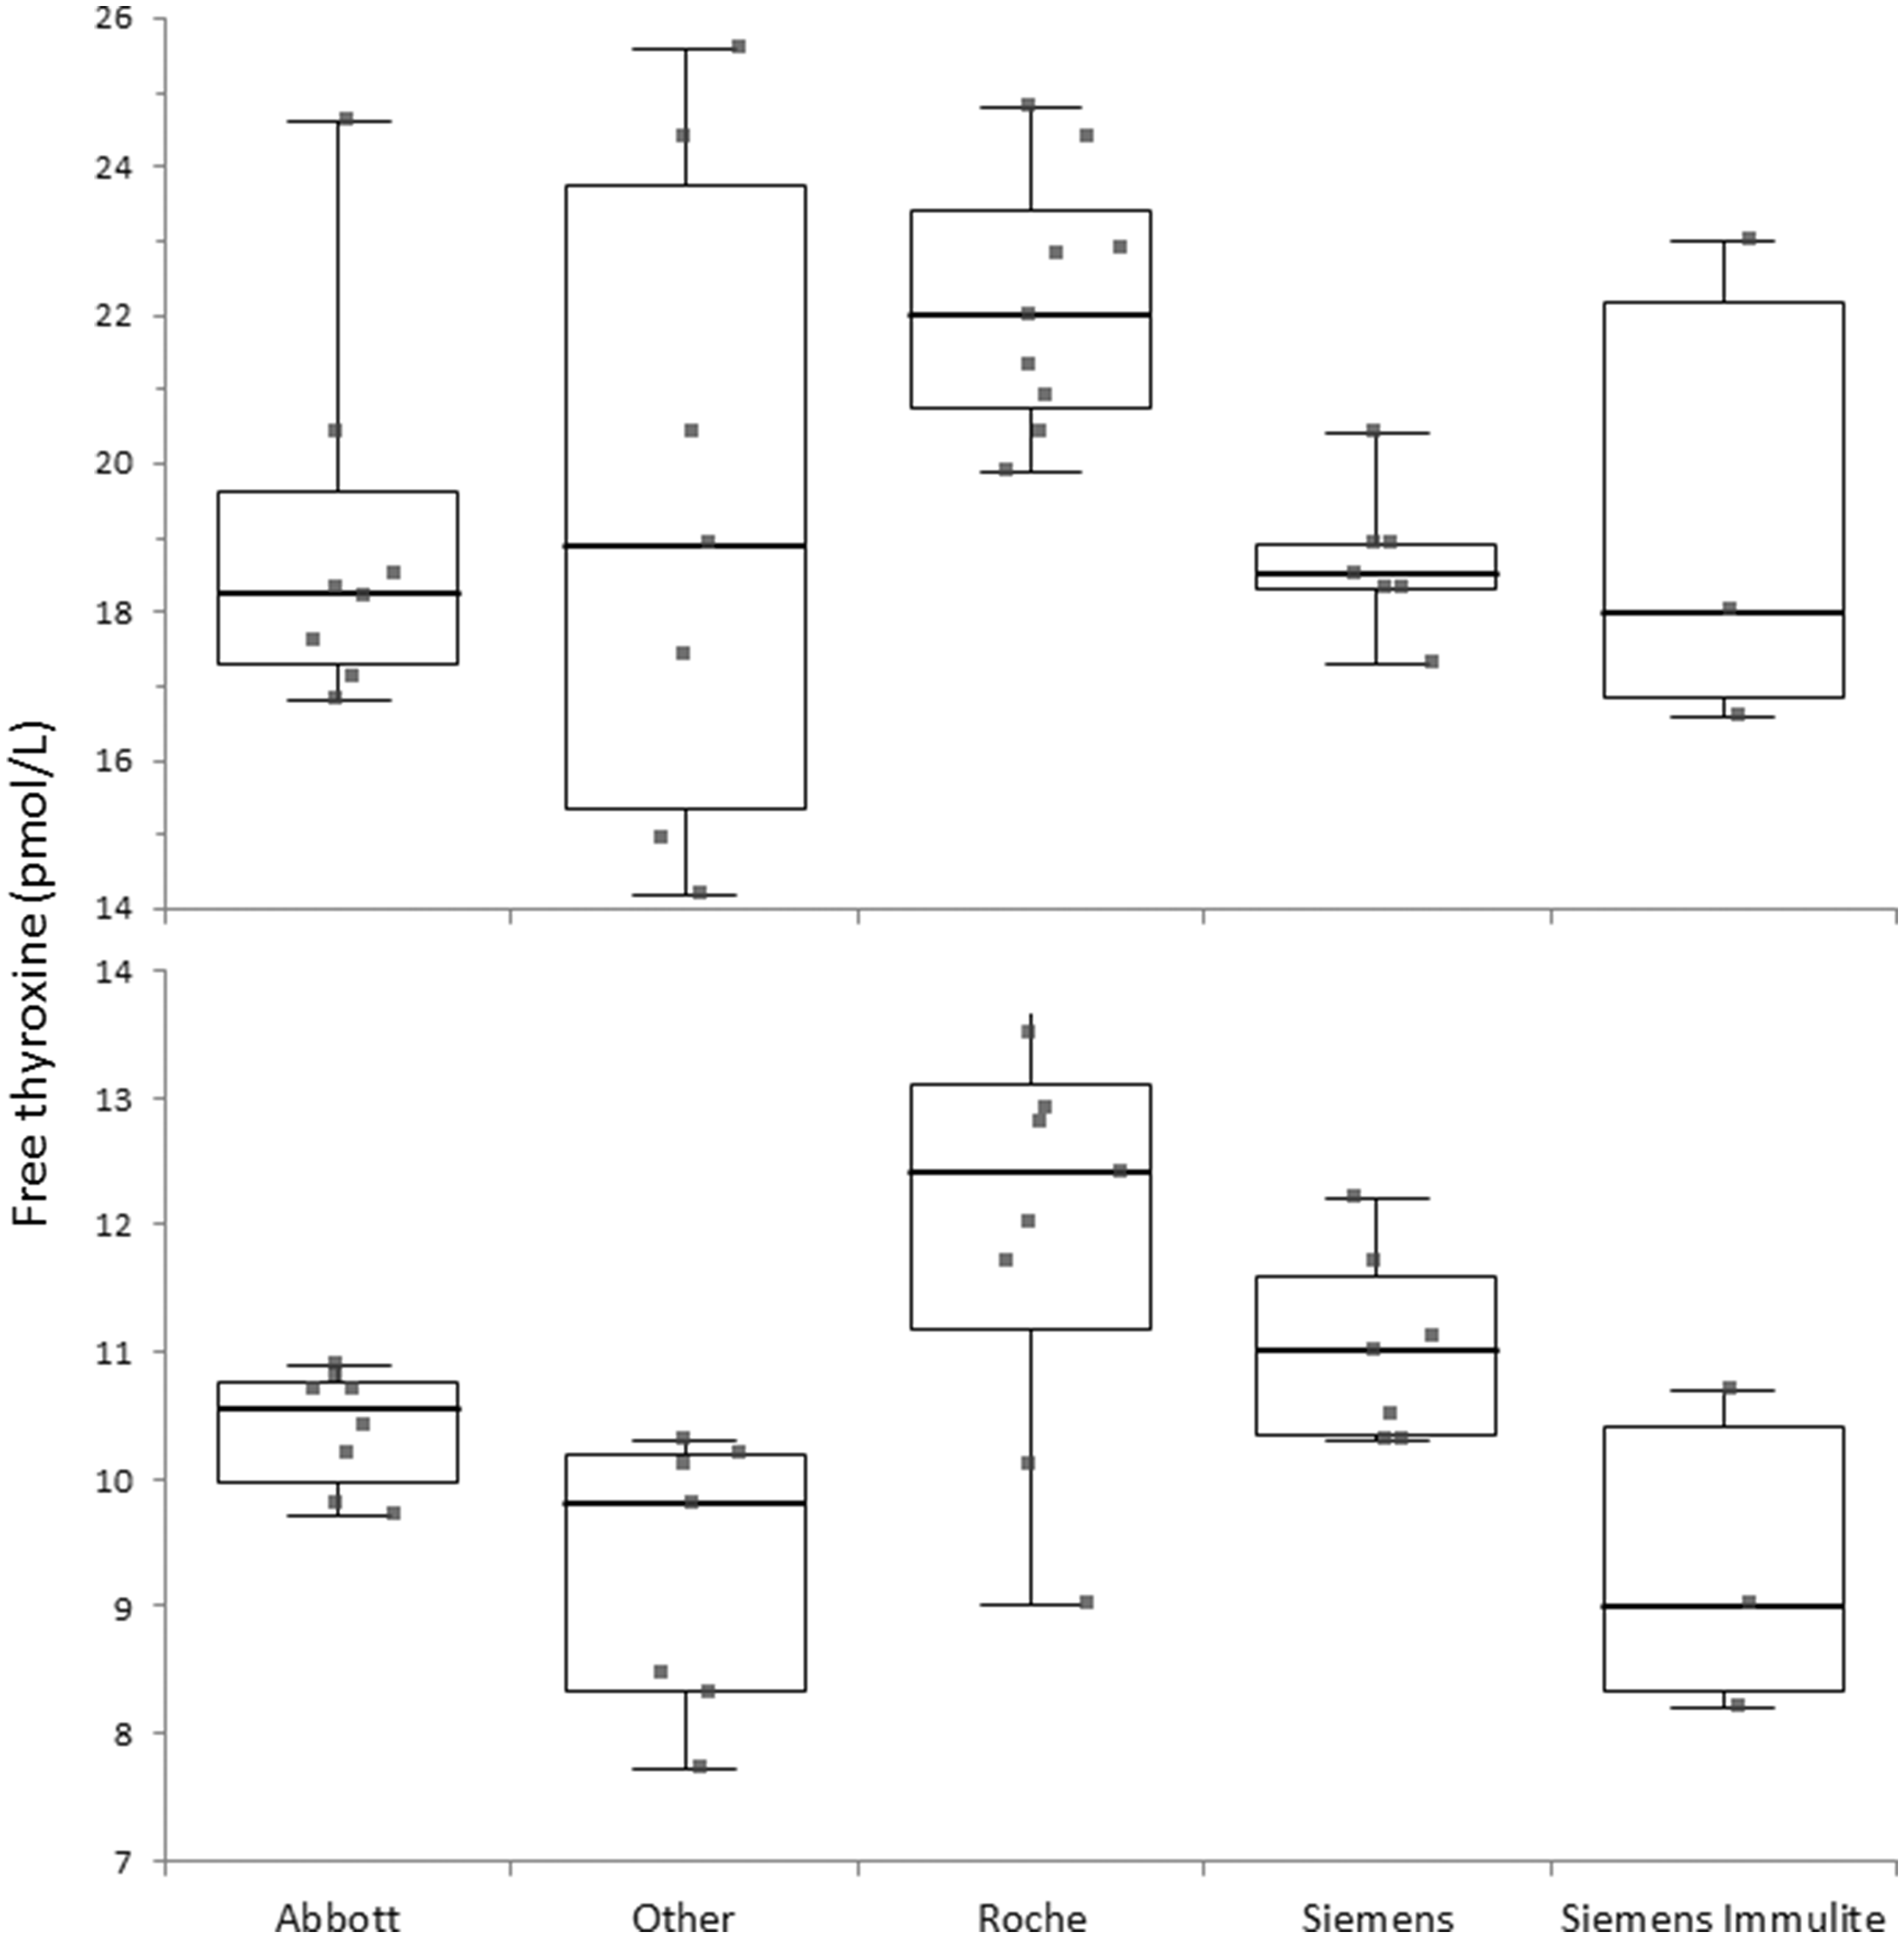
The upper and lower reference limits for TSH (Figure 1) by manufacturer were not significantly different (Kruskal–Wallis p = 0.442 for lower limit and p = 0.166 for upper limit). The upper and lower reference limits for free thyroxine (Figure 2) by manufacturer were different (Kruskal–Wallis p = 0.003 for lower limit and p = 0.055 for upper limit).
The figures are grouped by method except for a broad collection of nine small volume methods which have been collated as a heterogenous ‘others’ group. Siemens Centaur and Immulite are separated as the Immulite was developed by Diagnostic Products Corporation (DPC) and therefore the two Siemens assays did not necessarily use the same standards.
Discussion
Our study demonstrates clearly that there are marked variations in the reference ranges for thyroid hormones between analytical platforms. These differences are confirmed by our literature review. However, the influence of analytical factors does not appear to have been included in the deliberations made by the major guidelines on hypothyroidism. This is in contrast to patient groups who have identified the problem and some of whom are now complaining about the confusion induced by multiple ranges and the inability of experts to agree on what is ‘normal’. 8 We are of the opinion that the conflict in guidelines and their interpretation is in part fuelled by the analytical differences.
The development of reference intervals is dependent on three major factors: the selection of an appropriate reference population, the analytical methods employed to measure the hormones and finally the statistical tests employed.
The techniques for the selection of an appropriate reference population have been addressed by the Clinical Laboratory Standards Institute (clsi.org) and the National Academy of Clinical Biochemistry (aacc.org). However, in our literature review, we have found many studies reported using National Academy of Clinical Biochemistry criteria, and it would be expected that a standard recruitment process would find similar reference intervals but this is not the case (see comparative statistics in results section). Indeed, we have previously demonstrated that different intervals are found even when using identical criteria on two separate occasions. 2 It is now clear that intervals for TSH are affected by age, gender and iodine status and no doubt with time more factors will emerge. Other factors such as occult sick euthyroidism cannot be easily excluded. 9 The distribution of TSH results is reported by many studies to be skewed even when TPO antibodies and ultra-sound abnormalities are absent suggesting that early hypothyroidism is difficult to exclude.
The variation produced by different analytical methods has been highlighted by the IFCC working group using reference methods as stated in the introduction to this paper. Unfortunately, to date they have been unable to de-anonymize their findings. To an extent, the method-related differences have been highlighted by the studies in our literature review but the variation has been complicated by selection criteria for the subjects studied and by the different statistical techniques.
There has been only a single study examining the effect of different statistical tools. Strich et al. 10 studied a local population using a data mining approach. They used several normalization techniques for outlier removal. This gave them quite markedly different results for example the upper TSH value for 41–60-y-olds varied between 3.74 and 6.09 mIU/L.
Alternative approaches to formal reference interval studies include the harmonization route proposed by Berg and Lane 11 but this has suggested excluding hormone immune-assays due to the size of the differences between methods. Second, a multiplication factor could be employed based on the IFCC reference method studies but this has not been progressed. Third, single reference intervals may not be appropriate since there are well recognised age related variations in both free thyroxine and TSH, particularly over 65 years; and we have only studies subjects under 65 years.
Our study formally shows that the current position is not in the patients’ best interests in the current world where patient databases will accept all laboratory results irrespective of analytical methods and in a world where patients travel and are seen by physicians using different laboratories. At present, therefore, the best option is for all laboratory tests to include the analytical methods employed so that informed patients and physicians can make the correct decisions. In the long term, international standardization should help reduce inter-laboratory variation. In the meanwhile, guidelines should take this variation in thyroid hormones into consideration.
Footnotes
Declaration of conflicting interests
The author(s) declared no potential conflicts of interest with respect to the research, authorship, and/or publication of this article.
Funding
The authors received free reagents for Abbott Diagnostics, Beckman Coulter, Siemens Healthcare Diagnostics and Roche Diagnostics for this study.
Ethical approval
This study was approved by the National Research Ethics Committee of Yorkshire and the Humber (ref 11/H/1302/5).
Guarantor
JHB.
Contributorship
JHB and AL conceived the study. AL, WM and NJ recruited subjects. JHB, NJ, ESK, DN and SS oversaw the analyses. All authors contributed to the report.
References
Supplementary Material
Please find the following supplemental material available below.
For Open Access articles published under a Creative Commons License, all supplemental material carries the same license as the article it is associated with.
For non-Open Access articles published, all supplemental material carries a non-exclusive license, and permission requests for re-use of supplemental material or any part of supplemental material shall be sent directly to the copyright owner as specified in the copyright notice associated with the article.