
Abstract
Background
Alkaptonuria is a rare, debilitating autosomal recessive disorder affecting tyrosine metabolism. Deficiency of homogentisate 1,2-dioxygenase leads to increased homogentisic acid which is deposited as ochronotic pigment. Clinical sequelae include severe early onset osteoarthritis, increased renal and prostate stone formation and cardiac complications. Treatment has been largely based on analgaesia and arthroplasty. The National Alkaptonuria Centre in Liverpool has been using 2 mg nitisinone (NTBC) off-license for all patients in the United Kingdom with alkaptonuria and monitoring the tyrosine metabolite profiles.
Methods
Patients with confirmed alkaptonuria are commenced on 2 mg dose (alternative days) of NTBC for three months with daily dose thereafter. Metabolite measurement by LC-MS/MS is performed at baseline, day 4, three-months, six-months and one-year post-commencing NTBC. Thereafter, monitoring and clinical assessments are performed annually.
Results
Urine homogentisic acid concentration decreased from a mean baseline 20,557 µmol/24 h (95th percentile confidence interval 18,446–22,669 µmol/24 h) by on average 95.4% by six months, 94.8% at one year and 94.1% at two year monitoring. A concurrent reduction in serum homogentisic acid concentration of 83.2% compared to baseline was also measured. Serum tyrosine increased from normal adult reference interval to a mean ± SD of 594 ± 184 µmol /L at year-two monitoring with an increased urinary excretion from 103 ± 81 µmol /24 h at baseline to 1071 ± 726 µmol /24 h two years from therapy.
Conclusions
The data presented represent the first longitudinal survey of NTBC use in an NHS service setting and demonstrate the sustained effect of NTBC on the tyrosine metabolite profile.
Introduction
Alkaptonuria (AKU, OMIM: 203,500) is a rare autosomal recessive disorder resulting from mutations in the gene that encodes for the enzyme homogentisate 1, 2-dioxygenase (HGD, E.C.1.12.11.5).1,2 The enzyme, a constituent part of the tyrosine degradation pathway converts homogentisic acid (HGA) to maleylacetoacetic acid (Figure 1). Deficiency of the enzyme results in the accumulation of HGA in tissues and excretion of gram quantities of HGA in the urine.3–6 Through ancillary pathways, HGA oxidizes to benzoquinone acetic acid (BQA), which is responsible for the black appearance of urine in AKU, upon standing. The conversion of BQA to melanin-like pigment and its binding to connective tissues are linked to the destructive nature of the disease such as seen in cartilage, bone and other connective tissues such as sclera.7–12 This ochronotic process takes place over several years and affects virtually all connective tissues.
Tyrosine degradation pathway indicating enzyme defect in alkaptonuria and where nitisinone acts upon the pathway.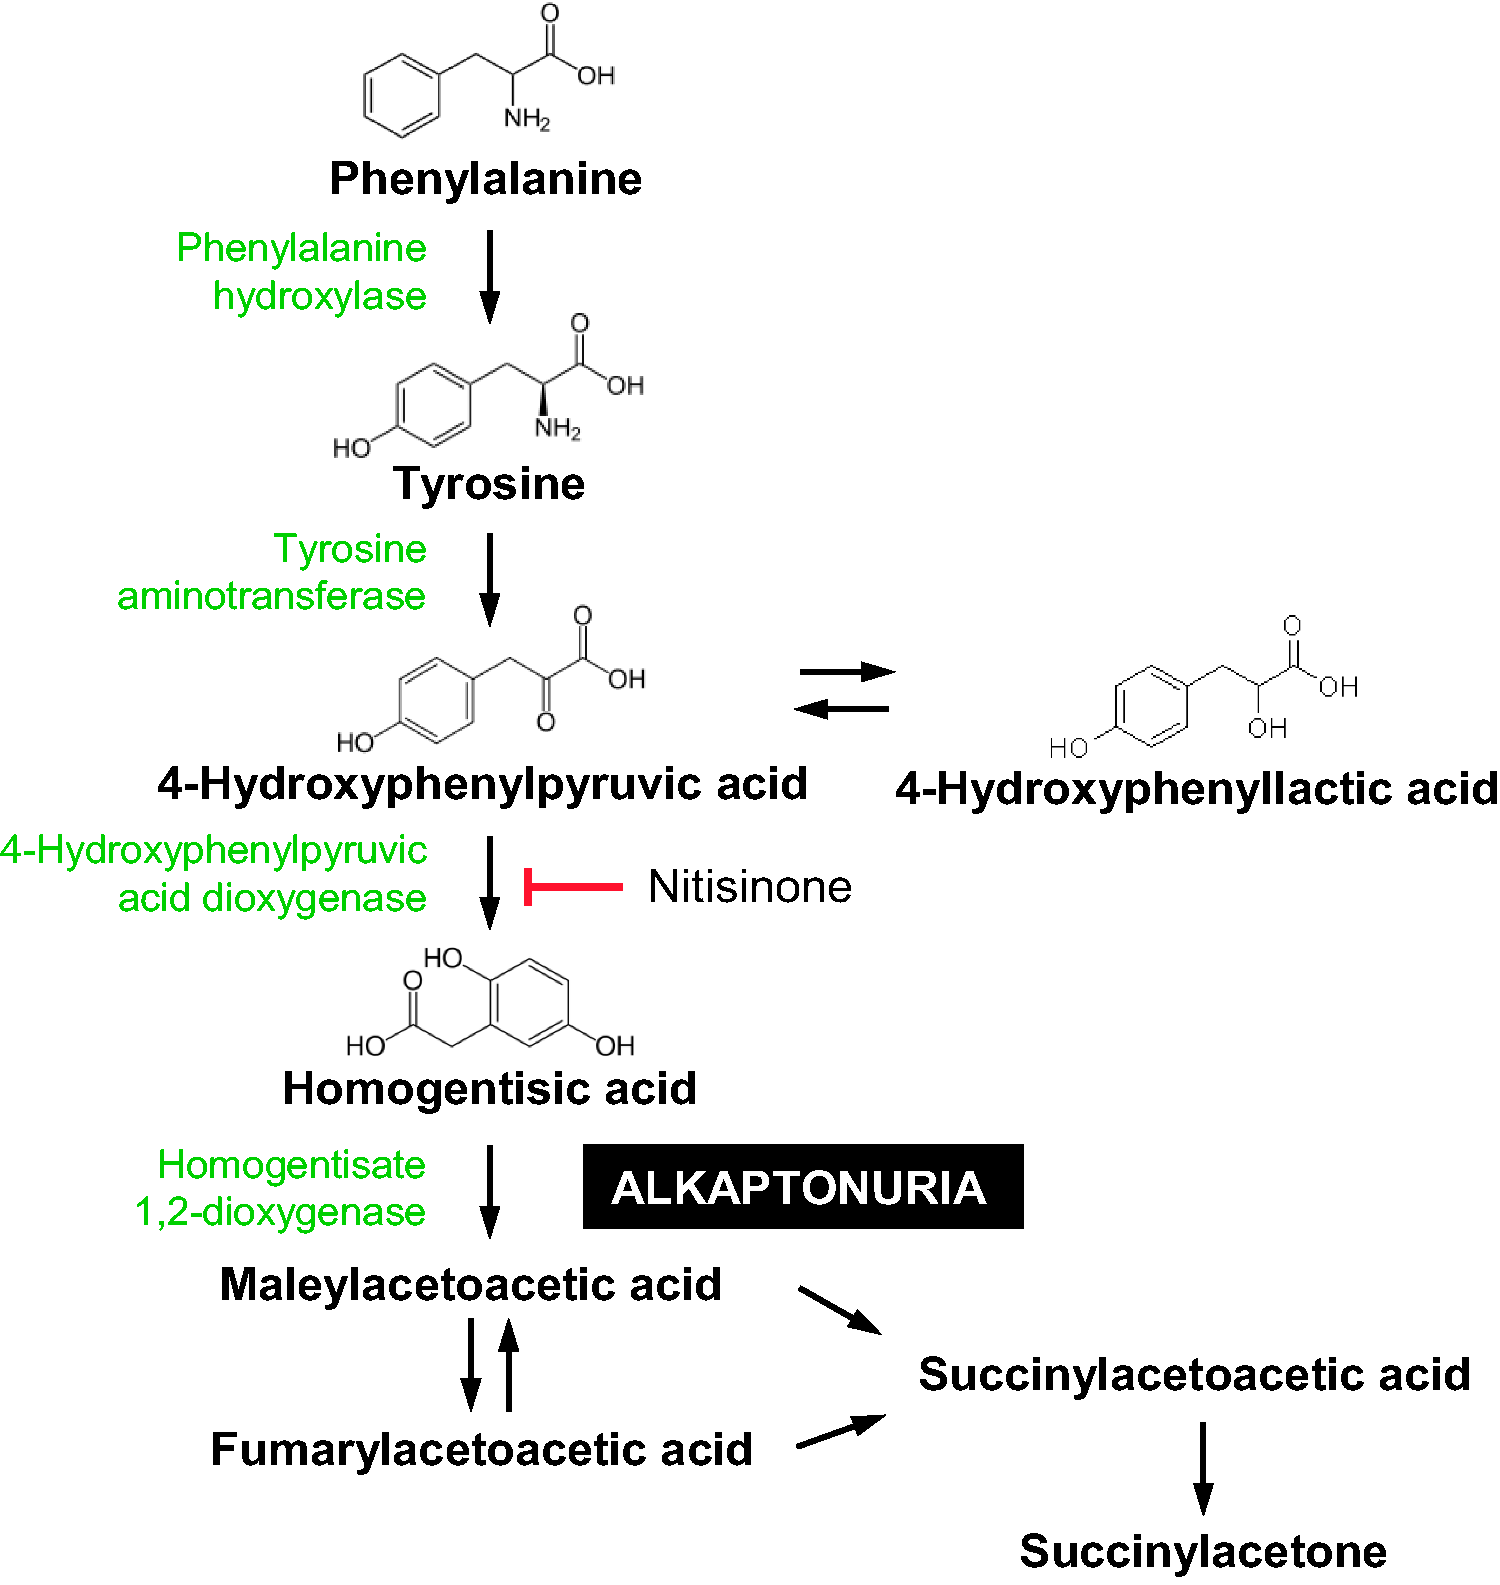
Treatment of the condition is largely via analgesics, joint replacement when required, dietary protein restriction and large doses of vitamin C, each with varying degrees of efficacy. 11 There have been trials of 2 -(2-nitro-4-trifluoromethylbenzoyl)-1,3-cyclohexanedione (NTBC) more commonly referred to as nitisinone, in the treatment of AKU. NTBC inhibits 4-hydroxyphenylpyruvate dioxygenase (HPPD, E.C.1.13.11.27), the enzyme which produces HGA (Figure 1).3,13
NTBC has been licenced for the treatment of hereditary tyrosinaemia type 1 (HT1, OMIM 276700) since 2002 where deficiency of fumarylacetoacetate hydroxylase (FAH, E.C. 3.7.1.2) results in liver failure, hepatocellular carcinoma and renal tubular dysfunction. 14 The efficacy of the therapy has resulted in NTBC replacing liver transplant as the treatment of choice in HT1.15,16
Summary of previous clinical trials using nitisinone in alkaptonuria.
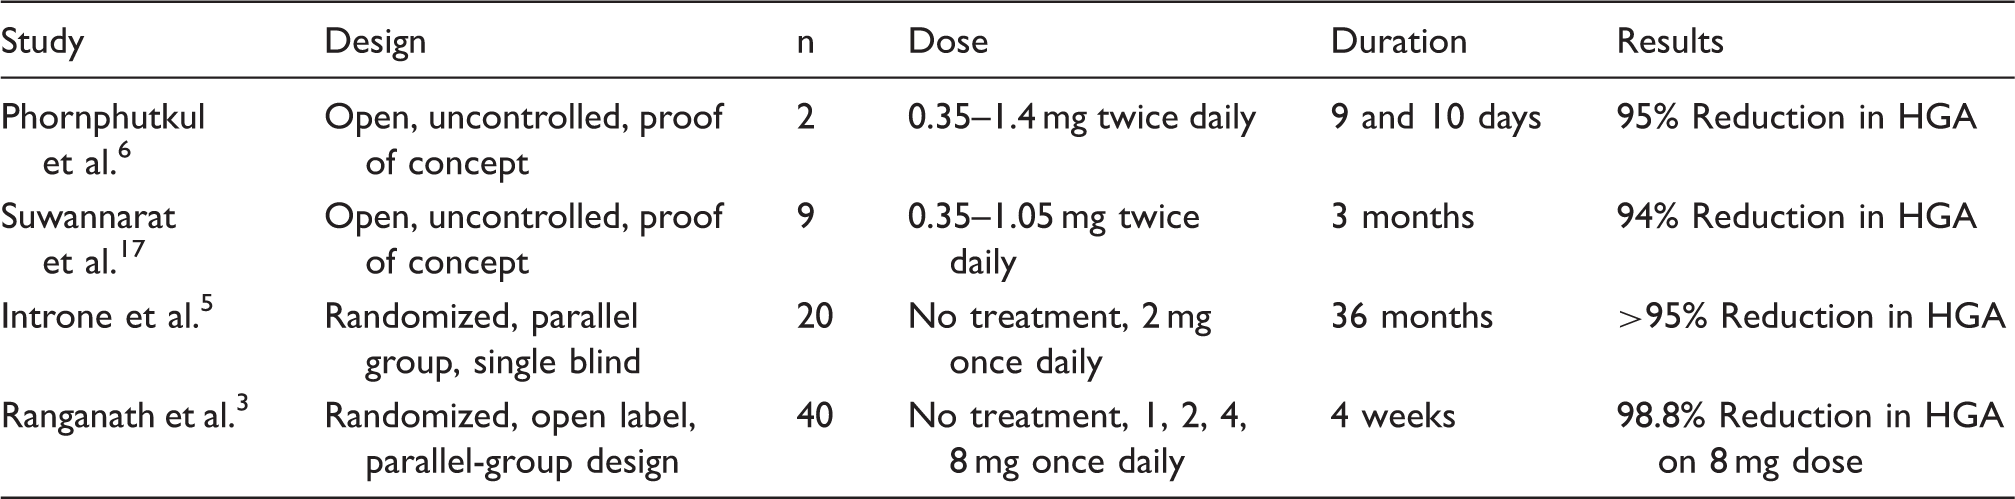
More recently, a large-scale international trial (suitability of nitisinone in AKU 1, SONIA-1, DevelopAKUre, project number: 304985) demonstrated the short-term effects of various doses of NTBC (1, 2, 4 and 8 mg) over a four-week period. 3 A clear, dose-dependent suppression of HGA was measured with a mean reduction of urine HGA concentration at four weeks, of 98.8% compared with baseline, on an 8 mg daily dose.
In 2012, the Robert Gregory National AKU Centre (NAC) was established by the NHS Highly Specialised Services Commissioning Group at The Royal Liverpool University Hospital, UK. With recognition that NTBC has potential for treatment of this debilitating condition, the centre aimed to provide NTBC, off-label, for all patients in the UK with AKU. The NAC is the first centre to provide long-term supportive and potentially disease-modifying medical care. This includes specialist dietary monitoring and biochemical assessment to ensure the safe and efficacious use of NTBC.
The present publication is an audit of the service at the NAC from a biochemical viewpoint. The NTBC is being used off-licence in a health service setting and the data described documents the effect of NTBC on tyrosine metabolites over two years of usage.
Patients and methods
Patients
The protocol for treatment is that patients with confirmed AKU are commenced on a 2 mg dose of NTBC, on alternative days for the first three months, which is then increased to 2 mg daily thereafter. Assessments are repeated on an annual basis to monitor response to therapy.
This longitudinal survey reports the biochemical data obtained from monitoring markers of the tyrosine metabolic pathway and includes data from patients that have attended the NAC for two years (three annual visits). To date 58 patients have enrolled at the NAC. Inclusion criteria are diagnosis of AKU; resident of either England or Scotland, and be aged over 16 years; exclusion criteria are pregnancy and lactation. NTBC is used in an open-label protocol here to investigate its safety and efficacy in the treatment of this rare disease. All patients are provided with written information about the scope of the centre and the assessments they will receive. All patients at the NAC are assessed at baseline with a four-day visit and then at annual follow-up. Most patients are medically fit enough to travel to Liverpool for assessments and treatments. Metabolite measurements are performed at baseline, day four (two-days post-NTBC), three months, six-months and one-year, with annual monitoring thereafter. Confirmed diagnosis of AKU is based upon increased urinary HGA excretion and is mandatory for referral to the NAC. Urine HGA excretion in healthy volunteers has been demonstrated in the order of < 2.91 µmol/24 h. 19
Data collection
The NAC and all subsequent data collection and analyses are approved by The Royal Liverpool and Broadgreen University Hospital Trusts Audit Committee (Audit no. ACO3836). This is not a clinical trial and therefore ethical approval is not required. Data obtained follow standard clinical assessments upon referral to the NAC. Patients are informed verbally and through patient information leaflets about the activities of the NAC. Patients are also explicitly informed that data may be used for publication and within the NAC patient information leaflet the following paragraph is included: We could publish results from the study but if we do, we will make sure that you cannot be identified in anyway. All data used for publicity or for other research purposes will ensure total anonymity. Please let us know when you are visiting the NAC that you understand and have no objections to this.
Sample collection
Baseline 24-h urine collection (acidified with 25 mL 2.5 mol/L H2SO4) and serum samples were collected. Serum samples were acidified by deproteinization with perchloric acid (5.8 mol/L). This stabilizes the HGA for short- and long-term storage and analysis (unpublished data).
Urine HGA and tyrosine analysis
Urine samples were analysed using a previously published liquid chromatography tandem mass spectrometry (LC-MS/MS) method. 4 The only modification was change from d2 to a d4-tyrosine internal standard. In brief, all analysis were performed on an Agilent 6490 Triple Quadrupole mass spectrometer with Jet-Stream® electrospray ionization coupled with an Agilent 1290 Infinity II UHPLC pump and autosampler.
Ten microliters of sample were diluted 1:1000 with 0.4 µmol/L 13C6-HGA and 2 µmol/L d4-tyrosine in 0.1% formic acid (v/v) in deionized water. Separation was achieved on an Atlantis dC18 column (100 × 3.0 mm, 3 µm, Waters) maintained at 35℃. Quantitation was achieved using a matrix matched seven-point calibration curve and two product ion transitions for each analyte of interest (HGA 167 > 122 and 167 > 108, negative ionization; tyrosine 182 > 136 and 182 > 91 positive ionization). The urine assay was linear for HGA concentrations up to 16 mmol/L (pre-NTBC therapy) and the lower limit of quantification (LLOQ) was 3 µmol/L (post-NTBC therapy). Dilution integrity was assessed with recovery 96.6 ± 6.6% (n = 6) on a 1 in 10 dilution, when required. 4
Serum HGA, tyrosine and NTBC analysis
Serum samples were analysed on a single method for all three analytes 20 using a matrix matched serum calibration curve. As for the urine assay, all analyses were performed by LC-MS/MS with 10 µL of deproteinized sample diluted 1:1000 with 0.2 µmol/L 13C6-HGA, 2 µmol/L d4-tyrosine and 2 nmol/L 13C6-NTBC in 0.1% formic acid/deionized water. Internal standards were lower than those used in the urine assay to reflect the lower concentrations in serum, compared with urine, requiring a more sensitive assay. Tyrosine was linear from 10 to 2000 µmol/L covering both pre-NTBC and post-NTBC concentrations within one assay.
Creatinine measurement
Our group has published data demonstrating the interference of HGA on enzymatic creatinine assays and assays which utilize a peroxidase reaction. 21 Urine and serum creatinine analyses were therefore performed using the Jaffe creatinine assay where creatinine forms a yellow-orange complex with picrate at an alkaline pH measured on a Roche Cobas c501 analyser.
Statistical analysis
All statistical analyses were carried out using GraphPad Instat. A two-tailed unpaired t-test was used to make statistical comparison between groups to establish if there were any significant differences. Testing for Gaussian distribution was performed using Kolmogorov and Smirnov test. If data were not normally distributed, a non-parametric Mann–Whitney test was performed to determine if there were any significant differences. Both the t-test and the Mann–Whitney test assume equal standard deviations in the groups; due to the large concentration changes upon commencing NTBC, standard deviations are not the same when comparing time points against baseline data; therefore, an un-paired t-test with Welch correction has been applied.
Results
Patient demographics
Summary of the metabolic data from patients who have attended the National AKU Centre for two years.
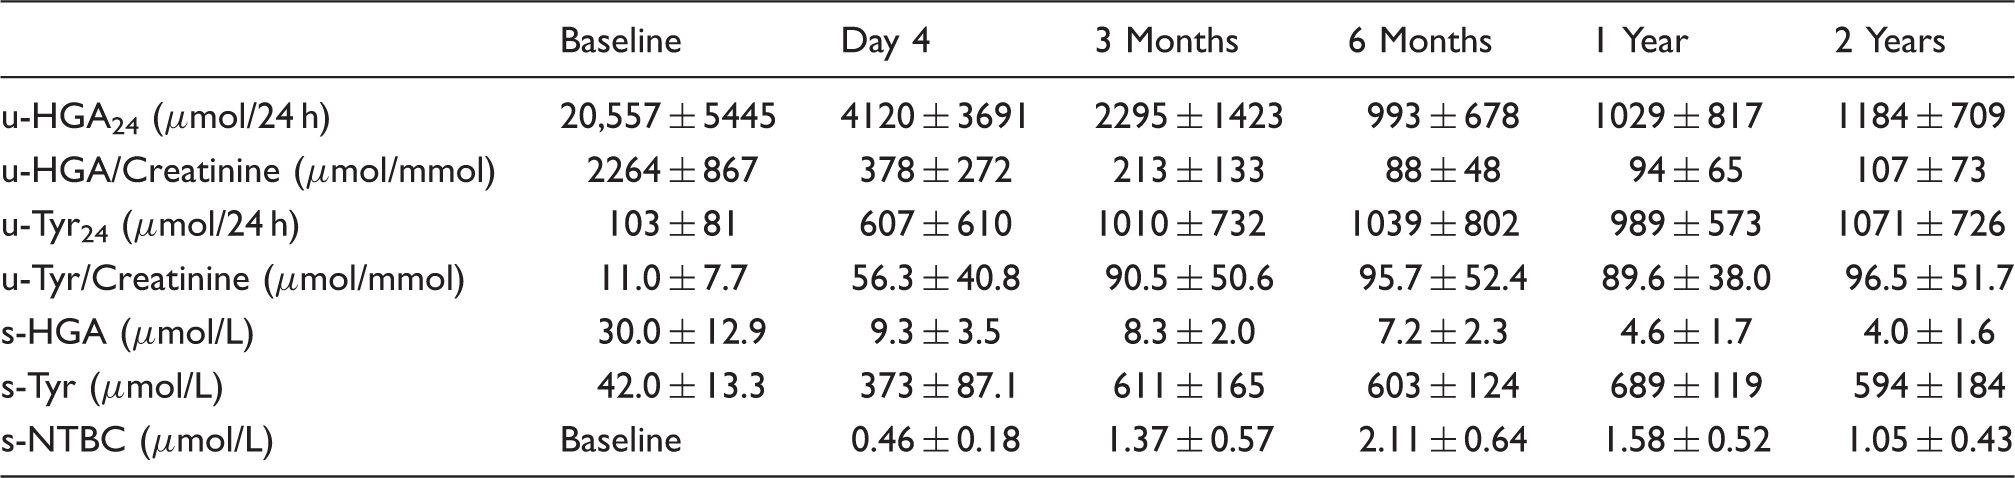
u: urine; s: serum; HGA: homogentisic acid; Tyr: tyrosine; NTBC: nitisinone.
Compliance issues
At both six months and one year, one patient has become non-compliant, evidenced by undetectable serum NTBC concentration and urine HGA increasing to pre-treatment concentrations. The data are not included in the overall statistics.
Urine HGA concentrations
Urine HGA excretion, in relation to 24-h excretion (determined by volume) is shown in Figure 2(a) and Table 2. At baseline, the average HGA excretion per day (u-HGA24) was 20,557 µmol/24 h (95th percentile confidence interval 18,446–22,669 µmol/24 h). At two days after commencing NTBC, repeat urine measurements showed that u-HGA24 decreased by 78.2% (P < 0.0001), with an average excretion of 4120 µmol/24 h. Three-month measurements revealed an 88.8% reduction from baseline with average u-HGA24 of 2295 µmol/24 h. After three months, the increase to a daily dose of 2 mg resulted in an additional decrease to 95.4% at six months (n = 25, P = 0.0003) which has remained steady at one year 94.8% (n = 27). Twenty-six (compliant) patients have data at year two and still maintain a decrease in u-HGA24 of 94.1% two years post commencement of NTBC with an average u-HGA24 of 1184 µmol/24 h.
(a) Urine HGA excretion (µmol/24 h) demonstrating the reduction in HGA excretion with oral administration of NTBC. (b) Serum tyrosine (µmol/L) demonstrating rapid increase in serum tyrosine upon commencing NTBC. Boxplot represents 95% confidence intervals, line is median, tail the minimum and maximum results (excludes outliers). Diamond is mean and 95% confidence intervals (includes outliers). X = outliers > 3 inter quartile range.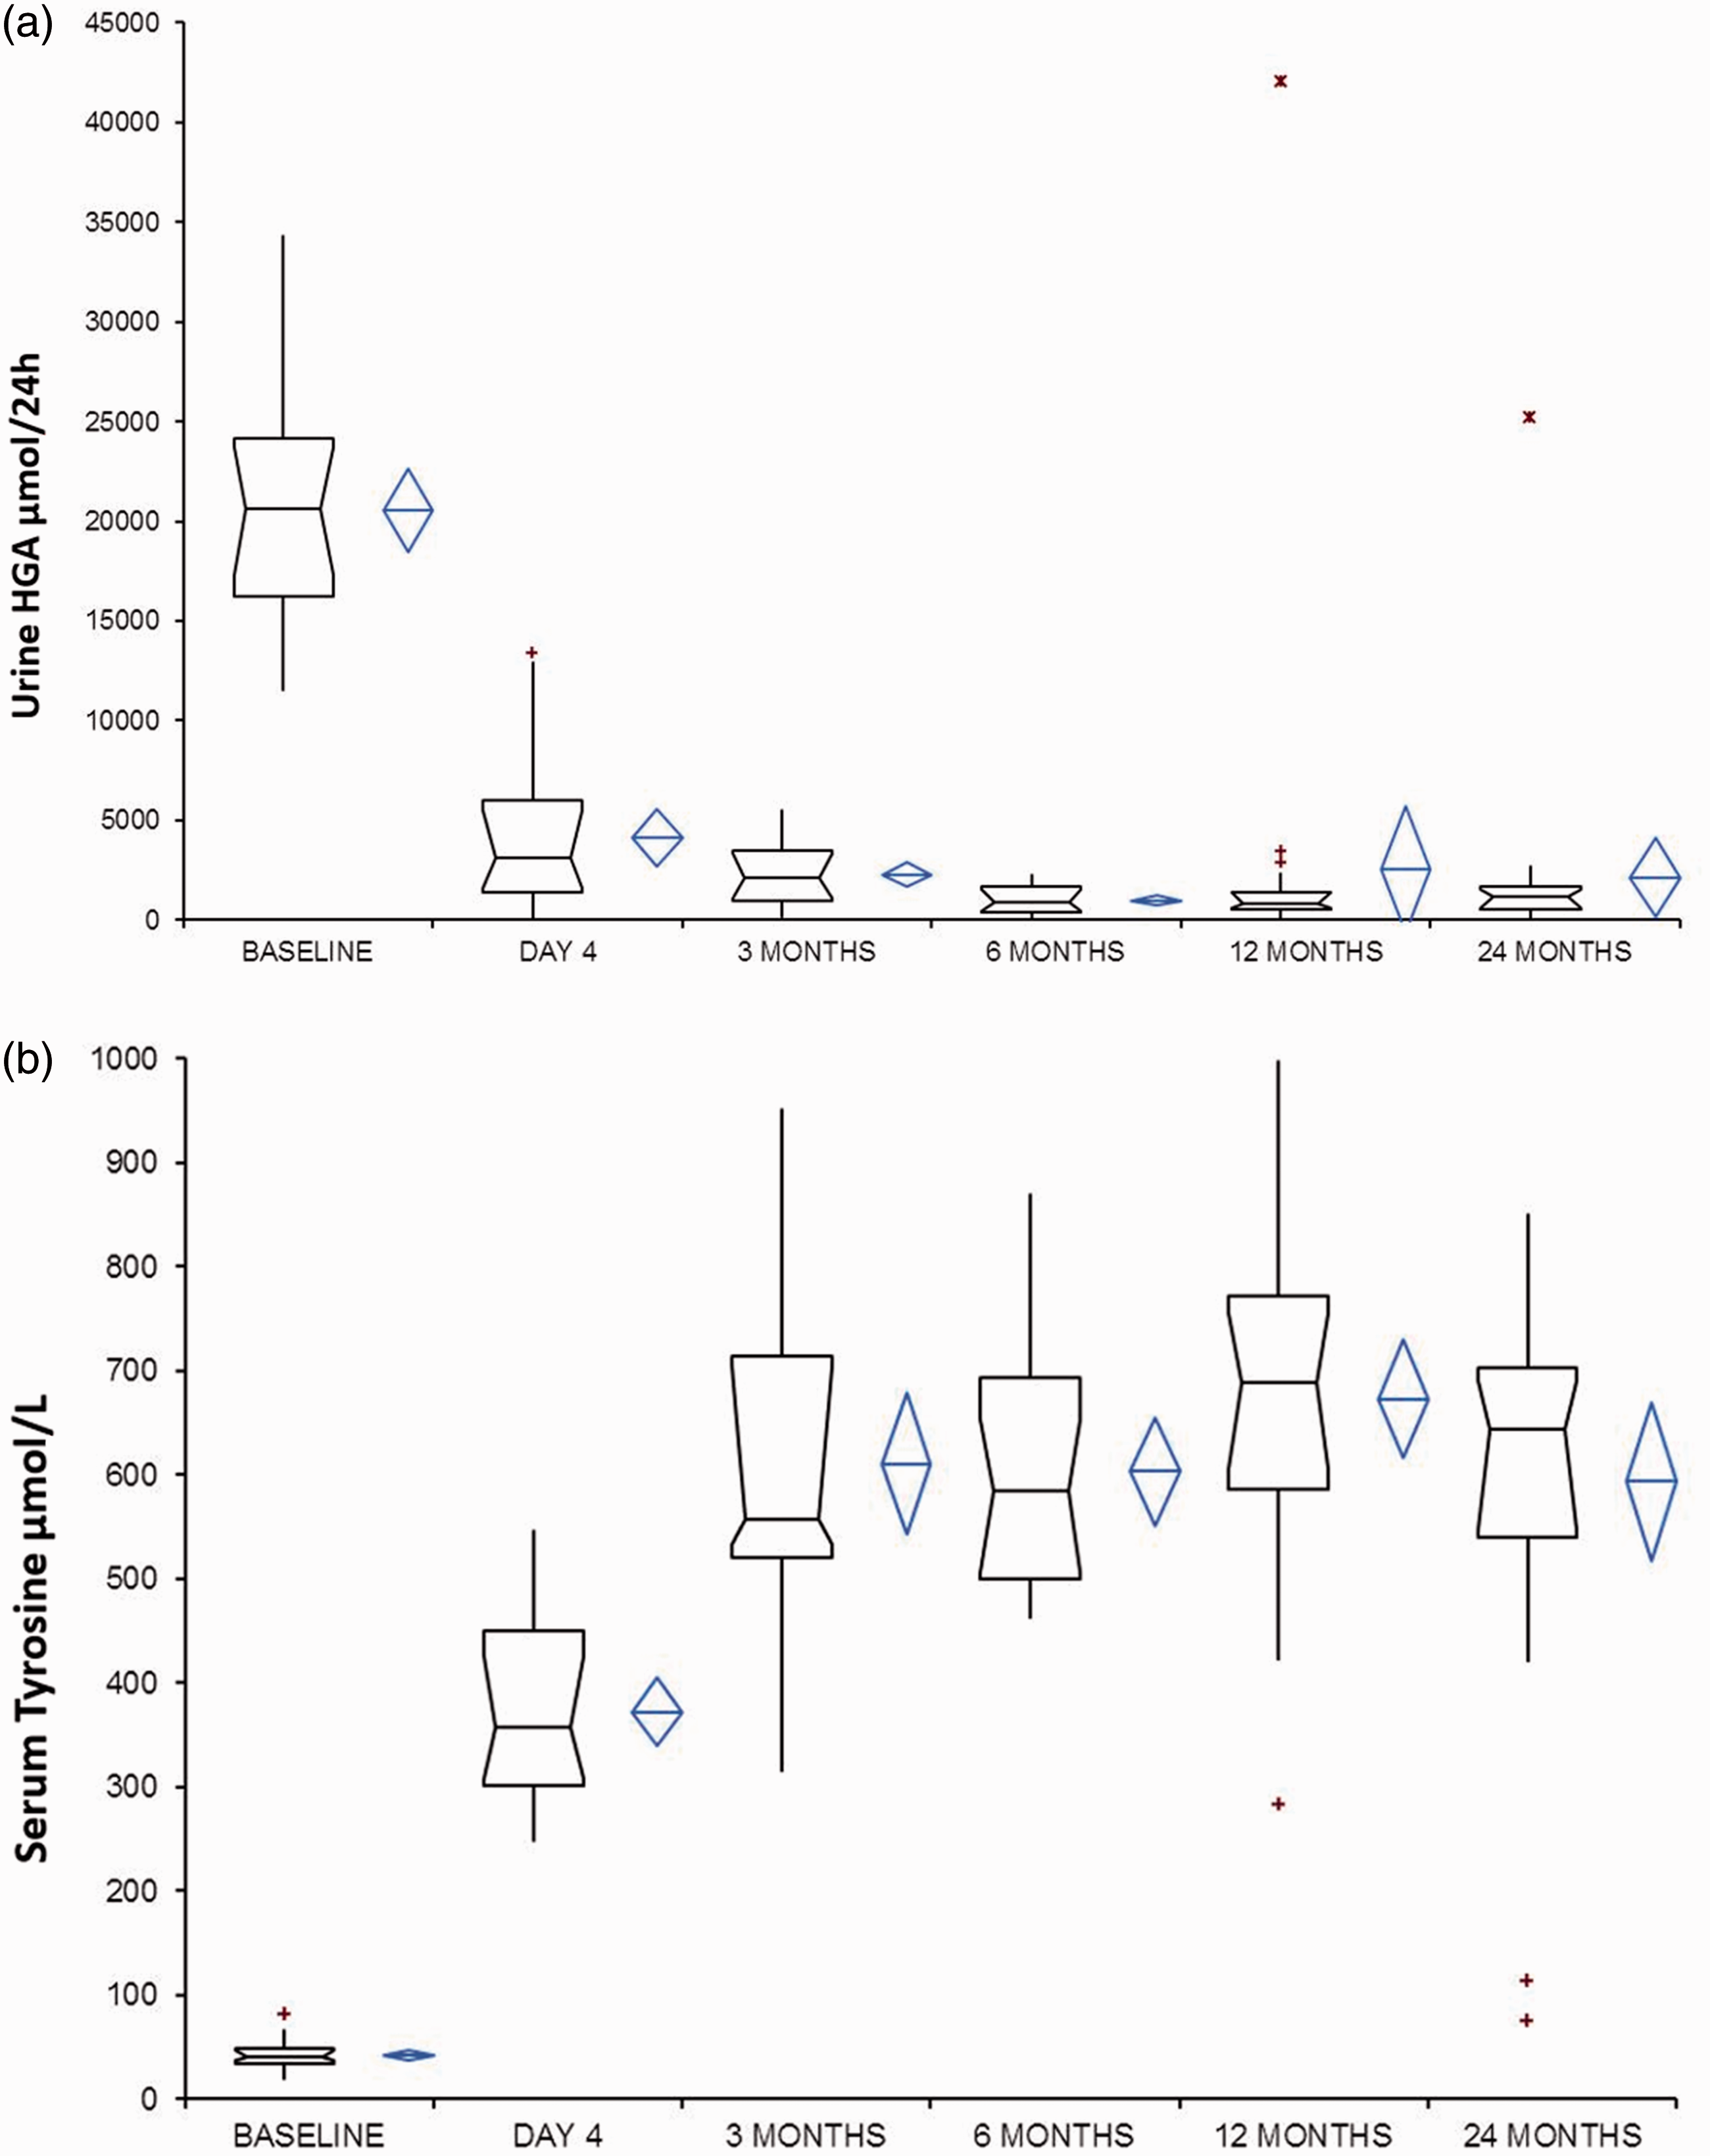
Inherent issues with 24-h urine collections can occur with incomplete collection, over-and under-collection being the major problems. Relating the u-HGA to creatinine (u-HGACr) demonstrated similar trends in reducing u-HGA with baseline average 2264 µmol/mmol creatinine reduced to 204 µmol/mmol at year two (a 94.0% decrease).
Serum tyrosine concentrations
At baseline, the mean serum tyrosine concentration was 42 µmol/L (range 20–82 µmol/L). The serum reference interval in adults is approximately 21–87 µmol/L, 19 so all patients with one exception are within the normal reference interval, which is characteristic of AKU. The exception is the patient already on NTBC and who is excluded from baseline statistics. Figure 2(b) and Table 2 demonstrate the trend of serum tyrosine pre and post NTBC treatment. There was a rapid increase two days after commencing NTBC, to a mean concentration of 373 µmol/L (range 249–546 µmol/L) with an average eight-fold increase (range 278–1552%). Following the rapid and significant increase (P < 0.0001), there is an additional significant increase at three months (P < 0.0001), between 6 months and 12 months (P = 0.181) and 12 months and year two (P = 0.0366). There is a large variation in tyrosine post-NTBC among patients reflecting the dietary protein contribution (unpublished data) and potentially the differing responses to NTBC.
Urine tyrosine
At baseline, the average urine tyrosine excretion per day (u-TYR24) was 103.1 µmol/24 h (range 15.7–417 µmol/24 h). In relation to creatinine, the average at baseline was 11.0 µmol/mmol (range 1.7–38.8 µmol/mmol). With NTBC therapy, urine tyrosine excretion increased with increasing serum tyrosine (Table 2). Mean u-TYR24 was 607 µmol/24 h at day four and at two years 1071 µmol/24 h, average six-fold and 10-fold increases, respectively. Similar to observations on serum tyrosine concentrations, a significant rise was seen comparing baseline to two days post-commencing NTBC (P = 0.0001) and day 4 to three months (P = 0.0375). There was no significant difference between the average urine tyrosine concentrations at subsequent monitoring periods.
Serum HGA
Serum HGA demonstrates a significant decrease upon commencing NTBC (Table 2). At baseline, there was a wide range of baseline serum HGA concentrations, similar to the range seen for urine HGA. Of note, all patients had eGFR > 60 ml/min/1.73m2 at baseline. The average serum HGA at baseline was 30.0 µmol/L (range 11.9–75.2 µmol/L). At two days after commencing NTBC, the serum HGA has decreased by 64.0% (P < 0.0001) and by three months 67.0% of baseline. The NTBC was increased to 2 mg daily at three months which results in a further decrease in serum HGA; at 6 months by 74.3% (n = 24), 12 months 82.7% (n = 26) and at 24 months 83.2% (n = 24). The difference seen between 6 months and 12 months is significant (P < 0.0001) with no further significant difference seen comparing 12-month to 24-month time periods.
No correlation was seen between serum and urine HGA concentrations at baseline (R2 = 0.1896 with µmol/24 h excretion; R2 = 0.223 with µmol/mmol excretion).
Serum NTBC
Serum NTBC was measured and at three months following treatment with 2 mg every other day, the mean serum NTBC concentration was 1.37 ± 0.57 µmol/L; the six month time window reflects the increase in dose to 2 mg every day with an average of 2.11 ± 0.64 µmol/L, a significant increase (P = 0.0003). NTBC concentrations then decrease significantly (P = 0.0056) at year one, compared with six months, with an average of 1.58 ± 0.52 µmol/L and by 24 months an average of 1.05 µmol/L (P = 0.0003) compared with 12 months (Table 2). Evidence of non-compliance was evident in one patient at six months and one year, with NTBC < 0.2 µmol/L – these were excluded from the significance testing above. Of note, the patient was compliant for year two assessment.
Adverse events
One adverse event occurred in a 21-year-old male who developed tyrosine keratopathy and a skin rash at seven weeks following 2-mg NTBC on alternative days. 22 NTBC was discontinued and the ocular symptoms, keratopathy and rash all resolved. NTBC was recommenced at 2 mg weekly which was tolerated with no reoccurrence of the ocular or skin problems. His u-HGA24 at baseline was 15,733 µmol/24 h, which decreased to 80% of baseline at one year, with weekly NTBC. Serum tyrosine at the time of the symptoms was 941 µmol/L and 582 µmol/L at year one.
Discussion
This is the first longitudinal survey of the off-licence use of NTBC for the treatment of AKU in a specialist hospital setting. Herein we report the impact of NTBC therapy on the tyrosine metabolic pathway over a two-year period. Previous authors have reported on the use of NTBC in treatment of AKU demonstrating efficacy of therapy,3,5,6,17 but only in a clinical trial setting. Introne et al. 5 demonstrated the utility of a 2 mg dose of NTBC over a three-year period. The methodology used for metabolite measurement resulted in 60% of serum HGA measurements being undetectable and therefore classified as in the reference range.
Sensitive and specific, LC-MS/MS methodology developed at The Royal Liverpool University Hospital4,20 has enabled the first measurement of serum and urine HGA in a non-AKU population. Studies performed in-house have demonstrated that serum HGA in non-AKU individuals is < 3.1 µmol/L 19 and as a consequence of our methodology, we have measured serum HGA concentrations in 96% of all samples. Therefore, a 2 mg daily dose of NTBC is not adequate to suppress serum HGA within the reference range, as previously thought. This is supported by the recent clinical trial published 3 where over a short period of time (four weeks), a dose dependent decrease was seen up to the highest tested dose of 8 mg daily.
Urine HGA was also measurable in all cases and again was not suppressed to the non-AKU reference range of < 2.91 µmol/24 h 19 on a daily 2 mg dose of NTBC. The lowest u-HGA concentration measured was 43 µmol/24 h at year two. There was significant reduction in u-HGA24 and serum HGA concentrations at six months when the NTBC dose was increased from 2 mg on alternative days to daily, at three-month time period. The reduction of urine HGA excretion by 94% at year two supports previous studies where a > 95% reduction was observed. 5 To obtain a greater reduction, it is suggested the NTBC dose may need to be increased; however, the long-term safety and efficacy of this are currently unknown. The circulating HGA concentrations (s-HGA) are of interest regarding the pathological progression of AKU; urine HGA represents the amount filtered and excreted, whereas serum HGA is effectively what is available for conversion to the ochronotic pigment, via the benzoquinone pathway. Within the NAC, the serum HGA concentrations are reduced by an average 83% from baseline on a 2-mg daily dose, suggesting there is still potential for pigment deposition, albeit on a reduced scale. The rapid decrease in both s-HGA and u-HGA seen at day 4 (post two doses of NTBC) has implications in cases where a rapid decrease in HGA is required, such as seen in haemolysis due to renal failure. 23
Tyrosine concentrations increased dramatically upon commencing NTBC which has previously been observed in both AKU and in the treatment of HT1. 16 However, the dose of NTBC used in HT1 is 1–2 mg/kg compared with 2 mg daily at the NAC. Due to the side effects and implications for development in children, serum tyrosine is ideally maintained < 400 µmol/L, 16 largely through diet restriction. Non-compliance with protein restriction in HT-1 has led to several reported ocular symptoms, including corneal crystals and opacities24–26; similar corneal opacities have been reported in AKU.5,22 In all cases, the corneal opacities resolved upon cessation of NTBC and normalization of tyrosine concentrations. The mechanism for the keratopathy has not been fully elucidated; however, there were patients in the NAC who had higher serum tyrosine concentrations and did not develop any ocular symptoms or side effects, suggesting a pre-disposition, independent of tyrosine concentrations. Diet restriction in adults is difficult and although patients at the NAC are advised about diet and protein intake and food diaries are maintained, no restriction is applied.
NTBC concentrations were determined when at steady state, with a relatively long half-life of approximately 50 h; this is at a minimum, 10 days post commencing treatment. Average serum concentrations were 2.11 ± 0.64 µmol/L at six months with a significant decrease at one year to 1.58 ± 0.52 µmol/L. Therapeutic concentration in HT1 is 20–120 µmol/L NTBC 27 ;however, there is no suggested therapeutic target for AKU. Previous studies have demonstrated similar serum concentrations with 1.39 ± 0.57 µmol/L on a 1-mg dose twice daily 17 and 2.22 ± 0.54 µmol/L, again on a 2 mg daily dose. 5 Although 2 mg daily dose is well tolerated, compliance has been an issue for a few individuals. This is clearly determined by routine biochemical measurements of tyrosine and HGA in both serum and urine. Urine HGA returns to high baseline concentrations and serum tyrosine to within the reference range. The significant dose dependent decrease in serum NTBC concentrations is not reflected by any concurrent rise in serum HGA concentrations or normalization of serum tyrosine; in fact, the serum HGA significantly decreases between 6 months and 12-month monitoring periods. Analytical issues were excluded with stability assays and re-analysis of earlier samples. Little is known about NTBC metabolism; it is known to bind tightly to the HPPD-inhibitor complex with a slow dissociation rate.28,29 Studies have demonstrated dose proportional pharmacokinetics using daily 1 mg to 8 mg NTBC doses; 30 however, this was only over a four-week period. Metabolism of NTBC is via CYP 3A4 and certain medications are inducers or inhibitors of this enzyme; there were no notable changes to the medications of the patients in this cohort. Ongoing studies into the metabolomic profiling of these patients on NTBC therapy will hopefully aid in understanding this change.
The survey of metabolic changes described herein provides biochemical evidence for the safe and efficacious use of NTBC therapy in lowering both urine and serum HGA in the treatment of AKU, with off-licence use of NTBC. Additional studies are on-going to determine if this will lead to a reduction in ochronosis, as seen previously in a mouse model. 8
Footnotes
Acknowledgments
The authors acknowledge all patients enrolled with the National Alkaptonuria Centre for their contribution to the study. They also thank The AKU Society for all the patient engagement and liaison and Agilent Technologies for their analytical support for the metabolic measurements.
Declaration of conflicting interests
The author(s) declared no potential conflicts of interest with respect to the research, authorship, and/or publication of this article.
Funding
This work was funded by the Department of Health’s NHS Highly Specialised Services Commissioning Group.
Ethical approval
The National Alkaptonuria Centre and all subsequent data analysis has been approved by the Royal Liverpool and Broadgreen University Hospital Trust Audit Committee (Audit no. ACO3836).
Guarantors
AMM and LRR.
Contributorship
AMM and ASD wrote the manuscript. ATH developed the method, performed all analysis and contributed to writing the manuscript. LRR is the director of the National Alkaptonuria Centre. All authors contributed to reviewing the article.