
Abstract
Background
Alkaptonuria is a rare debilitating autosomal recessive disorder of tyrosine metabolism, where deficiency of homogentisate 1,2-dioxygenase results in increased homogentisic acid. Homogentisic acid is deposited as an ochronotic pigment in connective tissues, especially cartilage, leading to a severe early onset form of osteoarthritis, increased renal and prostatic stone formation and hardening of heart vessels. Treatment with the orphan drug, nitisinone, an inhibitor of 4-hydroxyphenylpyruvate dioxygenase has been shown to reduce urinary excretion of homogentisic acid.
Method
A reverse phase liquid chromatography tandem mass spectrometry method has been developed to simultaneously analyse serum homogentisic acid, tyrosine and nitisinone. Using matrix-matched calibration standards, two product ion transitions were identified for each compound (homogentisic acid, tyrosine, nitisinone) and their respective isotopically labelled internal standards (13C6-homogentisic acid, d2-tyrosine, 13C6-nitisinone).
Results
Intrabatch accuracy was 94–108% for homogentisic acid, 95–109% for tyrosine and 89–106% for nitisinone; interbatch accuracy (n = 20) was 88–108% for homogentisic acid, 91–104% for tyrosine and 88–103% for nitisinone. Precision, both intra- and interbatch were <12% for homogentisic acid and tyrosine, and <10% for nitisinone. Matrix effects observed with acidified serum were normalized by the internal standard (<10% coefficient of variation). Homogentisic acid, tyrosine and nitisinone proved stable after 24 h at room temp, three freeze–thaw cycles and 24 h at 4℃. The assay was linear to 500μmol/L homogentisic acid, 2000μmol/L tyrosine and 10μmol/L nitisinone; increased range was not required for clinical samples and no carryover was observed.
Conclusions
The method developed and validated shows good precision, accuracy and linearity appropriate for the monitoring of alkaptonuria patients, pre- and post-nitisinone therapy.
Introduction
Alkaptonuria (AKU) is a rare autosomal recessive disorder (OMIM #203500) of the tyrosine degradation pathway (Figure 1). Deficiency of the third enzyme in the catabolic pathway, homogentisate 1,2-dioxygenase, results in accumulation of homogentisic acid (HGA). HGA is excreted in gram quantities in the urine, equivalent to mmol/L concentrations, and circulates at lower concentrations in the serum (μmol/L). Ancillary pathways of HGA metabolism result in oxidation of HGA to benzoquinones, which polymerize and bind to connective tissue proteins, in particular cartilage.1–5 This process leads to ochronosis; a blue-black discolouration of the connective tissues, the mechanism of which remains unclear. Ochronotic pigmentation causes early onset degenerative arthritis of the spine and large weight-bearing joints, leading to increased pain and premature joint replacement.4–6 Aortic stenosis has been described as a cardiac complication of the ochronosis process7,8 and can lead to aortic valve replacement. Additionally, an increased incidence of kidney stone formation is reported, and in males, an increase in prostate stones.2,6 The formation of benzoquinones results in additional formation of reactive oxygen species and free radicals, which are suggested to play a significant role in the aetiology of AKU arthritis.
9
Tyrosine degradation pathway.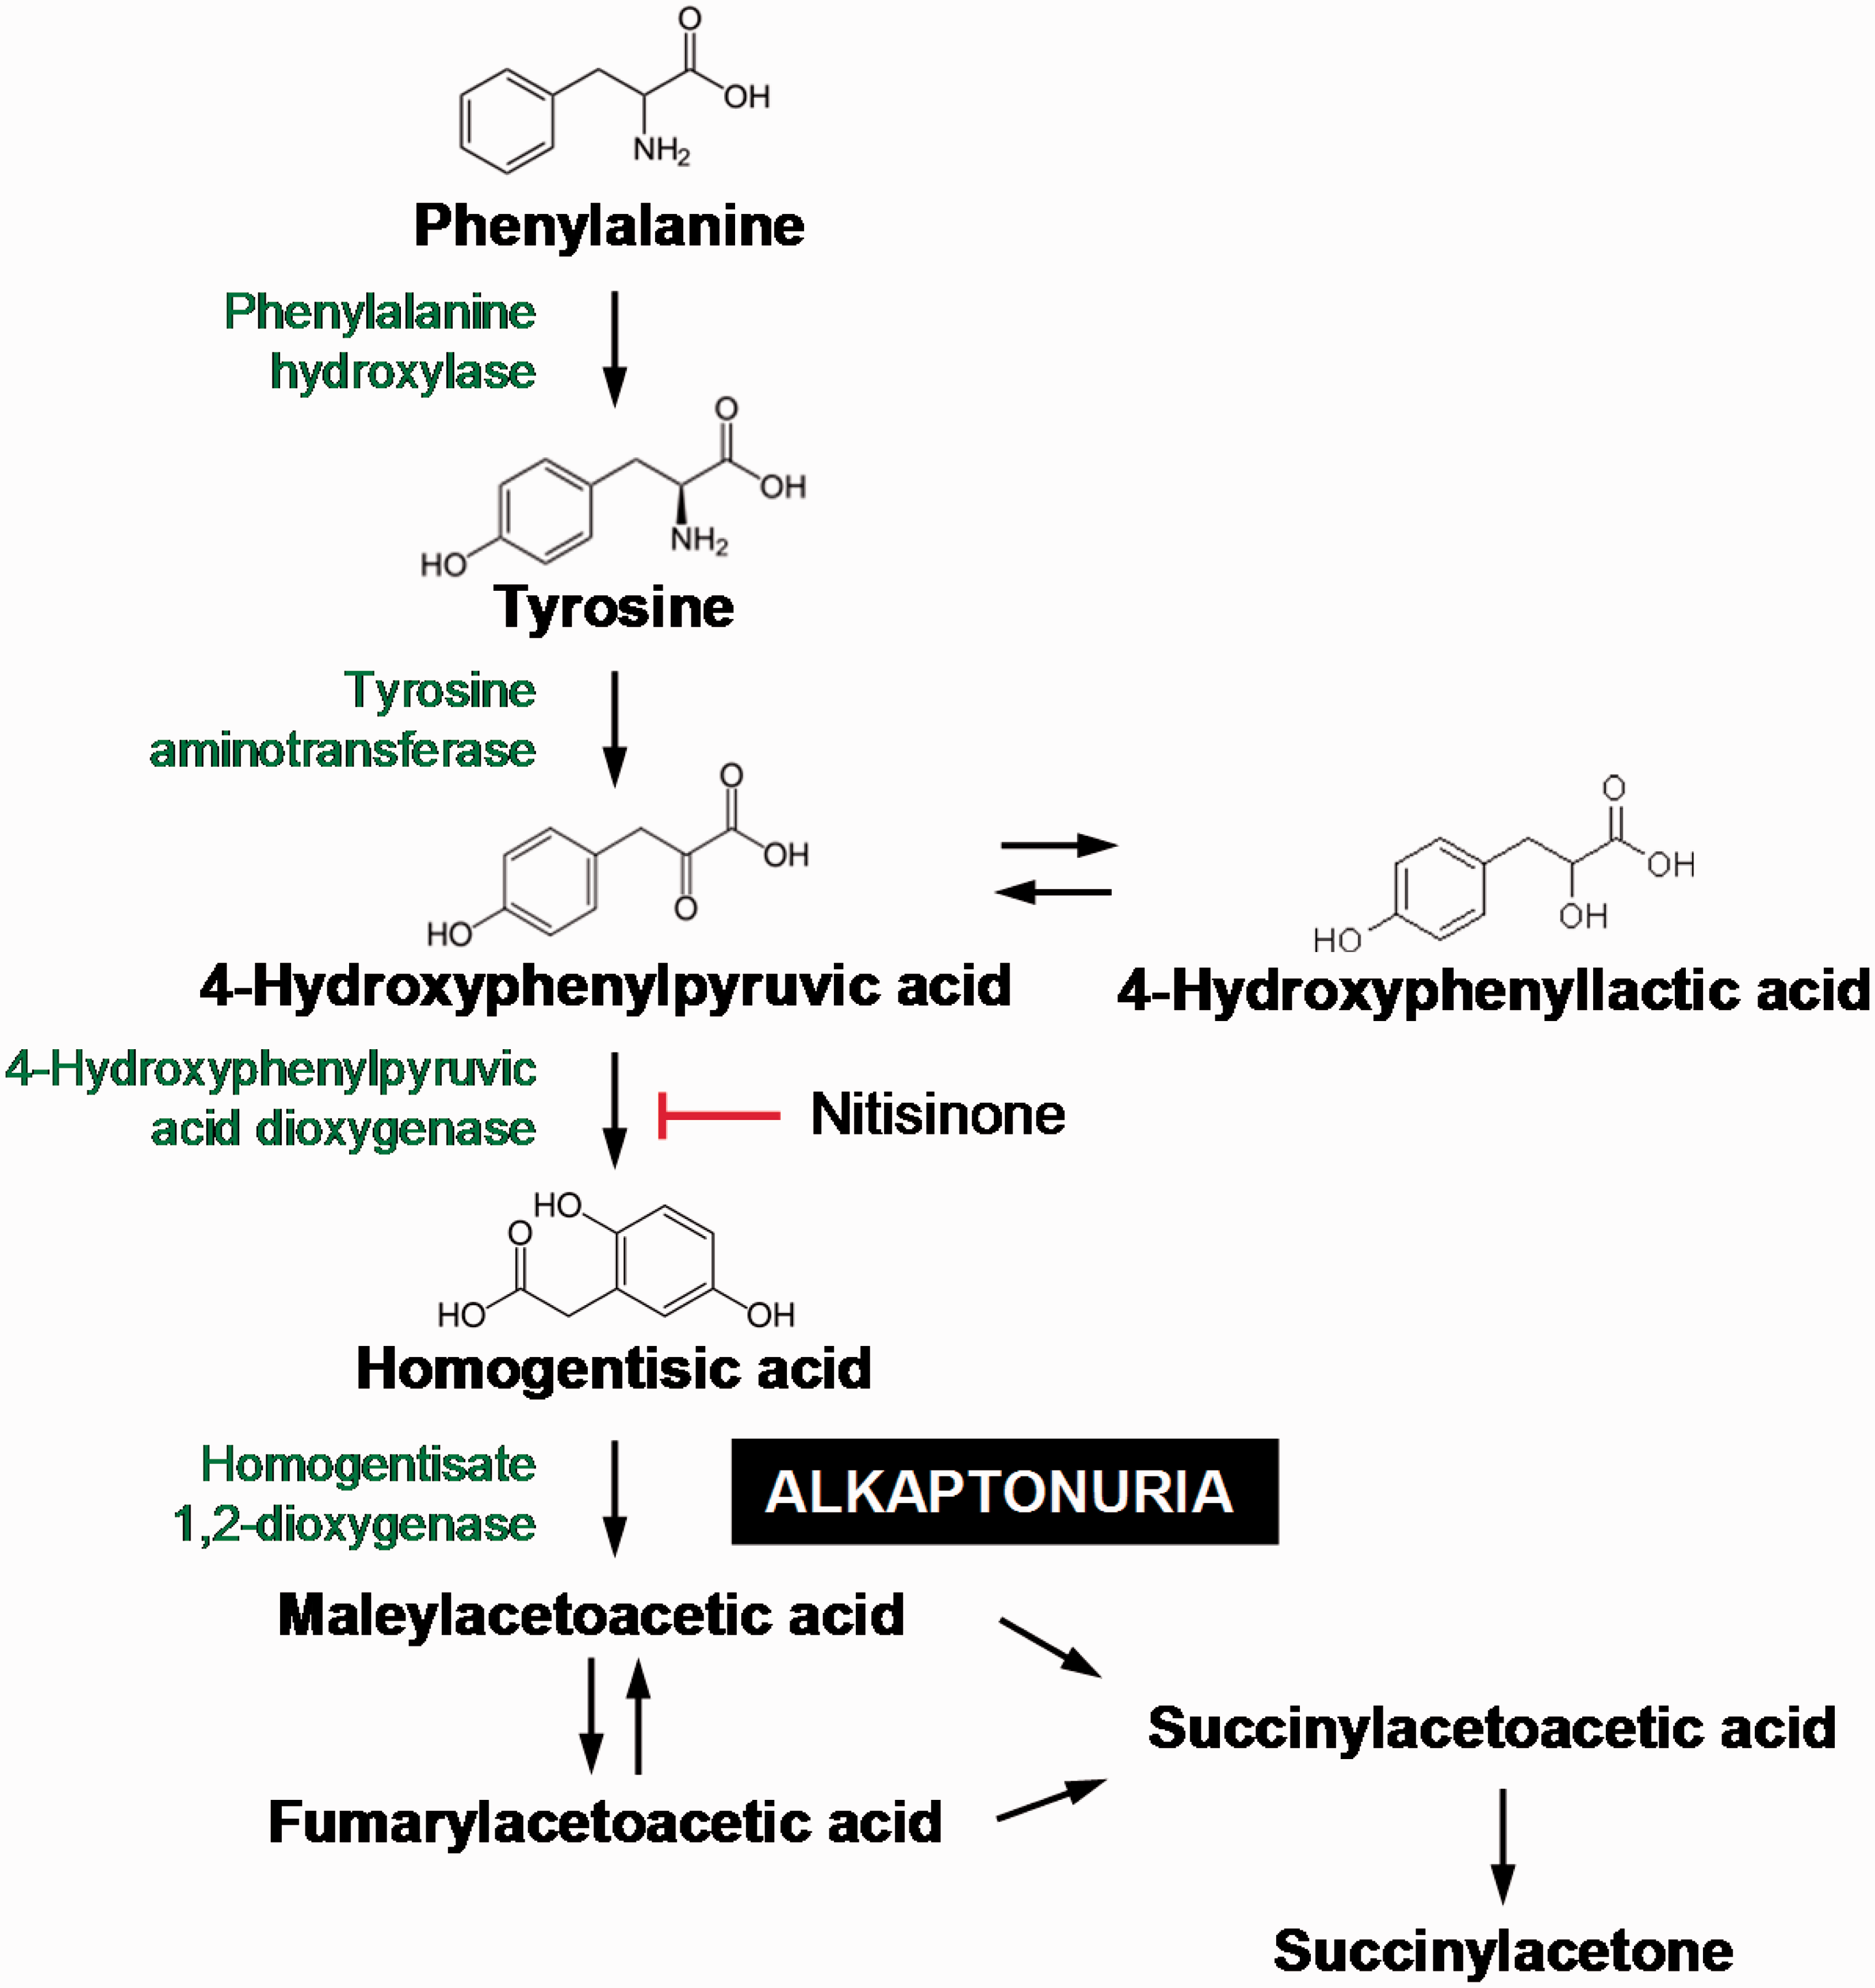
Current therapy for AKU is palliative, predominantly analgesia and arthroplasty. However, there have been several reported trials of nitisinone (2-[2-nitro-4-trifluromethylbenzoyl]-cyclohexane-1,3-dione).6,10–12 Nitisinone (NTBC) is a potent inhibitor of the second enzyme in the tyrosine pathway, 4-hydroxyphenylpyruvic acid dioxygenase which has been shown to lower circulating HGA and completely prevent pigmentation in AKU mice. 12 NTBC is approved for treatment of hereditary tyrosinaemia 1 (HT-1) (OMIM #276700) and is now considered first-line treatment, replacing liver transplantation.13,14 With regards to AKU, NTBC is currently being used at the National Alkaptonuria Centre (Royal Liverpool and Broadgreen University Hospital Trust, UK) as well as in a large multicentre clinical trial (DevelopAKUre Clinical Trials – www.akusociety.org) to evaluate its effectiveness in the treatment of AKU.
Previous methods for the measurement of serum NTBC have used high performance liquid chromatography (HPLC) with photometric detection, 15 capillary electrophoresis 16 and liquid chromatography tandem mass spectrometry (LC-MS/MS).17–19 Combined methods suitable for monitoring HT-1 have measured NTBC with several amino acids and metabolites in blood spots, suitable for paediatrics.20,21 To date there has been no published method for simultaneously monitoring NTBC, HGA and tyrosine concentrations in serum. The diagnosis of AKU relies on clinical presentation and evaluation and analysis of both urine and serum HGA. Treatment with NTBC, while suppressing HGA production, circulation and secretion, results in a rapid increase in serum tyrosine concentrations, hence monitoring is essential for patient safety. Additionally circulating HGA is important pathophysiologically in AKU, due to conversion to the damaging ochronotic pigment, therefore analysis and monitoring is novel andcrucial for clinical management. A method for simultaneously monitoring urine HGA and tyrosine has previously been described. 22 Herein we describe development and validation of an LC-MS/MS method for the simultaneous measurement of serum HGA, tyrosine and NTBC concentrations.
Materials and methods
Chemicals and materials
Tyrosine, tyrosine isotope-labelled internal standard (d2-tyrosine) and HGA were obtained from Sigma-Aldrich UK. HGA isotope-labelled internal standard, 13 C6-HGA was obtained from Larodan Fine Chemicals (Sweden). NTBC was generously provided by Swedish Orphan Biovitrum AB (publ). NTBC isotope-labelled internal standard, 13 C6-NTBC was obtained from Toronto Research Chemicals (Canada). LC-MS/MS grade methanol and acetonitrile were obtained from Sigma Aldrich, UK. Formic acid was obtained from Biosolve. Water was purified in-house by DIRECT-Q 3UV Millipore water purification system. All dilutions and sample preparation were performed in glass. Oxygen free nitrogen was supplied by a Peak nitrogen generator.
LC-MS/MS analysis
All analyses were performed on an Agilent 6490 triple quadropole LC-MS/MS with Jet-Stream® electrospray ionization (ESI-MS/MS) equipped with an Agilent 1290 infinity pump and autosampler. All data processing both qualitative and quantitative analysis was performed using Mass Hunter software package.
Chromatographic separation was performed on an Atlantis C18 column (100 mm × 3.0 mm, 3 μm, Waters, UK) maintained at 35℃. Initial gradient conditions were 80:20 water:methanol with 0.1% formic acid (v/v) increasing linearly to 10:90 in 2.5 min. The mobile phase was maintained for a further 1.1 min, increased to 100% methanol for 1 min and then returned to starting conditions (flow rate 0.4 mL/min). The column was reconditioned for 2 min prior to the next injection. Two microlitres of sample was injected with a total run time of 7.0 min. Optimum operating ESI conditions were gas temperature 150℃ (nitrogen), gas flow 17 L/min; nebulizer pressure 40 psi; sheath gas temperature 320℃ and sheath gas flow 12 L/min. Capillary voltages were optimized to 3500 V in positive mode and 2500 V in negative mode with equal nozzle voltages (1500 V) in both modes. The iFunnel parameters were optimized in both negative and positive mode as 60 V for low pressure RF and 110 V for high pressure RF.
Preparation of standards, reagents and QC samples
Super-stock standard solutions of HGA and tyrosine were prepared in 0.5 N sulphuric acid and deionized water at concentrations of 100 and 400 mmol/L, respectively. NTBC was stored at a concentration of 1 mmol/L in 50:50 acetonitrile:deionized water, respectively. These were stored at –20℃.
l-tyrosine-(phenyl-3,5-d2) super stock was prepared at 100 mmol/L in 0.1 N sulphuric acid. An intermediate stock of 1 mmol/L was prepared by dilution in deionized water and stored at –20℃. 13 C6-HGA was reconstituted at 1 μg/L (5.75 mmol/L), in deionized water with an intermediate 250 μmol/L stock in deionized water, stored at –20℃. An intermediate stock of 1 μmol/L 13 C6-NTBC was prepared by dilution in 50:50 acetonitrile:deionized water and stored at –20℃.
To ensure matrix-matched calibration, super-stock aqueous standard solutions were added to a serum matrix base pool (steroid depleted serum, BBI Solutions, SF236-7). The serum base was assayed prior to preparation to verify minimal endogenous tyrosine, suitable for standard addition (tyrosine assayed as ≈1.5 μmol/L). The super-stock standards were diluted to intermediate stocks at 10 times the final required concentration.
Studies have identified that HGA is unstable in an alkaline environment, leading to benzoquinone formation and subsequent ochronotic pigment; urine collections require acidification to stabilize the HGA and it has been suggested that serum samples may require deproteinization. 23 With this in mind, the serum assay described herein was developed to ensure stability of HGA, with serum acidification and deproteinization (perchloric acid) and comparison with deproteinization only (acetonitrile).
These were then added to serum pool in a ratio of 1:9 which was then treated with (a) 60% perchloric acid (5.8 N) (ratio 1:11) = acidified serum or (b) acetonitrile 4:1, mix and centrifuge; 10 μL supernatant removed, dried and reconstituted in 2 mL combined internal standard solution (non-acidified serum). Both preparation methods resulted in combined calibrators with final concentrations of tyrosine 10–2000 μmol/L, HGA 15-500 μmol/L and NTBC 0.5–10 μmol/L and dilution of 1:1000 of sample in internal standard solution.
A combined internal standard solution was used as the sample diluent, containing final concentrations of 0.2 μmol/L 13 C6-HGA, 2 μmol/L d2-tyrosine and 2 nmol/L 13 C6-NTBC in 0.1% formic acid (v/v). Internal standard concentrations were titrated to ensure a response (area of analyte/area of internal standard) of approximately 1.0 at the midpoint of the calibration curve to ensure adequate sensitivity at the lower end of the calibration range while ensuring accuracy across the dynamic assay range. Quality controls were prepared independently, from separate stocks pools, in the same manner as the standards. All samples, calibrators and quality controls were assayed on a 1 in 1000 dilution with the internal standard solution. Calibrators and quality controls were spiked from separate stocks of HGA, tyrosine and NTBC.
Assay validation
The assay was validated using in-house protocols based on published guidance.24–26 Method validation evaluated linearity, accuracy, imprecision, lower limit of quantification (LLOQ), matrix effect, carryover and stability. Comparison of tyrosine was performed with a HPLC, post-column ninhydrin detection method in a referral laboratory.
Patient sample analysis
Three patients with AKU were analysed pre- and post-NTBC therapy to demonstrate the suitability of the assay. The serum samples were collected and acidified with perchloric acid (as per the acidified assay protocol) and analysed with the appropriate calibration standards.
Statistical analysis
Data were compared using unpaired t-test, computed on Instat (GraphPad, version 3.0). Regression analysis was performed using Analyse-it package for Microsoft Office.
Results
Identification and separation of HGA, tyrosine and NTBC
Parameters for mass spectrometry detection of tyrosine, nitisinone (NTBC) and homogentisic acid (HGA).
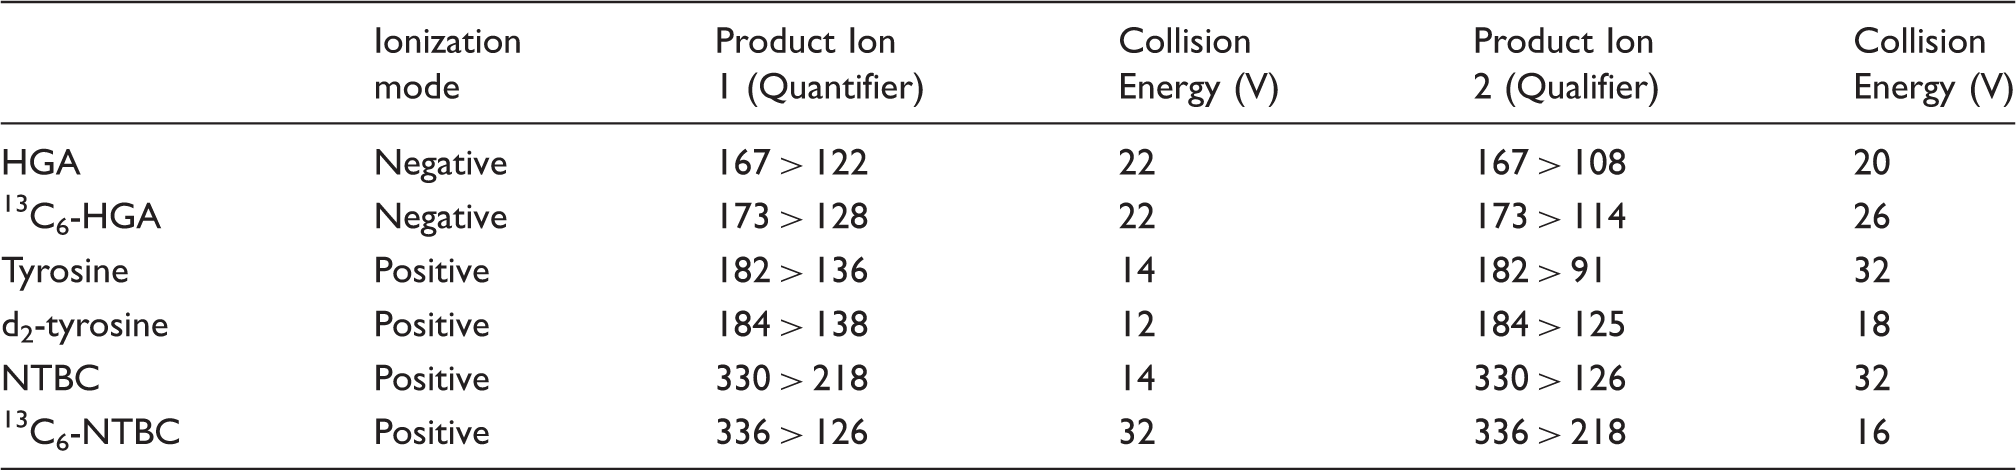
Figure 2 shows a typical chromatogram for the primary product ion (quantifier) for each precursor, demonstrating the chromatographic separation of HGA, tyrosine and NTBC in the serum matrix. No difference was observed in retention times of HGA, tyrosine or NTBC upon comparison of acidified and non-acidified serum matrices.
Chromatogram of HGA, tyrosine and NTBC, respectively (200, 810 and 4 µmol/L) with their respective internal standards.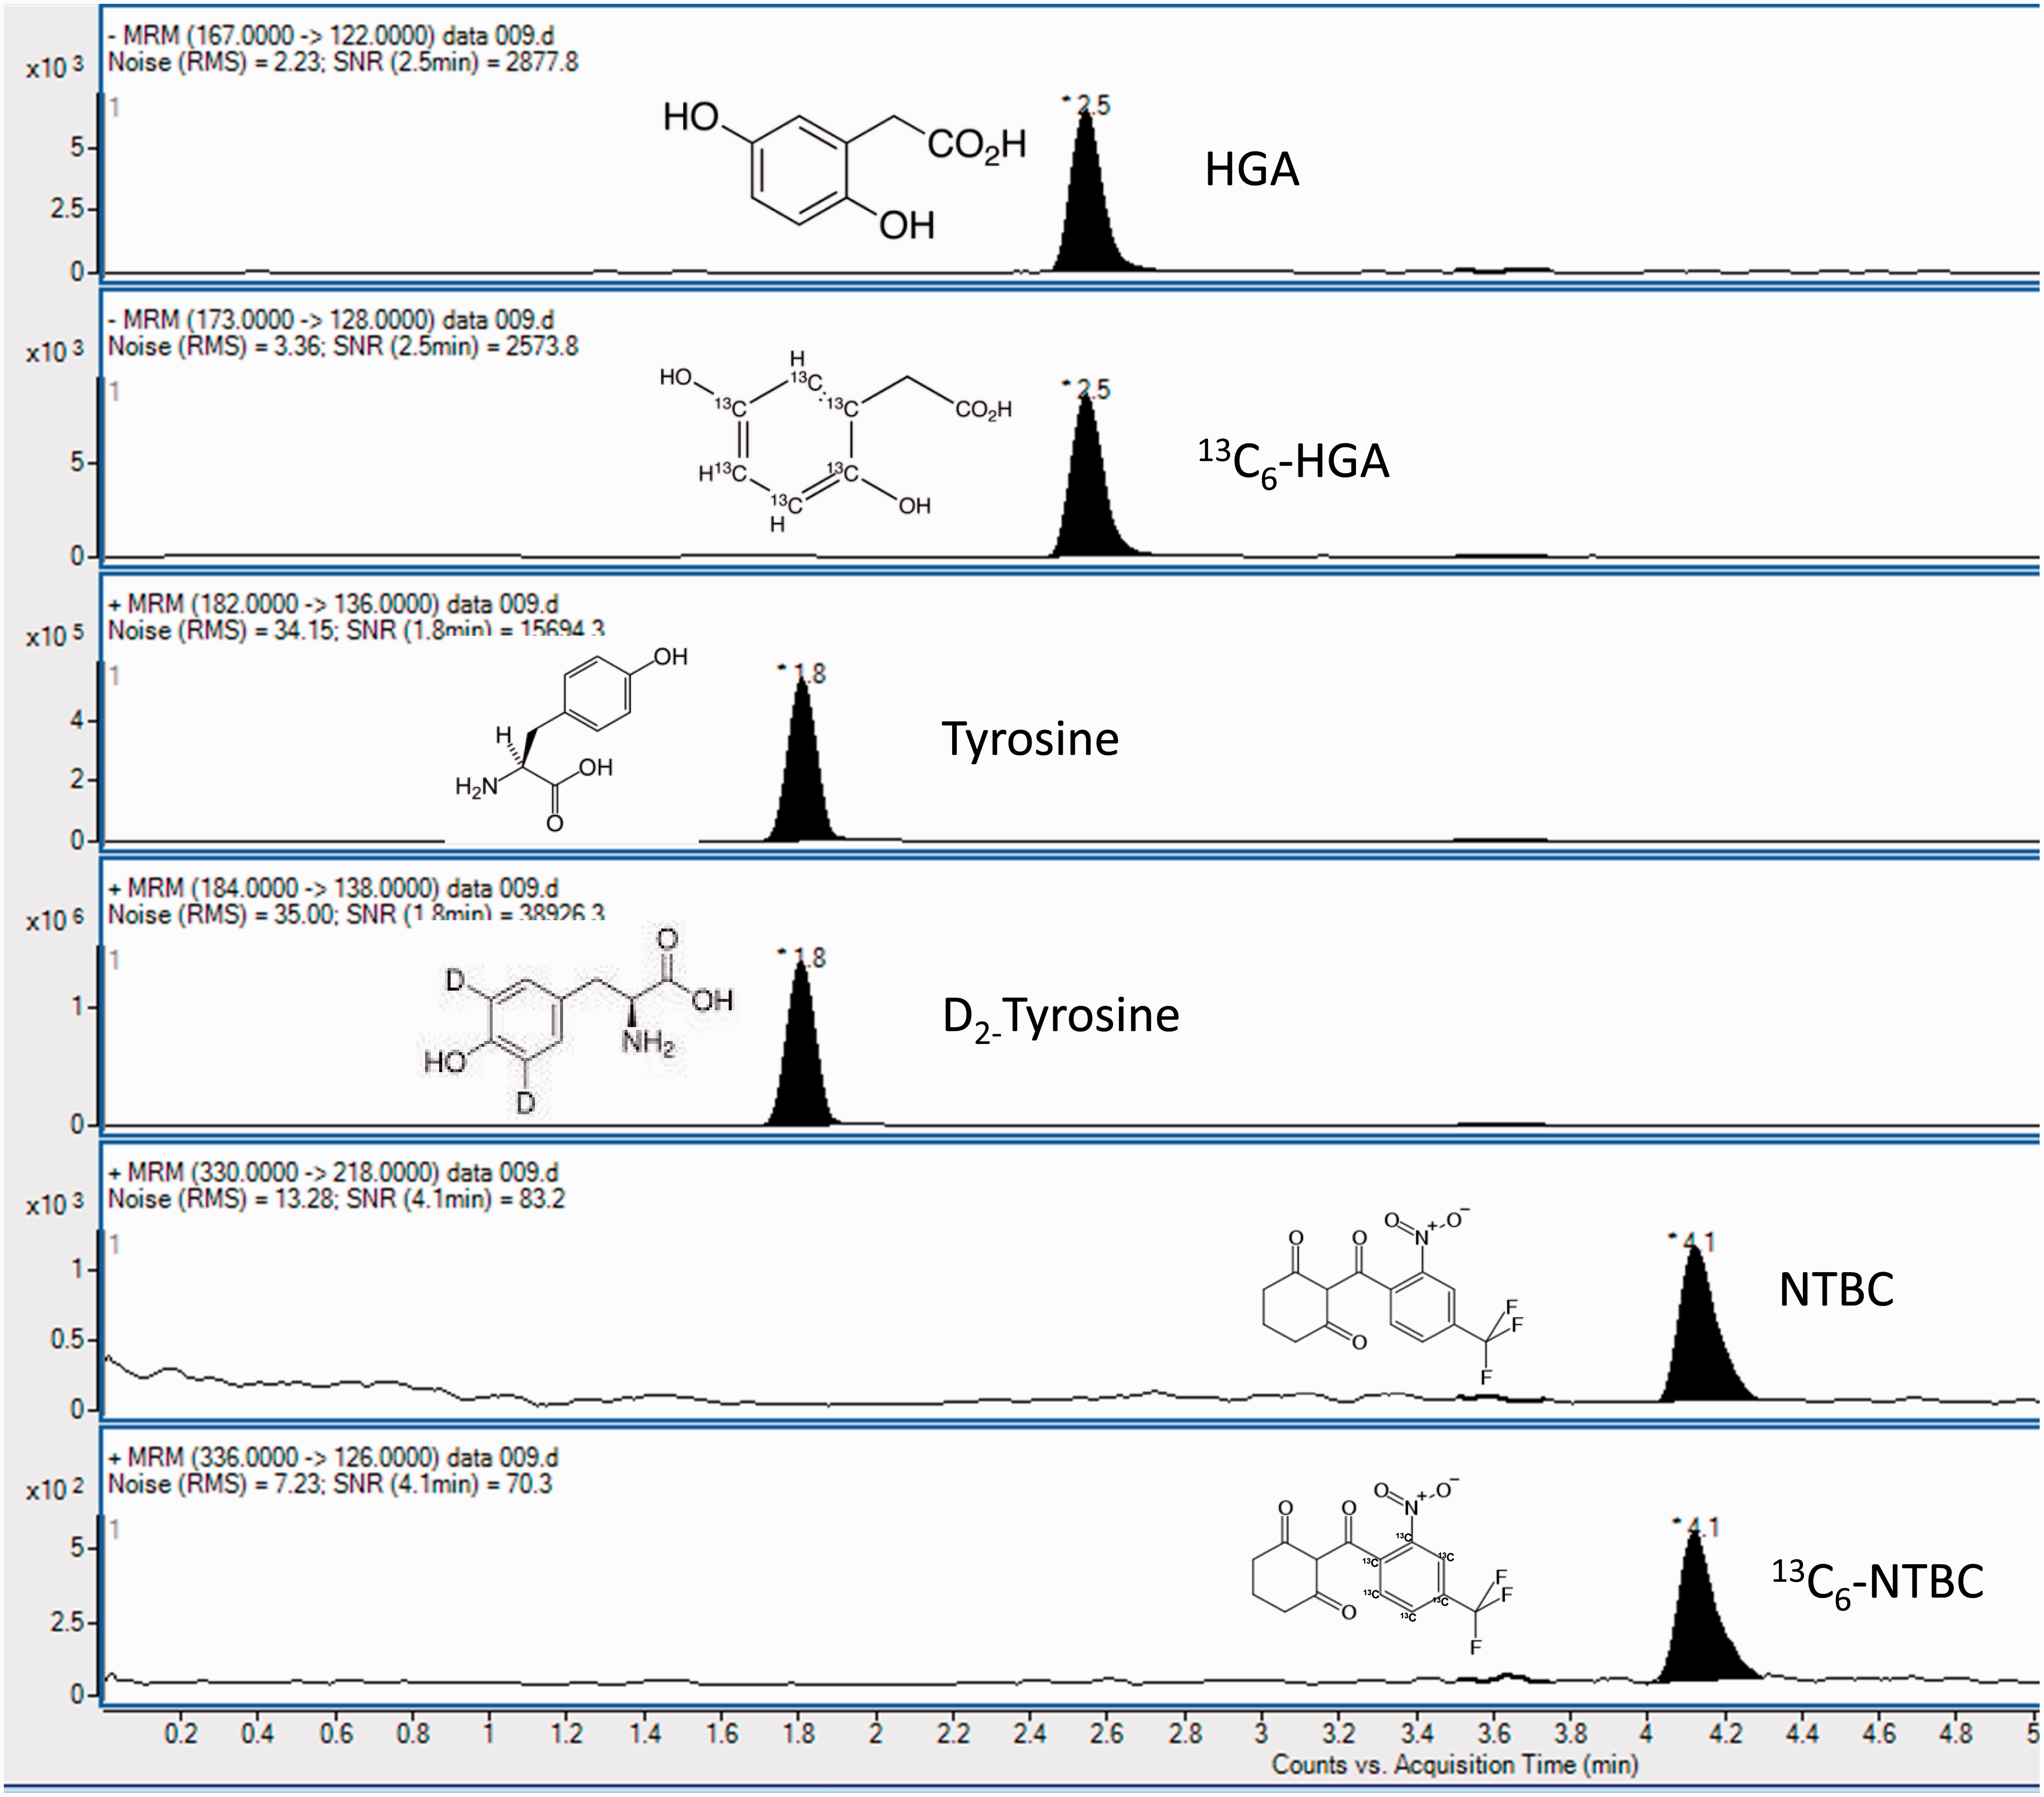
Method validation
Calibration standard curves, six points plus serum blank (not a true blank due to endogenous tyrosine) exhibited a good fit over the range examined with minimal inter-assay variability. Linear regression (1/x weighting factor) of the perchloric acid precipitated serum (acidified serum) HGA r2 = 0.997 (n = 9), tyrosine r2 = 0.998 (n = 9) and NTBC r2 = 0.993 (n = 9). In the non-acidified serum assay, HGA r2 = 0.997 (n = 8), tyrosine r2 = 0.998 (n = 8) and NTBC r2 = 0.997 (n = 8). The concentration ranges covered were HGA 15–500 μmol/L, tyrosine 10–2000 μmol/L and NTBC 0.5–10 μmol/L. The gradient on the calibration line showed equal consistency.
Comparison of NTBC values obtained between non-acidified and the acidified assay was comparable (r2 = 0.970; y = 1.014 x + 0.003; 95% CI for slope 0.94–1.09). This was verified by analysing 25 serum samples obtained from patients with AKU, on treatment, with both acidified and non-acidified prepared samples. The correlation of results obtained on the appropriate standard curve was r2 = 0.949 for HGA (y = 1.005 x–0.09; 95% CI for slope 0.91–1.10) and r2 = 0.989 for tyrosine (y = 0.970 x + 13.6; 95% CI for slope 0.93–1.01).
Intra- (n = 6) and inter-batch (n = 21) accuracy in acidified and non-acidified urine. Results are expressed as mean ± SD (percentage coefficient of variation).
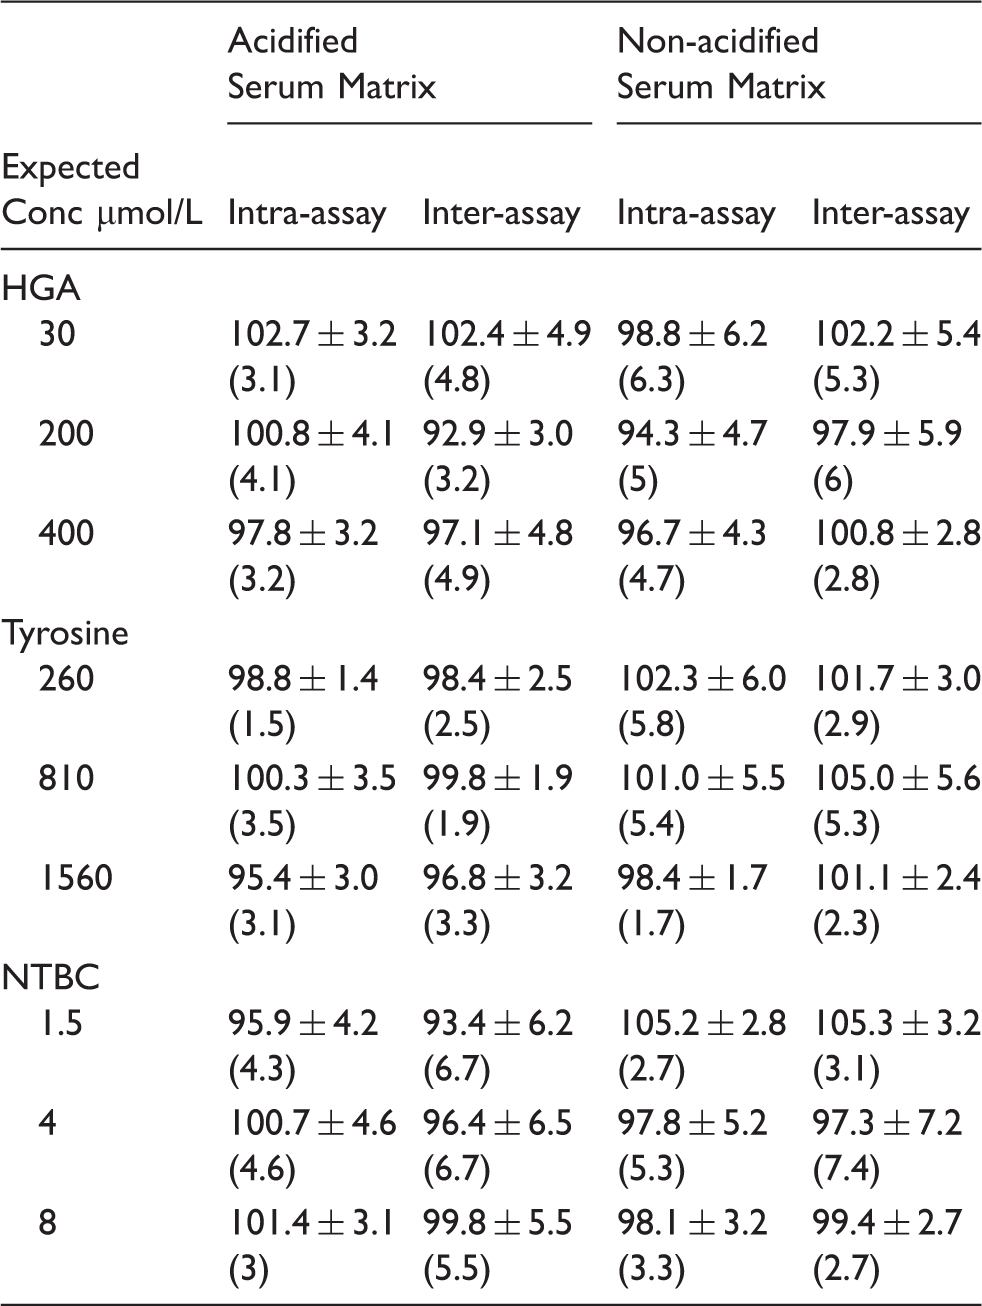
In acidified (perchloric acid precipitated) serum, intra-assay accuracy was 94–108% for HGA (n = 6), 95–109% for tyrosine (n = 6) and 89–106% for NTBC (n = 6) with inter-assay accuracy of 88–108% for HGA, 91–104% for tyrosine and 88–103% for NTBC (n = 21). In the non-acidified serum, the intra-assay accuracy (n = 6) was 88–107% for HGA, 93–110% for tyrosine and 93–108% for NTBC, similarly inter-assay accuracy (n = 21) was 86–110% for HGA, 98–114% for tyrosine and 84–114% for NTBC.
Imprecision (%CV), both intra- and inter-assay was determined in both acidified and non-acidified serum matrices across a broad concentration range, covering pre- and post-NTBC therapy concentrations. In the acidified serum matrix, intra-assay precision (n = 6) was <5% for HGA across 15–500 μmol/L and 8.6% at 3 μmol/L; <5% for tyrosine (60–2000 μmol/L) and 9.4% at 10 μmol/L; <6% for NTBC (1.0–10 μmol/L) with 10.3% at 0.5 μmol/L. Inter-assay precision (n = 21) in acidified serum was <8% for HGA (15–500 μmol/L) and 11.7% at 3 μmol/L; <5% for tyrosine (60–2000 μmol/L) and 11.7% at 10 μmol/L; <10% for NTBC across whole range 0.5–10 μmol/L.
Similar precision was seen in the non-acidified serum matrix for HGA with %CV <8% both intra- and inter-assay for HGA. Serum tyrosine exhibited slightly higher intra- and inter-precision in the non-acidified but <10% across the whole concentration range examined. NTBC was <7% for intra-assay and inter-assay precision across the concentration range 0.5–10 μmol/L.
The LLOQ, defined as the lowest calibrator which satisfies a CV≤20%,24–26 for HGA in both acidified and non-acidified serum was 3 μmol/L, for tyrosine 10 μmol/L and NTBC 0.2 μmol/L. Signal:noise at these concentrations was >100:1, so additional sensitivity is possible especially considering the small injection volume, but was not necessary from a clinical perspective for the assay described herein.
The matrix effect of both acidified and non-acidified serum was assessed across the concentration range for HGA, tyrosine and NTBC, with six individual serum matrices (both acidified and non-acidified). Results demonstrated a greater matrix effect in acidified serum for HGA and tyrosine (average 50% suppression), compared with non-acidified serum (HGA 25% and tyrosine 3% suppression). No matrix effect was seen for NTBC in either acidified or non-acidified serum matrices. Internal standards demonstrated similar suppression resulting in all analytes exhibiting a %CV of <10% for the internal standard normalized matrix factor, satisfying validation criteria.24–26
Following injection of the top calibrator (500 μmol/L HGA, 2000 μmol/L tyrosine and 10 μmol/L NTBC) there was no clear visible peak at the retention time of HGA, tyrosine or NTBC, on five subsequent water injections. Integration of background noise/chromatography gave a calculated % area of the LLOQ of <1.5% for all analytes in both acidified and non-acidified serum. The internal standards were calculated as <0.5% for 13 C6-HGA, d2-tyrosine and 13 C6-NTBC in both acidified and non-acidified serum matrices.
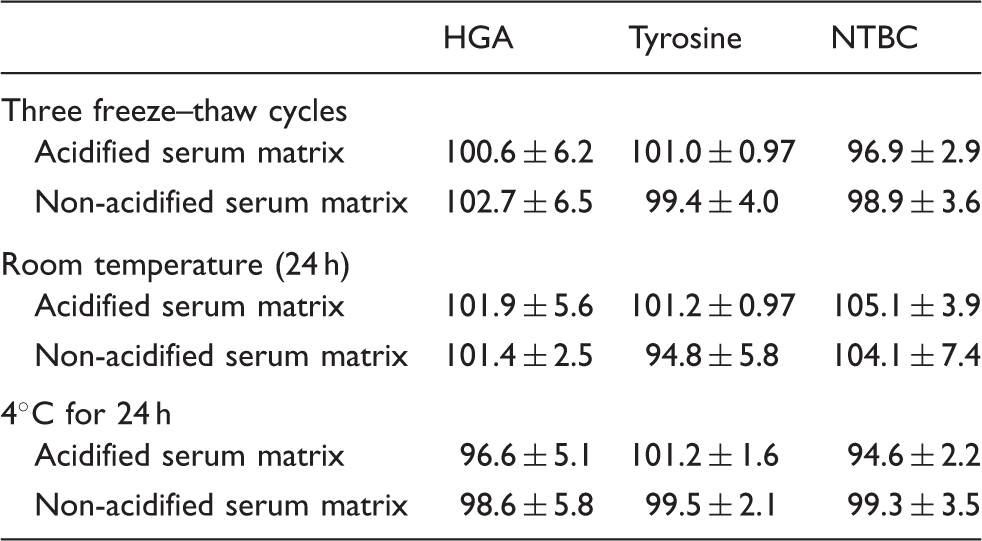
Summary of stability data for HGA, tyrosine and NTBC in serum matrices. Results expressed as average recovery of nominal values over low, medium and high concentrations (n = 15, 5 at each concentration).
Comparison of 50 serum samples (acidified upon collection) for tyrosine was performed compared with a referral laboratory assay (cation exchange chromatography using Biochrom amino acid analyser with post-column ninhydrin detection at 570 nm). The values ranged from 25 to 1200 μmol/L, representing pre and post-NTBC treatment. The line of best fit was y = 0.96 x–7.13, r2 = 0.979. EQA performance (ERNDIM serum amino acid scheme) demonstrated satisfactory performance for serum tyrosine over a six-month period (within ±2SD of target and method mean).
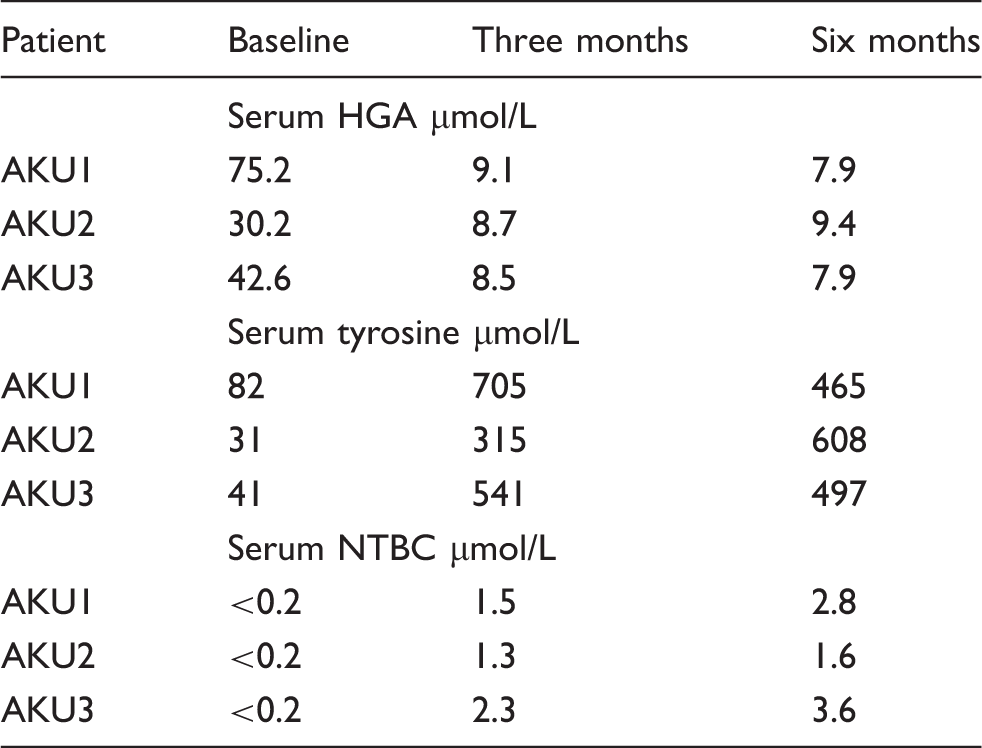
Serum concentrations of HGA, tyrosine and NTBC in AKU patients, pre- and post-NTBC treatment.
Discussion
A LC-MS/MS method has been validated for the simultaneous quantitation of serum HGA, tyrosine and NTBC. To date, this is the first published method for quantitation of all three analytes in a single method, in serum. A method with simple sample preparation and a 7 min chromatographical separation has been validated, which is sensitive and specific with favourable accuracy and precision performance.
To maintain assay integrity, the calibration standards and quality control pools have been matrix matched, in either acidified or non-acidified serum. The variation of matrix was determined to be minimal ensuring reproducibility batch to batch with regards to the matrix. Although many methods utilize an aqueous matrix (phosphate buffered saline, water, organic solvents) as a base for in-house calibration standards, this does not contain other key constituents present in patients’ samples, e.g. proteins, electrolytes, urea and creatinine and as such may not mimic the performance seen by the patient sample matrix. The authors advocate using a matrix as similar to the sample base to be analysed and it is a requirement of several key method validation guidelines.24–26
Determination of the matrix factor demonstrated signal suppression with a serum matrix for HGA and tyrosine and a difference upon serum acidification. However, the isotopically labelled internal standards corrected for this suppression as evidenced by the internal standard normalized matrix factor. It cannot be assumed that internal standards will always correct for matrix effects, as is sometimes evident, especially with deuterated internal standards: a phenomenon called differential matrix effects. 27
Validation of the assay was performed in both an acidified serum matrix and a non-acidified serum matrix (precipitated with acetonitrile). Previous studies with mice have suggested that HGA is unstable in alkaline urine and in unpreserved serum samples, 23 hence the validation of an assay for acidified serum. Stability has been assessed short term, representative of routine sample collection and sample analysis time, but long-term stability is currently being assessed. Stability of HGA, tyrosine and NTBC were shown to have no significant difference over the time periods presented. Although little difference was observed, due to the previous evidence for long-term stability, acidified serum is the current sample of choice, especially considering long-term storage of trial samples and transport of sample to the National AKU Centre for analysis.
Previous methods for NTBC are for HT-1 monitoring which has a suggested therapeutic range of 20–120 μmol/L NTBC 19 ; although there is no therapeutic target for AKU, patients on 2 mg daily have NTBC concentrations 1–3 μmol/L at steady state (unpublished data from the National AKU Centre, 2 mg NTBC post six months treatment, n = 38). The assay described herein is more sensitive than previously published methods, with a LLOQ of <0.2 μmol/L (CV<10%) in comparison with 0.75 μmol/L (intra-assay CV 12%, inter-assay CV 20%). 19 Dried blood spot analysis of NTBC by LC-MS/MS demonstrated similar performance characteristics albeit with a LLOQ of 0.3 μmol/L; however, precision was only examined at concentrations of >5 μmol/L. 21
Data from the National AKU Centre in Liverpool, UK (unpublished), and previously reported trial data 10 demonstrate that HGA is excreted in mmol/L concentration in the urine of patients with AKU. Once they are commenced upon NTBC the concentration drops to μmol/L. The effect of suppressing HGA is a concurrent rise in serum tyrosine. Table 4 demonstrates a typical biochemical response to NTBC with a snapshot of the study data. Serum tyrosine rises >10-fold by three months of NTBC therapy. Although data are not included, this rise occurs within the first week of NTBC therapy. The rapid and significant rise in tyrosine requires monitoring to ensure the safety and efficacy of NTBC therapy. In addition to metabolite measurement, all patients attending the National AKU Centre in Liverpool are treated and monitored with a low protein diet.
NTBC has been used in the treatment of HT-1, albeit at significantly higher doses up to 2 mg/kg compared with 2 mg once daily in AKU. 13 Non-compliance with protein restriction in HT-1 has led to several reported ocular symptoms, including corneal crystals and opacities.28–30 Similar corneal opacities have been reported in AKU.10,31 In all cases, the corneal opacities resolved upon cessation of NTBC and normalization of tyrosine concentrations. In addition, by measuring NTBC, the pharmacodynamics can be monitored. NTBC is metabolized by the cytochrome P450 system and in using low doses for treatment, monitoring of concentrations can aid in understanding metabolism and in titration of therapy if required. Monitoring of urine HGA is a primary outcome measure in determining whether NTBC has adequately suppressed HGA as there is both renal clearance and renal secretion of HGA. Serum HGA falls as expected and this is mirrored in urine excretion concentrations. Monitoring of serum HGA is paramount in clinical management of AKU as circulating concentrations are key in the pathological development of the disorder when alternative pathways metabolize HGA to benzoquinones, ultimately resulting in ochronosis.
In conclusion, an assay has been developed and validated which enables monitoring of the safety and efficacy of NTBC therapy in the treatment of AKU, applicable to both pre- and post-metabolite concentrations. In addition, although NTBC concentrations are significantly higher in HT-1, the assay, with additional validation would lend itself to monitoring this and other metabolic disorders of the tyrosine degradation pathway.
Footnotes
Declaration of conflicting interests
None declared.
Funding
This project has been enabled due to funding support from NHS England, Highly Specialised Services.
Ethical approval
Not required.
Guarantor
AMM.
Contributorship
ATH performed all analyses; ATH and AMM analysed the data and wrote the first draft of the manuscript; ATH, AMM and ASD were involved in experimental design; LRR is principal investigator of National Alkaptonuria Centre, Liverpool UK; all authors advised on technical aspects and reviewed the final manuscript.
Acknowledgements
We thank Jean Devine and Jeannette Usher for all their technical assistance.