
Abstract
Background
US and European guidelines suggest the use of calculated non-caeruloplasmin-bound copper (free copper index) for the diagnosis and management of Wilson’s Disease. However, there is concern that the required analytical measurements of caeruloplasmin and copper may not be sufficiently robust at the concentrations usually found.
Methods
Aliquots of six plasma specimens were sent to laboratories participating in the UK National External Quality Assessment Scheme for copper and caeruloplasmin. The variability of these two reported measurements and the calculated non-caeruloplasmin-bound copper concentrations were compared. The variability of caeruloplasmin reference ranges quoted by laboratories was also investigated.
Results
No laboratories use the required enzymatic methods in the calculation of non-caeruloplasmin-bound copper. The interlaboratory variations in caeruloplasmin concentrations and calculated non-caeruloplasmin-bound copper concentrations were very considerable so making clinical interpretation unreliable. Wide differences in the caeruloplasmin reference ranges used were also found.
Conclusions
Such variations of the calculated non-caeruloplasmin-bound copper concentrations and the predominant use of immunological methods for measuring caeruloplasmin preclude a clinical role for this calculated value in the investigation of Wilson’s disease.
Introduction
In Wilson’s disease, the incorporation of copper into apocaeruloplasmin (copper-absent) to produce holocaeruloplasmin (copper-containing) is impaired, and the plasma concentrations of both are usually very low. However, the proportion of unbound copper is increased. This fraction is usually referred to as free copper or non-caeruloplasmin-bound copper (NCBC)
1
and can be calculated by subtracting the calculated copper concentration in caeruloplasmin from the measured total copper concentration using the following equation
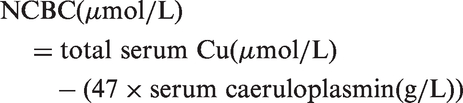
This calculated value was introduced in the 1950s as a useful means of diagnosis and monitoring of Wilson’s disease 2 and its potential clinical value has been widely reported since.3–7 Both European and American Wilson’s Disease guidelines recommend it as a means of monitoring treatment,8,9 although they point out its validity is dependent on quality of analytical measurements.
To investigate the adequacy of analytical quality, replicates of six serum/plasma samples were sent to UK laboratories which participate in National External Quality Assessment Schemes (NEQAS) for caeruloplasmin and copper. Concentrations of copper and caeruloplasmin in five of the six samples were at low concentrations typically found in Wilson’s disease. Information on the caeruloplasmin method used and reference range quoted was also requested.
Materials and methods
A serum sample from a patient with treated Wilson’s disease was sent to 126 laboratories as an addition to a routine distribution of the UK NEQAS for Specific Proteins (237X) in 2004. As well as reporting results for caeruloplasmin concentrations, laboratories were also asked to report copper concentrations.
In 2012, 31 laboratories which were registered with UK NEQAS for both caeruloplasmin and copper were each sent five aliquots of plasma samples. These five plasma specimens were prepared, as follows, using routine samples received for copper analysis at Glasgow Royal Infirmary.
Specimen A: pooled sample from children less than one-year old. This category of patients was chosen because paediatric plasma copper concentrations are usually significantly lower than adults. Specimen B: pooled plasma from patients with treated Wilson’s disease. Specimen C: pooled plasma samples from adults. Samples were filtered using Ultra-4 30kD centrifugal filter device (Amicon), in order to remove proteins of molecular weight greater than 30 kD to produce a low copper concentration (approximately 0.6 µmol/L). Twenty-five microlitres of 400 mg/L copper solution was added to 25 mL of plasma to increase the copper concentration by 6.29 µmol/L. Specimen D: pooled plasma filtered as with specimen C. Twenty-five microlitres of 100 mg/L copper solution was added to 25 mL of sample to increase the copper concentration by 1.57 µmol/L. Specimen E: pooled plasma from adults with normal copper concentrations.
Specimens were centrifuged, and the supernatant removed and sent to UK NEQAS in Birmingham where they were aliquotted and distributed by first-class post to the participating laboratories.
Participants were invited to analyse the copper and caeruloplasmin and return results for both analytes and also the calculated NCBC if this was reported routinely, and the analytical methods used. NCBC values were calculated by UK NEQAS using the values reported for caeruloplasmin and copper. NCBC was also calculated as the percentage of the total copper concentration.
Laboratories participating in UK NEQAS for caeruloplasmin in 2015 were asked to report their reference range and how it was derived.
The local hospital ethics group advised that ethical approval was not required for this study.
Results
Reported copper and caeruloplasmin concentrations and calculated non-caeruloplasmin-bound copper.
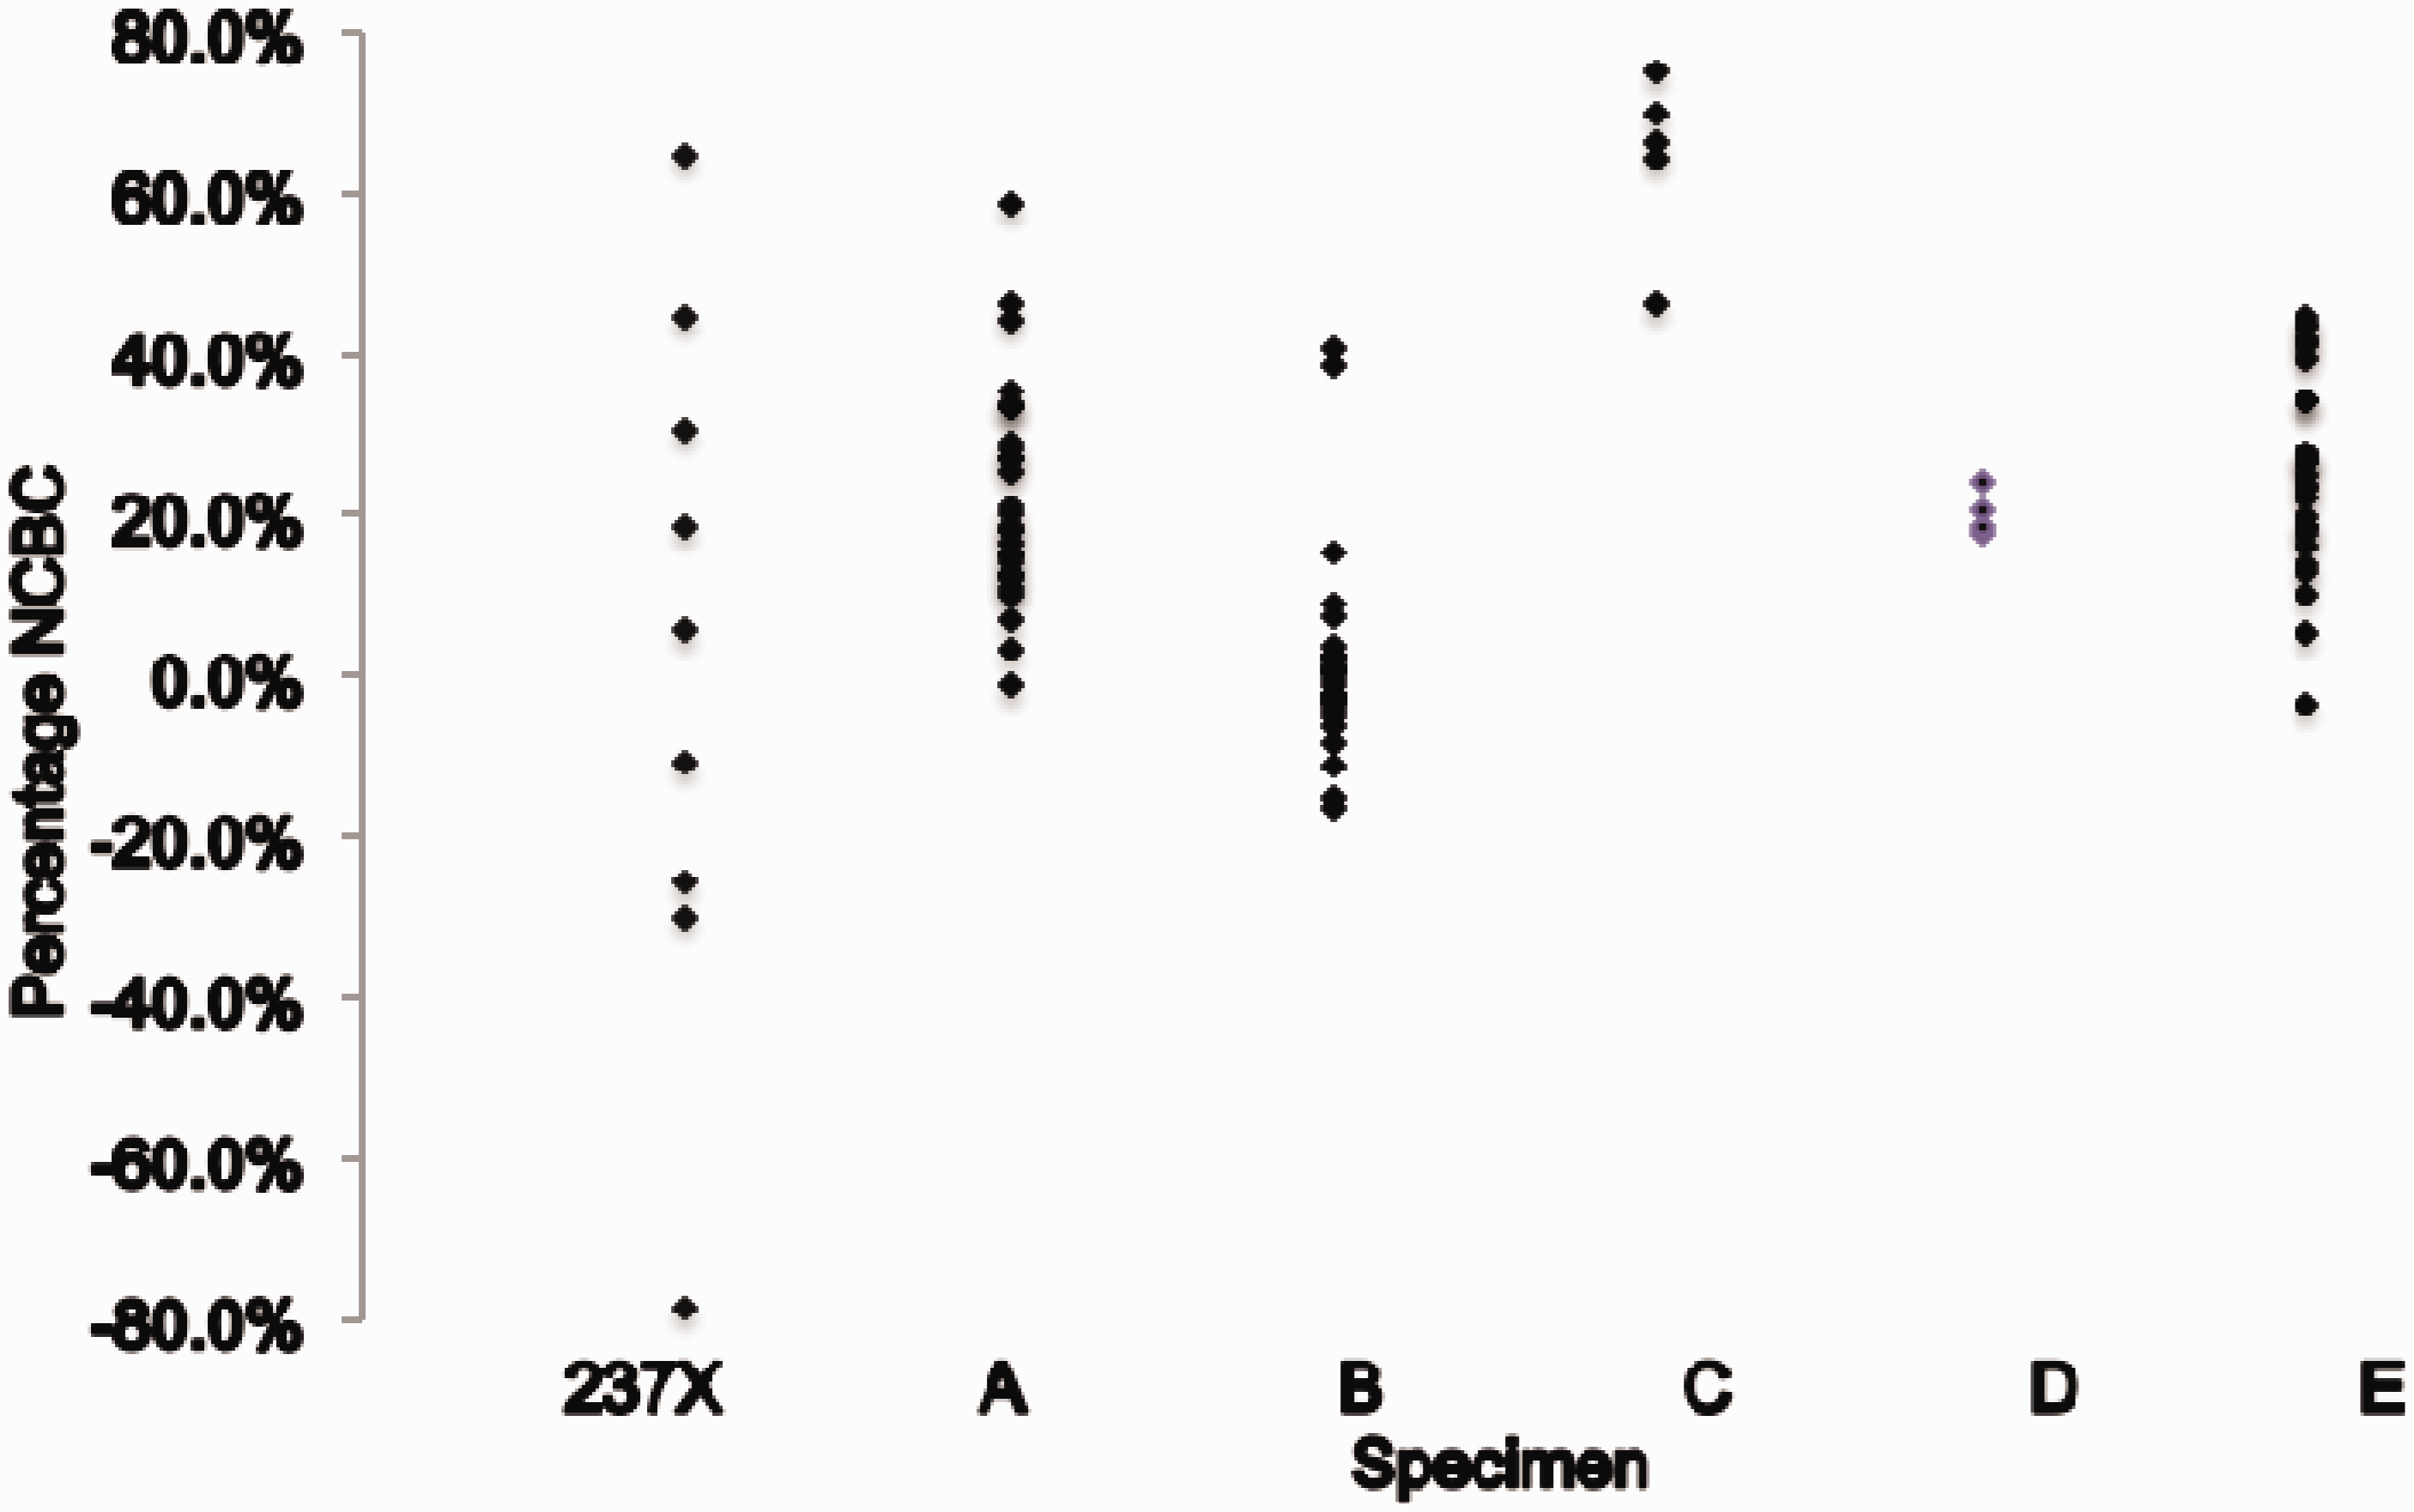
Thirty-four of 126 laboratories also reported copper results. The results for plasma copper and calculated NCBC are also shown in Table 1.
In the subsequent distribution of five samples, results were received from 29 (94%) laboratories, and these are recorded in Table 1. Most laboratories were unable to measure caeruloplasmin concentrations in distributions C and D because they fell below their detection limits. The lower detection limit for caeruloplasmin varied markedly between laboratories from 0.01 to 0.1 g/L with a median of 0.02 g/L. Two laboratories appeared not to have a lower detection limit and quoted values of 0.0 mg/L and 0.001 mg/L.
Five laboratories (16%) reported calculated NCBC results, two of which were grossly incorrect (9 and 11.3 µmol/L instead of 1.09 and 2.1 µmol/L, respectively).
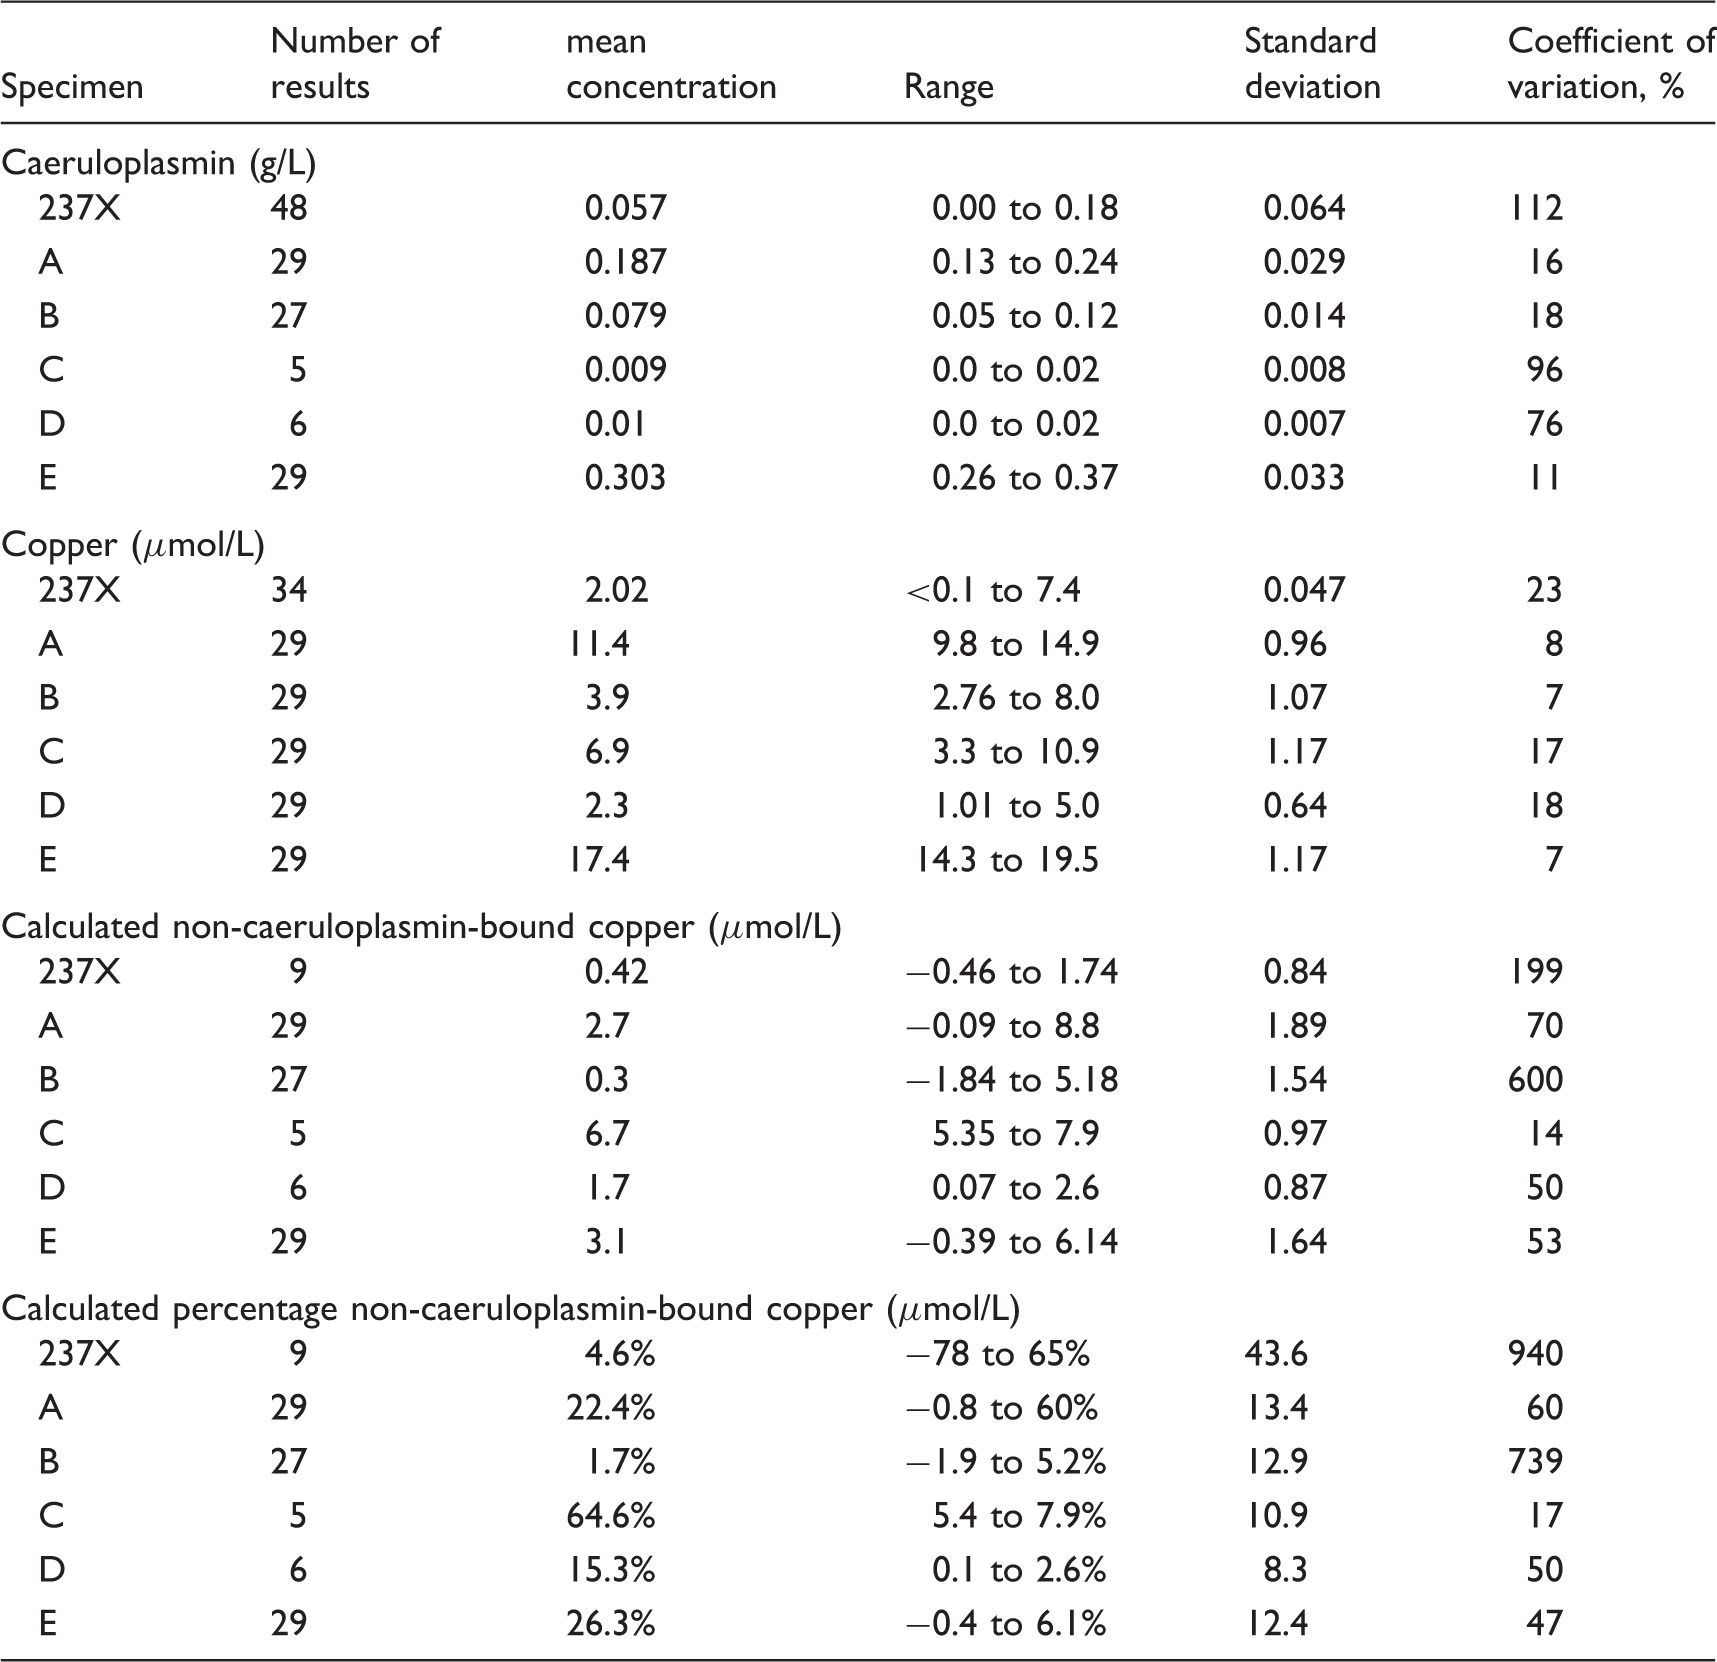
An indication of the clinical variability of NCBC results is shown in Figure 1. The American guidelines quote reference values of >3.9 µmol/L for Wilson’s disease (reference < 2.4 µmol/L);
9
European guidelines quote > 1.6% for Wilson’s disease.
8
Results expressed as percentage NCBC are shown in Figure 2. Normally, percentage NCBC is < 10% of the total copper with values of 30–50% in Wilson’s disease.
5
Calculated NCBC results in six specimens distributed for analysis. NCBC results expressed as percentage of total copper in six specimens distributed for analysis.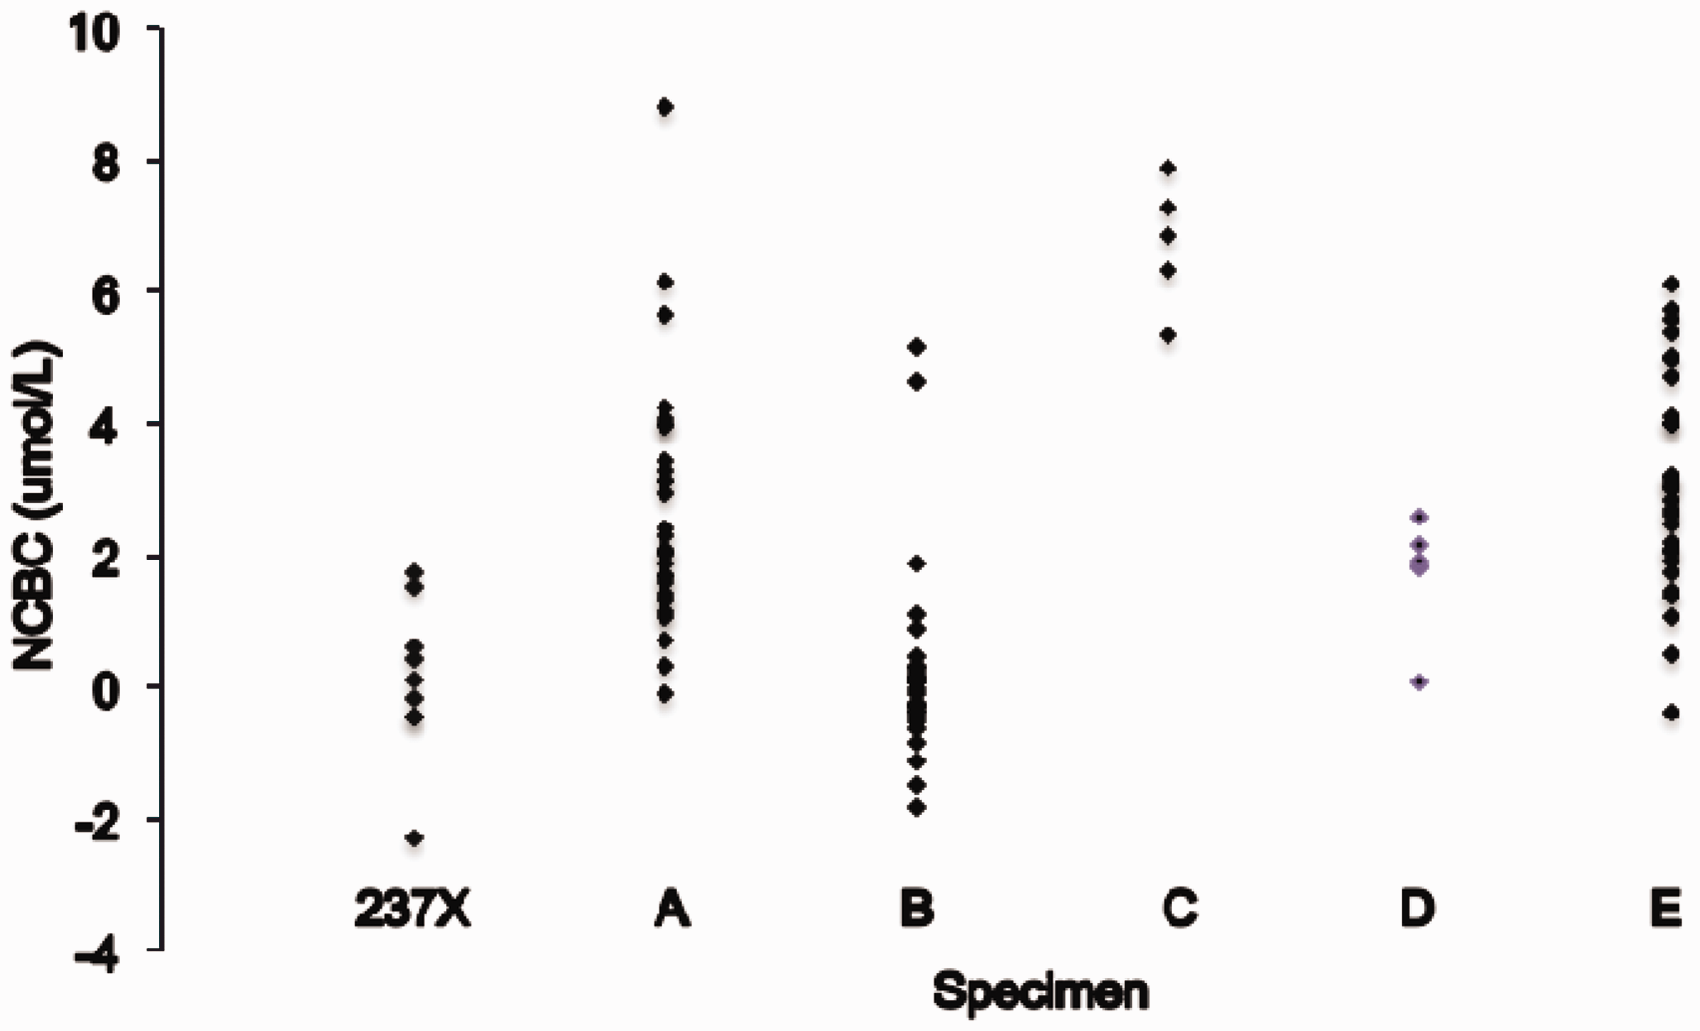
Responses regarding the caeruloplasmin reference ranges were received from 47 laboratories. Twenty laboratories (42%) quoted a reference range of 0.2 to 0.6 g/L. The remaining 27 laboratories quoted 19 different reference ranges with lower cut-offs ranging from 0.15 to 0.24 g/L and upper cut-offs from 0.3 to 2.0 g/L (Figure 3). Of the 36 laboratories where the source of their reference range was known, 21 (58%) quoted from the manufacturer’s kit insert, eight (22%) quoted the UK Protein Reference Units Handbook range, 2 (6%) quoted from a literature reference and five (14%) laboratories derived them locally. Not all eight laboratories citing the Protein Reference Units as their source quoted the same reference range; 0.15 to 0.6 g/L (1); 0.2 to 0.4 g/L (3); 0.2 to 0.6 g/L (4). The same was the case, when kit inserts were the source. Six laboratories also quoted separate female reference ranges.
Caeruloplasmin reference ranges according to method.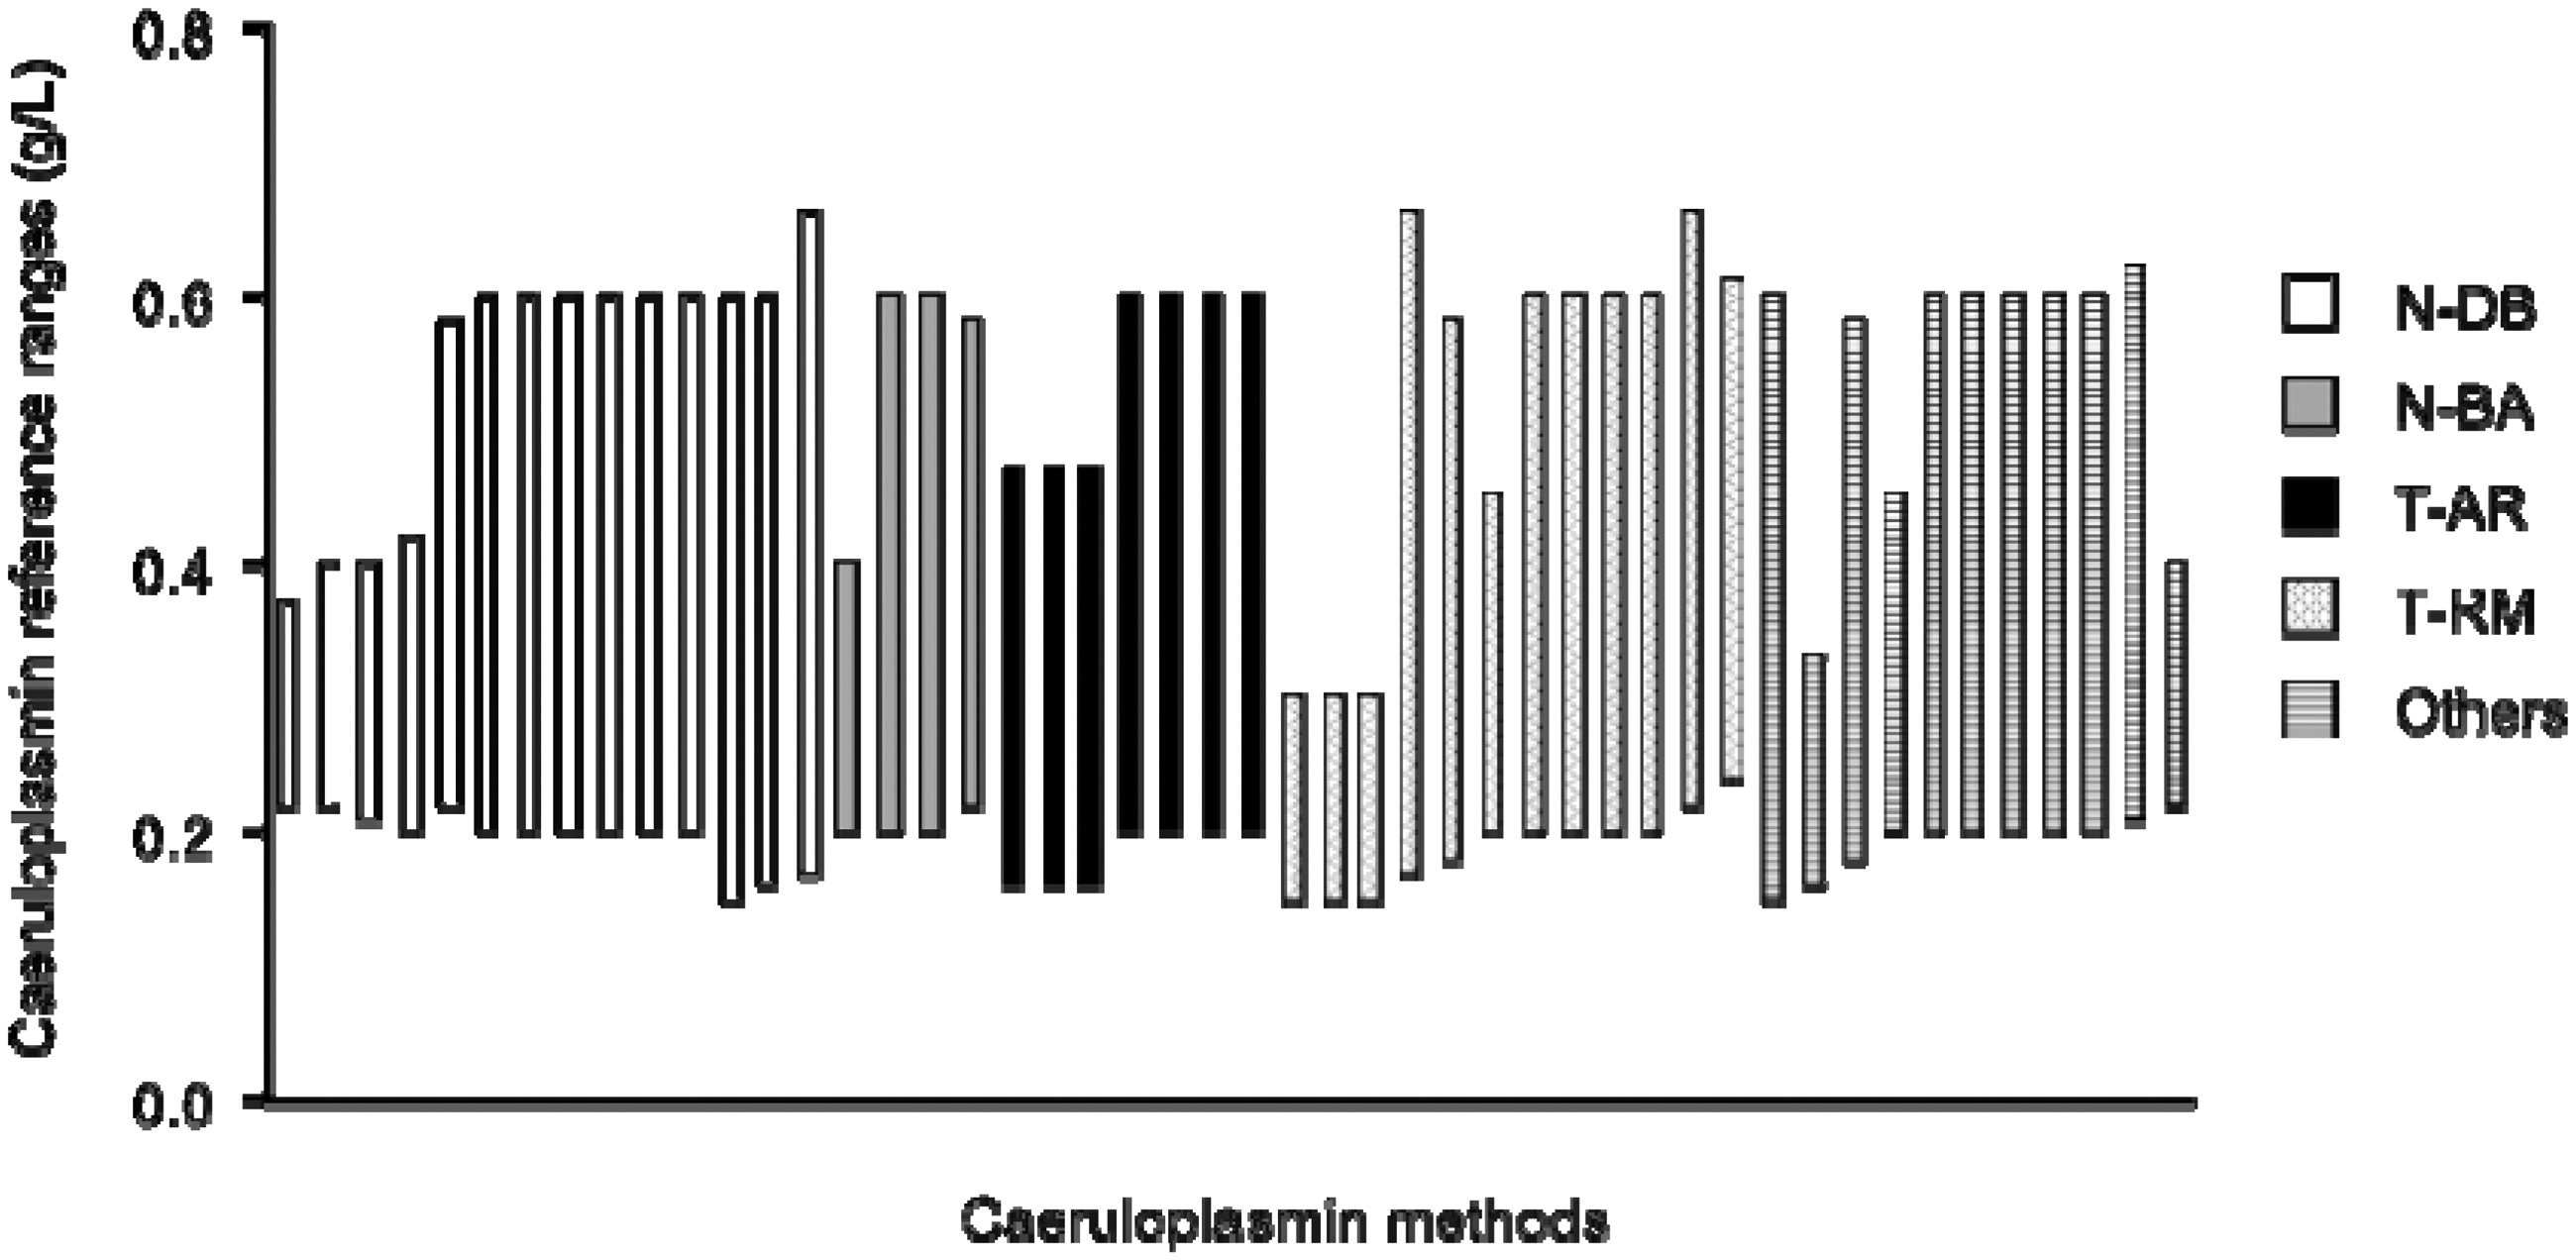
Conclusions
Caeruloplasmin is predominantly measured by immunological methods; 56 of 58 (97%) laboratories in distribution 1 and all 29 laboratories in distribution 2. Such methods measure both apo- and holoforms of caeruloplasmin, whereas enzymatic methods are based on the copper oxidase activity present in holocaeruloplasmin alone. Immunoassay methods tend to overestimate caeruloplasmin6,10 presumably because caeruloplasmin antibodies recognize epitopes presented by apocaeruloplasmin. When calculating NCBC, it is clearly inappropriate to include functionally inactive apocaeruloplasmin. 6 Consequently, the calculation of NCBC in most laboratories in this survey is invalid, since immunological methods are used. This short study also confirms the previously expressed concern8,9 that NCBC calculations may be inappropriate because of poor analytical imprecision. The interlaboratory variations for caeruloplasmin measurement were high for the four samples with low concentrations typical of those found in Wilson’s disease UK. NEQAS returns show significantly lower results for turbidimetric methods compared with nephelometric methods as well as differences between the subgroups of these two methods. 11 The variability of results found in this study confirms and builds on previously reported findings in relation to the immunological determination of caeruloplasmin.12,13 For example, no methods are metrologically traceable back to a known mass of pure caeruloplasmin in a primary standard. Such a variability is perhaps predictable given the recent finding of marked non-commutability of immunological caeruloplasmin methods, 14 probably due in large part to assays detecting differing epitopes.
Another concerning issue is the variability between laboratories of the caeruloplasmin reference ranges used with the lower limit of reference ranges quoted varying by 60% (from 0.15 to 0.24 g/L). The variations in ranges appear to be independent of the method used and its source. With such variations, laboratories should ideally establish reference ranges locally, however, only 14% were found to do so.
A significant minority of laboratories (40%) grossly miscalculated NCBC results. Most laboratories did not routinely report NCBC results, and it is open to question whether clinicians who calculate NCBC themselves do so correctly.
There is a significant disparity between the NCBC reference values quoted in European and American guidelines (<1.6 and < 2.3 µmol/L, respectively). Consequently, results between 1.7 and 2.2 would be considered abnormal by the former but consistent with Wilson’s disease by the latter. Neither set of guidelines references how these figures were derived. In cases of Wilson’s disease where copper concentrations are < 2.3 µmol/L, NCBC values would, as a matter of course, be lower and so would be within the reference range. For this reason, the calculation of NCBC as a percentage of total copper might be considered a preferable way of expressing results.
The combined imprecision of the caeruloplasmin and copper methods results in very large variations in NCBC between laboratories so producing results which span widely across the ranges associated with both Wilson’s disease and healthy subjects. This is also the case when results are expressed as percentage NCBC. In addition, 16 of the 96 (17%) results were negative, an invalid finding which has been observed previously. 15
The poor precision of caeruloplasmin results and the finding that immunological methods are predominantly used, also calls into question the value of this measurement in the investigation of Wilson’s disease. Caeruloplasmin and copper measurements correlate very well in general 16 and so caeruloplasmin provides no additional information to plasma copper whose analytical performance is superior. Consequently, the use of caeruloplasmin may well complicate the investigation of Wilson’s disease patients because of its unreliable analytical performance, the appropriateness of the reference ranges used and the possibility of over-estimating results by use of immunological methods.
It has previously been shown that good results for NCBC calculation can be achieved using a carefully controlled enzymatic assay for caeruloplasmin. 6 However, in the current absence of such a method in the UK, the calculated NCBC should not be considered when investigating Wilson’s disease. In recent years, several different approaches to the direct measurement of NCBC have been evaluated and these may offer a more promising alternative.17–20
Footnotes
Acknowledgements
We would like to acknowledge the participation of Dr Godfrey Gillett and Dr Finlay MacKenzie in the initial UK NEQAS for Specific Proteins survey carried out in 2004.
Declaration of conflicting interests
The author(s) declared no potential conflicts of interest with respect to the research, authorship, and/or publication of this article.
Funding
The author(s) received no financial support for the research, authorship, and/or publication of this article.
Ethical approval
Not applicable.
Guarantor
AD.
Contributorship
AD designed the study and wrote the manuscript; CY carried out literature search and reviewed the manuscript; RB organized the distribution of sample A, recorded results and reviewed the manuscript; AC produced the figures and reviewed the manuscript; DB organized distribution of samples, recorded results and reviewed the manuscript.