
Abstract
Background
Despite advances in clinical chemistry testing, poor blood sample quality continues to impact laboratory operations and the quality of results. While previous studies have identified the preanalytical causes of lower sample quality, few studies have examined the economic impact of poor sample quality on the laboratory. Specifically, the costs associated with workarounds related to fibrin and gel contaminants remain largely unexplored.
Methods
A quantitative survey of clinical chemistry laboratory stakeholders across 10 international regions, including countries in North America, Europe and Oceania, was conducted to examine current blood sample testing practices, sample quality issues and practices to remediate poor sample quality. Survey data were used to estimate costs incurred by laboratories to mitigate sample quality issues.
Results
Responses from 164 participants were included in the analysis, which was focused on three specific issues: fibrin strands, fibrin masses and gel globules. Fibrin strands were the most commonly reported issue, with an overall incidence rate of ∼3%. Further, 65% of respondents indicated that these issues contribute to analyzer probe clogging, and the majority of laboratories had visual inspection and manual remediation practices in place to address fibrin- and gel-related quality problems (55% and 70%, respectively). Probe maintenance/replacement, visual inspection and manual remediation were estimated to carry significant costs for the laboratories surveyed. Annual cost associated with lower sample quality and remediation related to fibrin and/or gel globules for an average US laboratory was estimated to be $100,247.
Conclusions
Measures to improve blood sample quality present an important step towards improved laboratory operations.
Introduction
Clinical laboratory results are a critical component of the patient management process, affecting treatment decisions in as many as 70% of medical cases.1–3 Delayed or incorrect laboratory results caused by poor sample quality or other preanalytical factors have the potential to lead to delayed or erroneous diagnoses or treatments, which can impact patient outcomes,4–6 compromise patient safety3,7 and lead to unintended economic burdens on the laboratory and hospital.1,8 Illustrating the clinical importance of accuracy in testing, a review of laboratory incident reports by Astion et al. 5 demonstrated that 95% of the laboratory errors analysed had the potential to cause adverse events (AEs) and 5% resulted in actual AEs. Furthermore, a 2013 study estimated an average added cost of $208 USD per preanalytical error (defined as a defect that occurred during the preanalytical phase and negatively impacted the quality of the laboratory result). 8 These errors were estimated to make up 0.23–1.2% of hospital operating costs, which for a 650-bed hospital translated to ∼$1.2 million USD per year. 8 Still, the total costs associated with preanalytical errors are likely to vary between hospitals.
Although clinical chemistry laboratories have made quality control improvements, poor sample quality is still a concern.6,9,10 Studies have demonstrated that erroneous or delayed laboratory results can result from sample quality issues that originate during sample collection and/or processing.1,8 Many preanalytical steps, including collection and processing, occur outside of the laboratory, and as a result these steps may be affected by variables that are difficult for the laboratory to control.1,11,12 These external variables affecting the testing process may result in poor sample quality, 12 which can be difficult to resolve once samples have reached the laboratory.5,8 Preanalytical factors can therefore play an important role in determining the accuracy and timing of clinical laboratory results, which can influence diagnostic or therapeutic decisions.
Laboratories have made considerable efforts to address sample quality issues during the analytical phase by way of automation, standardization and advances in instrument technology,1,13,14 with less attention given to improving sample quality during preanalytical steps. The preanalytical phase of testing, however, is an important consideration in this respect. For example, one of the key components of blood collection, the collection tube, can impact sample quality and therefore test results, 11 as some collection tube materials, such as surfactants, anticoagulants or separator gel particles may interfere with certain clinical assays.15–17 The type of sample collected (plasma versus serum) may also affect the likelihood of encountering specific sample quality issues. For example, serum samples may be prone to fibrin strand formation as a result of insufficient clotting time or inappropriate centrifugation parameters, 18 whereas plasma samples are more likely to have higher residual cell counts. 19
Previous studies have identified haemolysis, short draw and clots in anticoagulated samples as common blood sample quality issues,1,11 indicating that these factors may lead to erroneous test results if left unremediated. 8 However, neither the incidences nor downstream effects of other relevant issues such as fibrin strands, fibrin masses and gel globules (separator gel particles) have been sufficiently examined, though these have been identified as potential sources of lower sample quality and delayed or incorrect test results.12,18,20–22 For example, fibrin strands or masses (fibrin particles unincorporated into the clot) and gel globules can interfere with sensitive immunoassay binding 15,18,22 and may also clog analyzer probes, depending on the size of the particles.15,22 In order to provide a more in-depth understanding of the incidence of these important blood sample quality issues, as well as the methods used to remediate them, we conducted a quantitative survey of clinical chemistry laboratory stakeholders across 10 international regions (including countries in North America, Europe and Oceania). In order to assess the impact that these often over-looked problems can have on the laboratory, survey data were used to estimate associated costs. It was hypothesized that fibrin strands, fibrin masses and gel globules have relevant impacts on laboratory costs.
Methods
Survey respondents
A 63-question web-based survey was deployed using Qualtrics (Provo, UT) survey software and was open 1 June to 15 July 2013. Requests to participate were made via telephone and e-mail in the United States (US), Canada, United Kingdom (UK), Germany, France, Italy, ‘Benelux’ (Belgium, Netherlands, Luxembourg), ‘Nordic’ (Finland and Sweden), Turkey and Australia, with a target of >10 respondents per region. Invitations to participate were not based on any defined criteria and were sent to a de-identified panel of laboratory professionals. Participation was voluntary and confidential, and respondents were informed that data would be de-identified and analysed in aggregate. Survey data were self-reported by qualified respondents, and no independent observations or verifications were made; however, responses were reviewed for internal consistency (see Data Analysis below). In order to reliably assess current laboratory practices, the survey was open to individuals who self-identified as the director, manager or other healthcare professional directly involved in the operations of a hospital-based or commercial clinical chemistry laboratory with a monthly blood sample number ≥1000 tubes. Respondents were not selected based on any current equipment or consumables manufacturer criteria. Overall, 181 respondents across the target regions qualified and completed the survey.
Survey themes
The first part of the survey examined general laboratory characteristics including source(s) of blood samples (e.g. emergency department, intensive care units, outpatient departments and outreach), routine versus STAT (urgent) testing and level of front-end automation. The second part of the survey covered blood sample quality issues encountered in the laboratory, frequency of analyzer probe maintenance and perceived contribution of poor sample quality, visual inspection and manual remediation, reasons for remediation and finally, practices related to the mitigation of erroneous results for high-sensitivity assays. In this survey, ‘high-sensitivity assays’ referred to sensitive assays performed on plasma samples and identified as potentially being more susceptible to erroneous results due to fibrin clots or cellular contamination (human chorionic gonadotropin, creatine kinase MB isoenzyme, digoxin, triiodothyronine, thyroxine, troponin, phenytoin, thyroid-stimulating hormone). High-sensitivity troponin assays, for example, have recently been reported to be associated with the potential for false-positive results.
23
The key aspects of laboratory workflow covered in the survey, including sample transportation, preparation and remediation, are presented in Figure 1.
Blood sample collection and testing workflow, including preanalytical and analytical steps.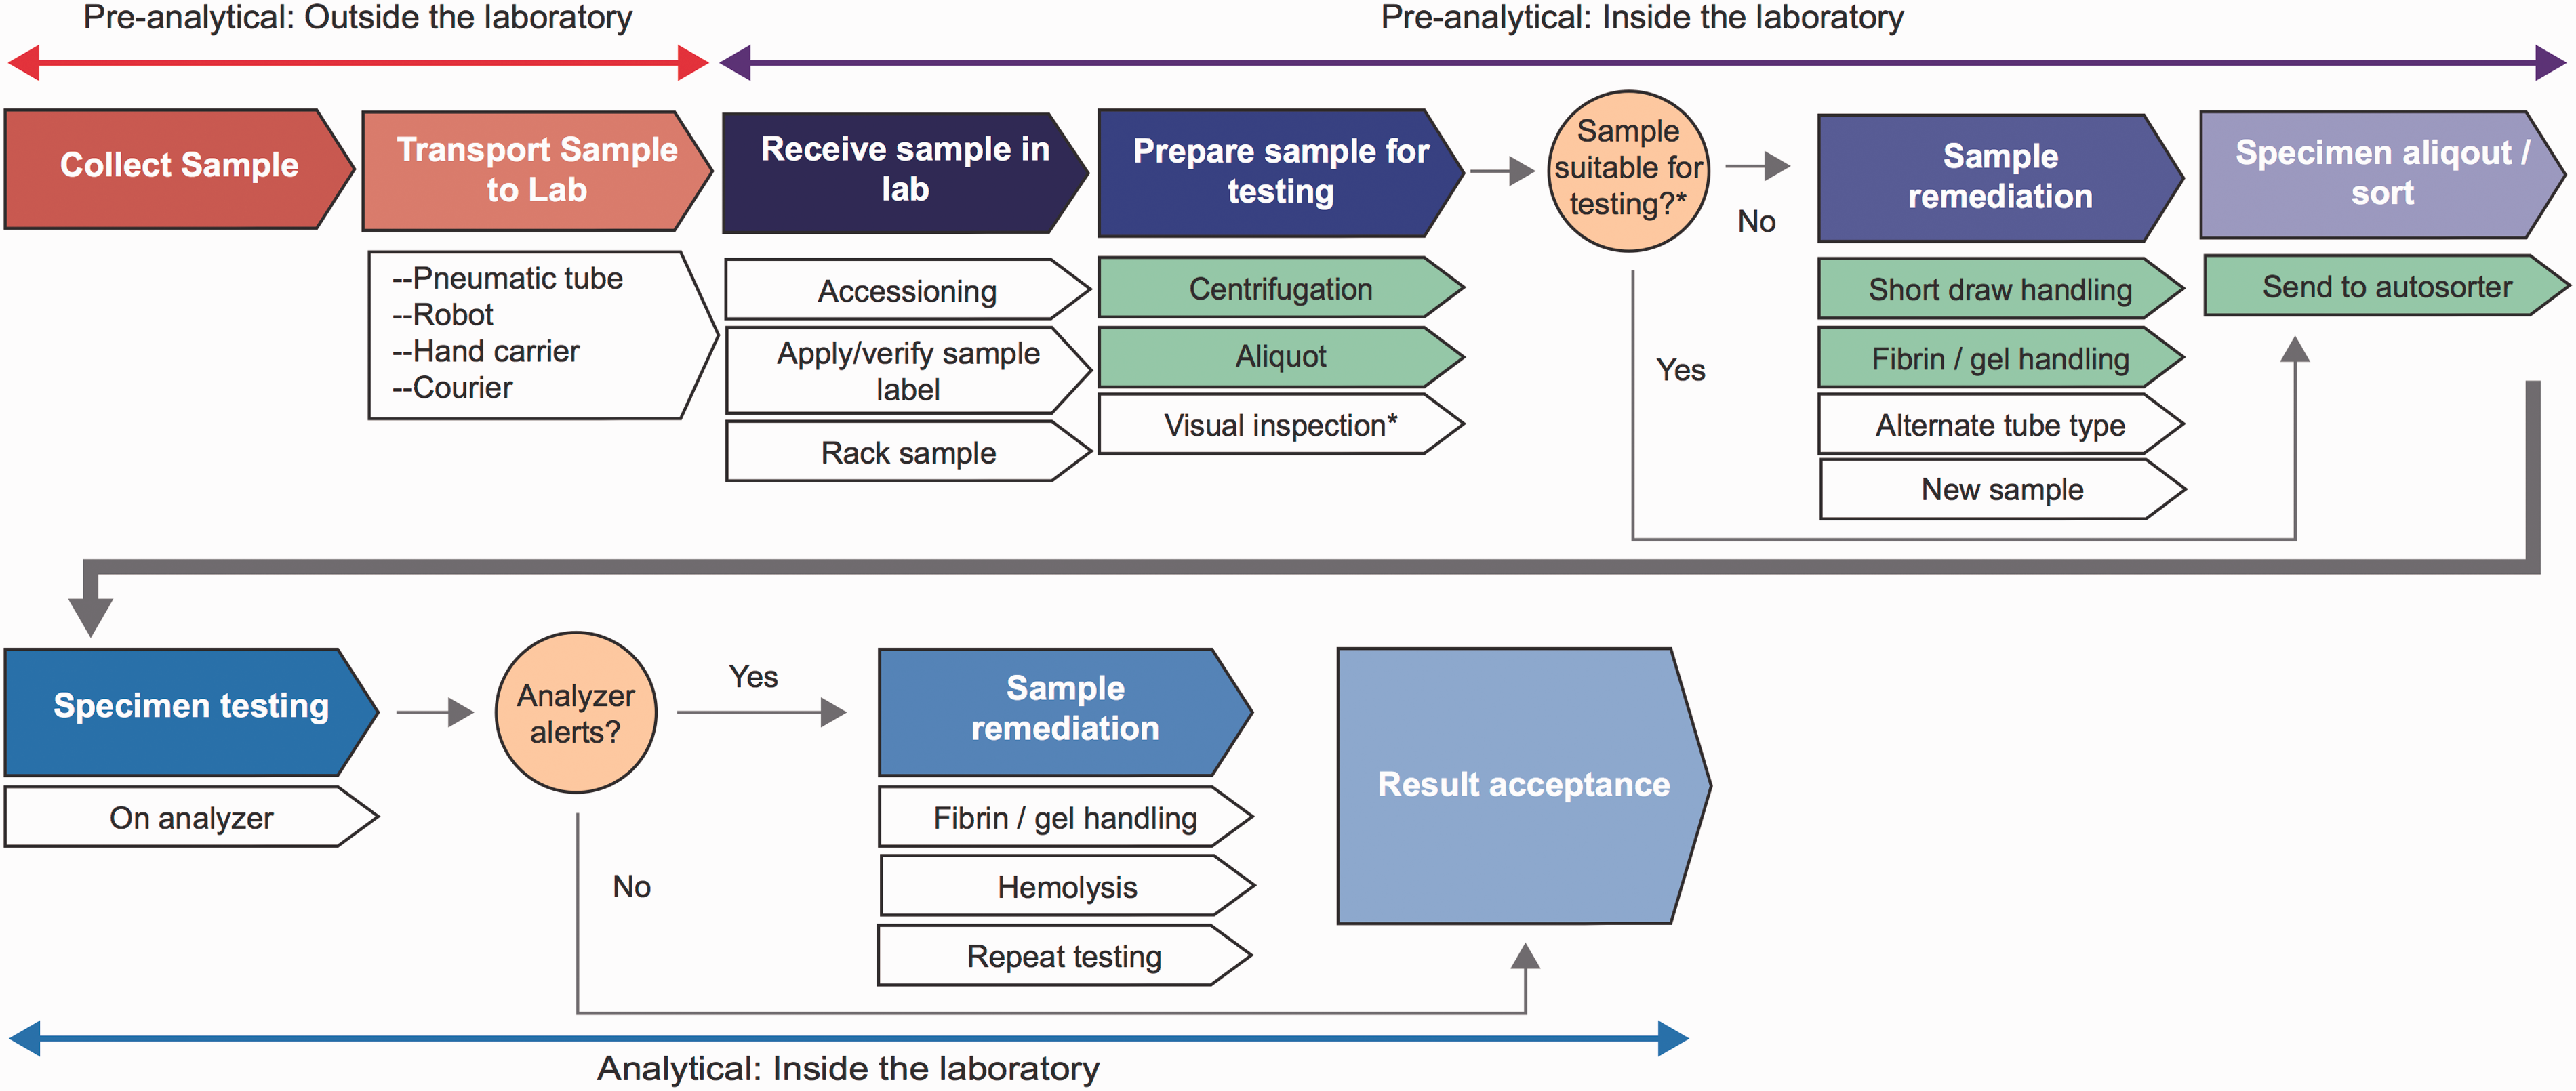
Data analysis
Because the survey data were self-reported and could not be verified, outliers likely to have occurred due to user error, keystroke error or miscomprehension were identified and excluded from the analysis. Overall, data from 17 respondents were excluded based on the presence of outliers for responses related to probe maintenance and replacement or frequency of sample quality issues, or internal validity concerns (e.g. number of high-sensitivity assay tubes exceeding total number of tubes). Only completed surveys were included in the analysis, and the results are therefore not likely to be confounded by missing data.
Annual numbers of blood samples were derived from monthly sample numbers provided by respondents. Cost estimates were based on the following respondent-reported values: the number of blood collection tubes, incidence of erroneous results and problems with sample quality, remediation practices and frequency of probe maintenance and replacement. For example, when considering the costs of visual inspection, the following calculations were applied: (1) number of sample tubes currently inspected = (% tubes inspected) × (# of tubes), (2) total time for manual inspection = (# of tubes inspected) × (time to inspect each tube) and (3) total cost of manual inspection = (total time for manual inspection) × (lab technician or receiving staff salary). Detailed assumptions related to the cost of supplies, employee wages and time requirements for each workflow process step, as well as economic calculations are provided in the Supplementary Material. All costs calculations were based on US labour and consumable costs, and data are presented in US dollars ($) and standardized as cost per 10,000 sample tubes received.
Results
Demographics and laboratory characteristics
Respondent laboratory characteristics.
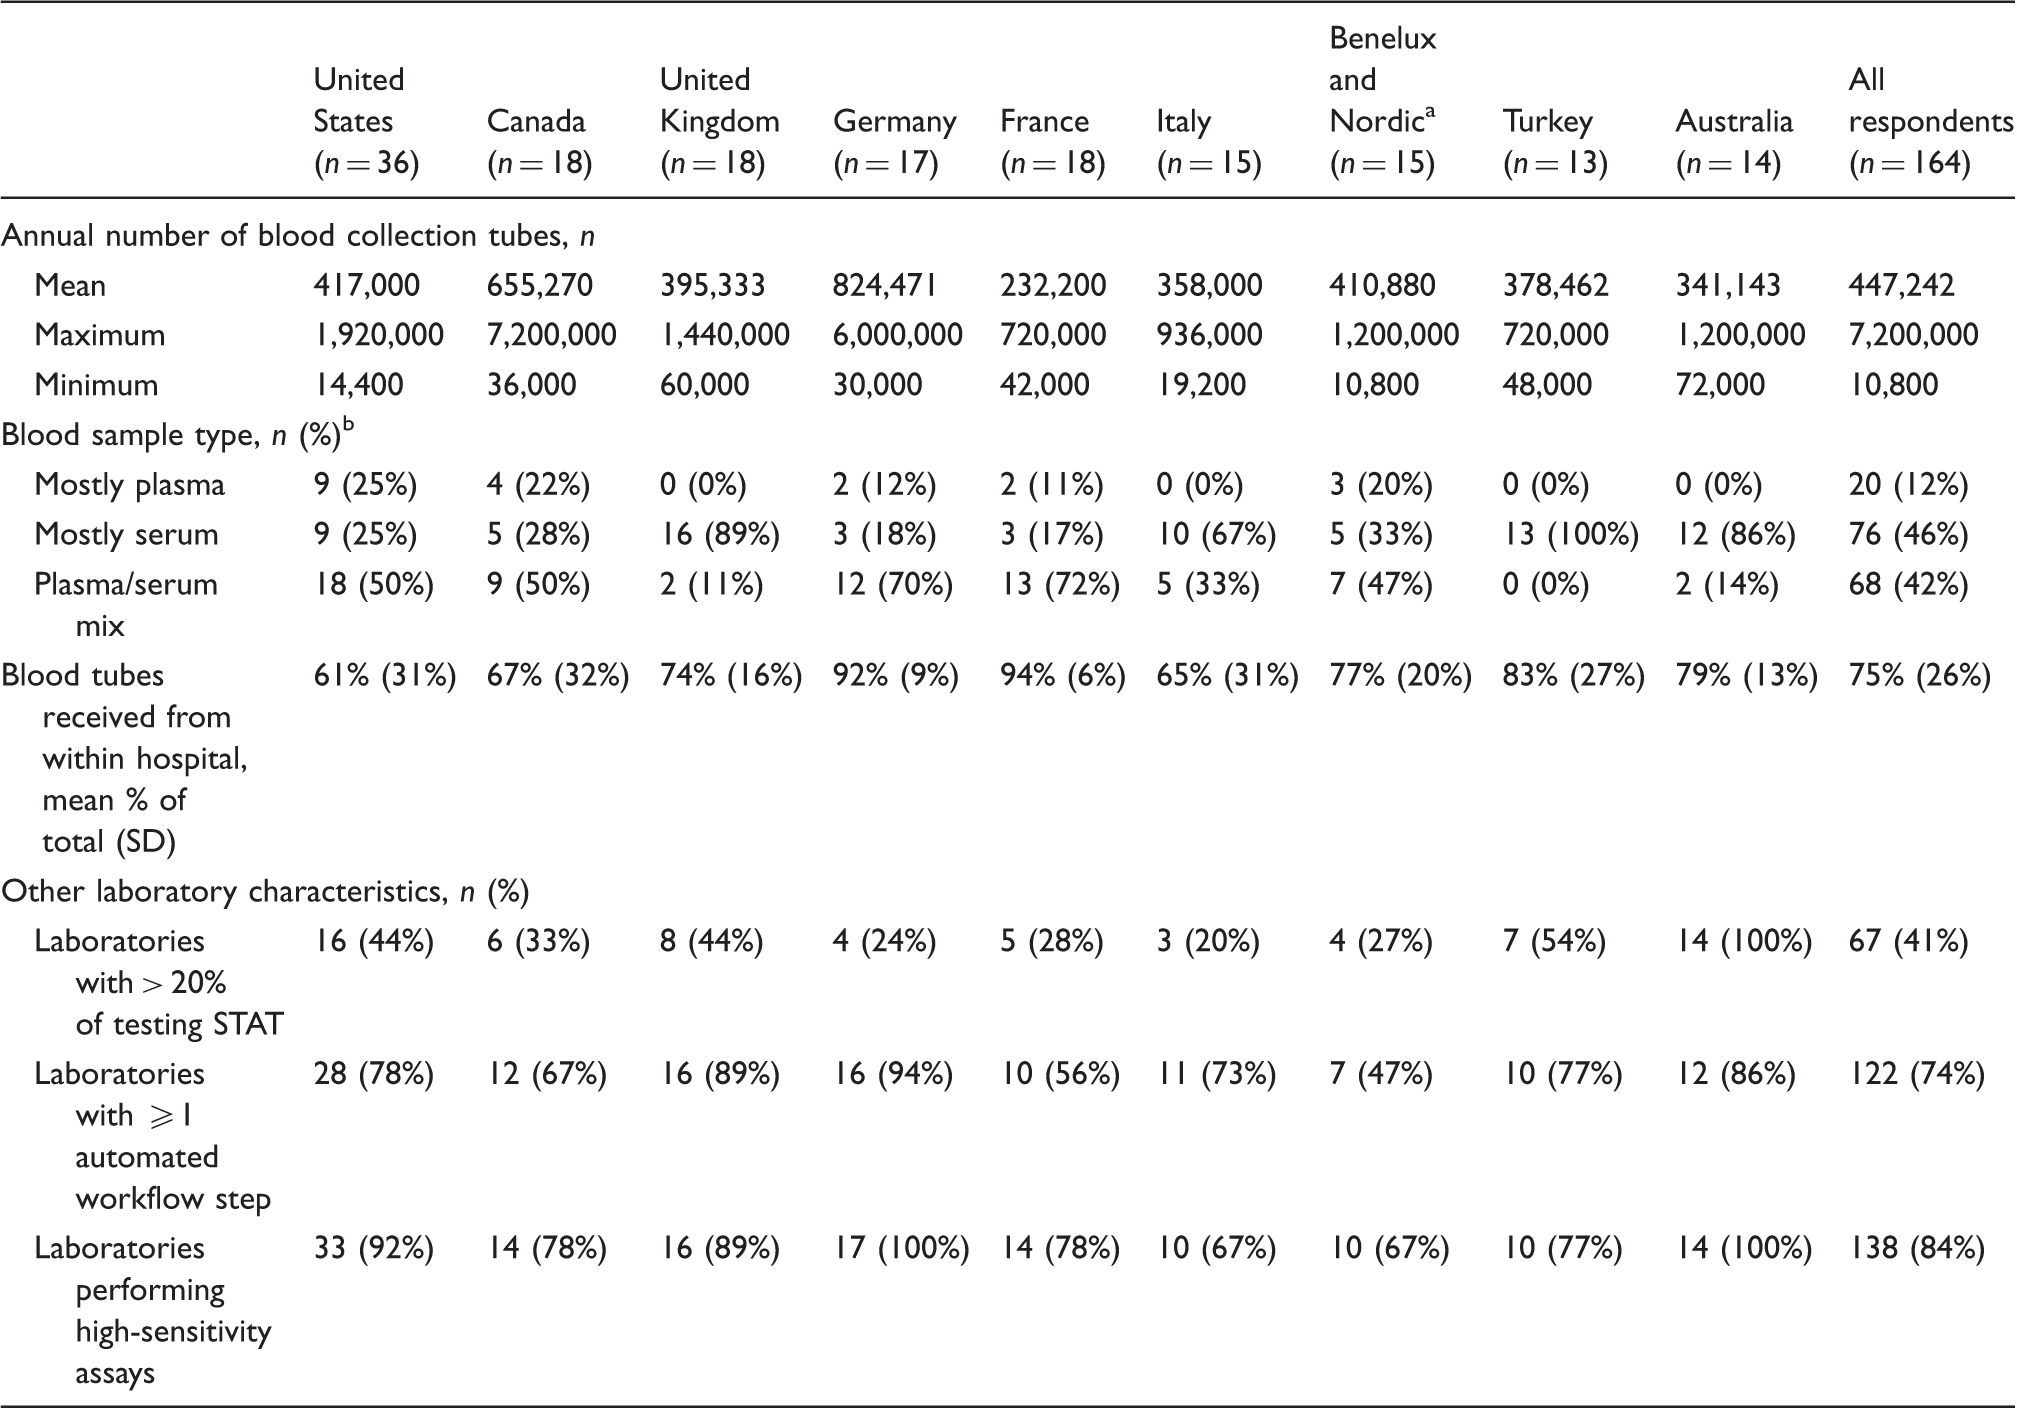
Note: All percentages rounded to the nearest unit and represent percent of all respondents unless otherwise noted.
SD: standard deviation.
Benelux includes Belgium, Netherlands, and Luxembourg; Nordic includes Finland and Sweden
Characterized as ‘mostly plasma’ or ‘mostly serum’ if ≥& 80% of tubes received were plasma or serum, respectively, and as ‘plasma/serum mix’ if neither type accounted for ≥80% of sample tubes received
hCG: Human chorionic gonadotropin; CK-MB: creatine kinase MB isoenzyme; digoxin; T3: triiodothyronine; T4: thyroxine; troponin, phenytoin; TSH: thyroid-stimulating hormone.
Blood sample quality issues
Prevalence of blood sample quality issues in respondent laboratories.
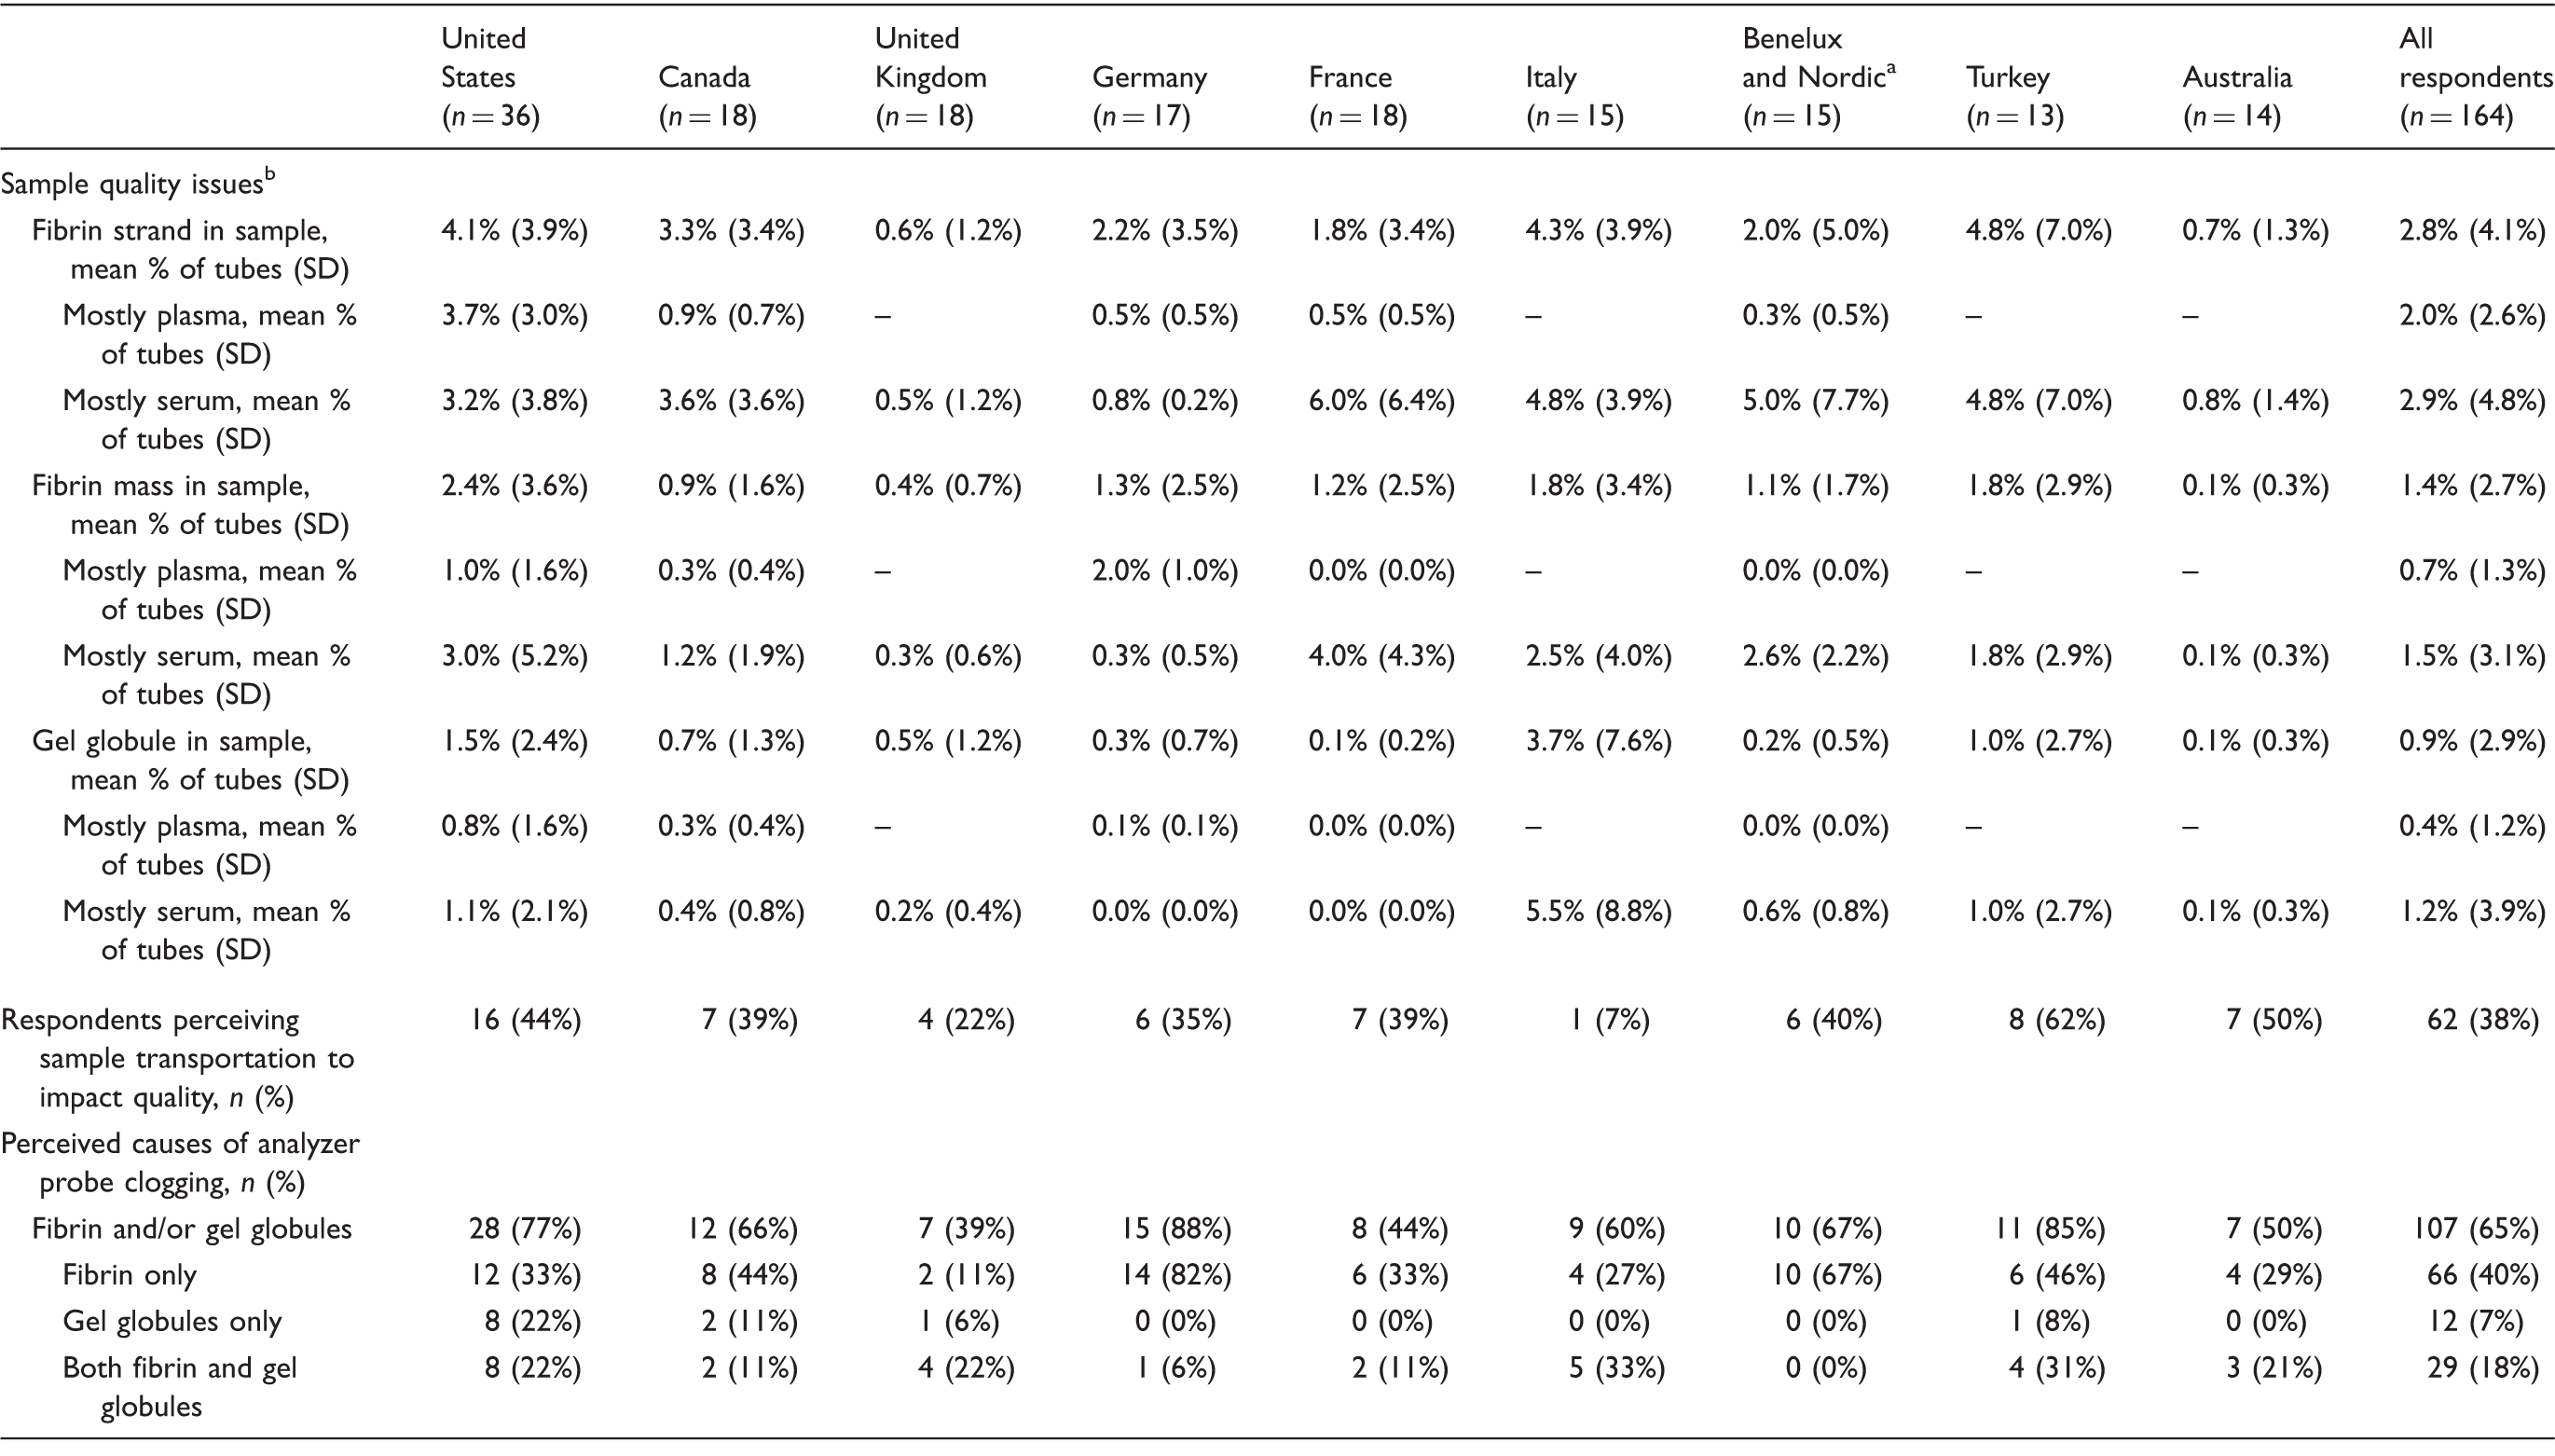
Note: All percentages rounded to the nearest unit and represent percent of all respondents unless otherwise noted.
SD = standard deviation.
Benelux includes Belgium, Netherlands, and Luxembourg; Nordic includes Finland and Sweden.
Characterized as ‘mostly plasma’ or ‘mostly serum’ if ≥80% of tubes received were plasma or serum, respectively, and as ‘plasma/serum mix’ if neither type accounted for ≥80% of sample tubes received.
Visual inspection and manual remediation
Blood sample remediation, erroneous result mitigation, and analyzer probe maintenance in respondent laboratories.
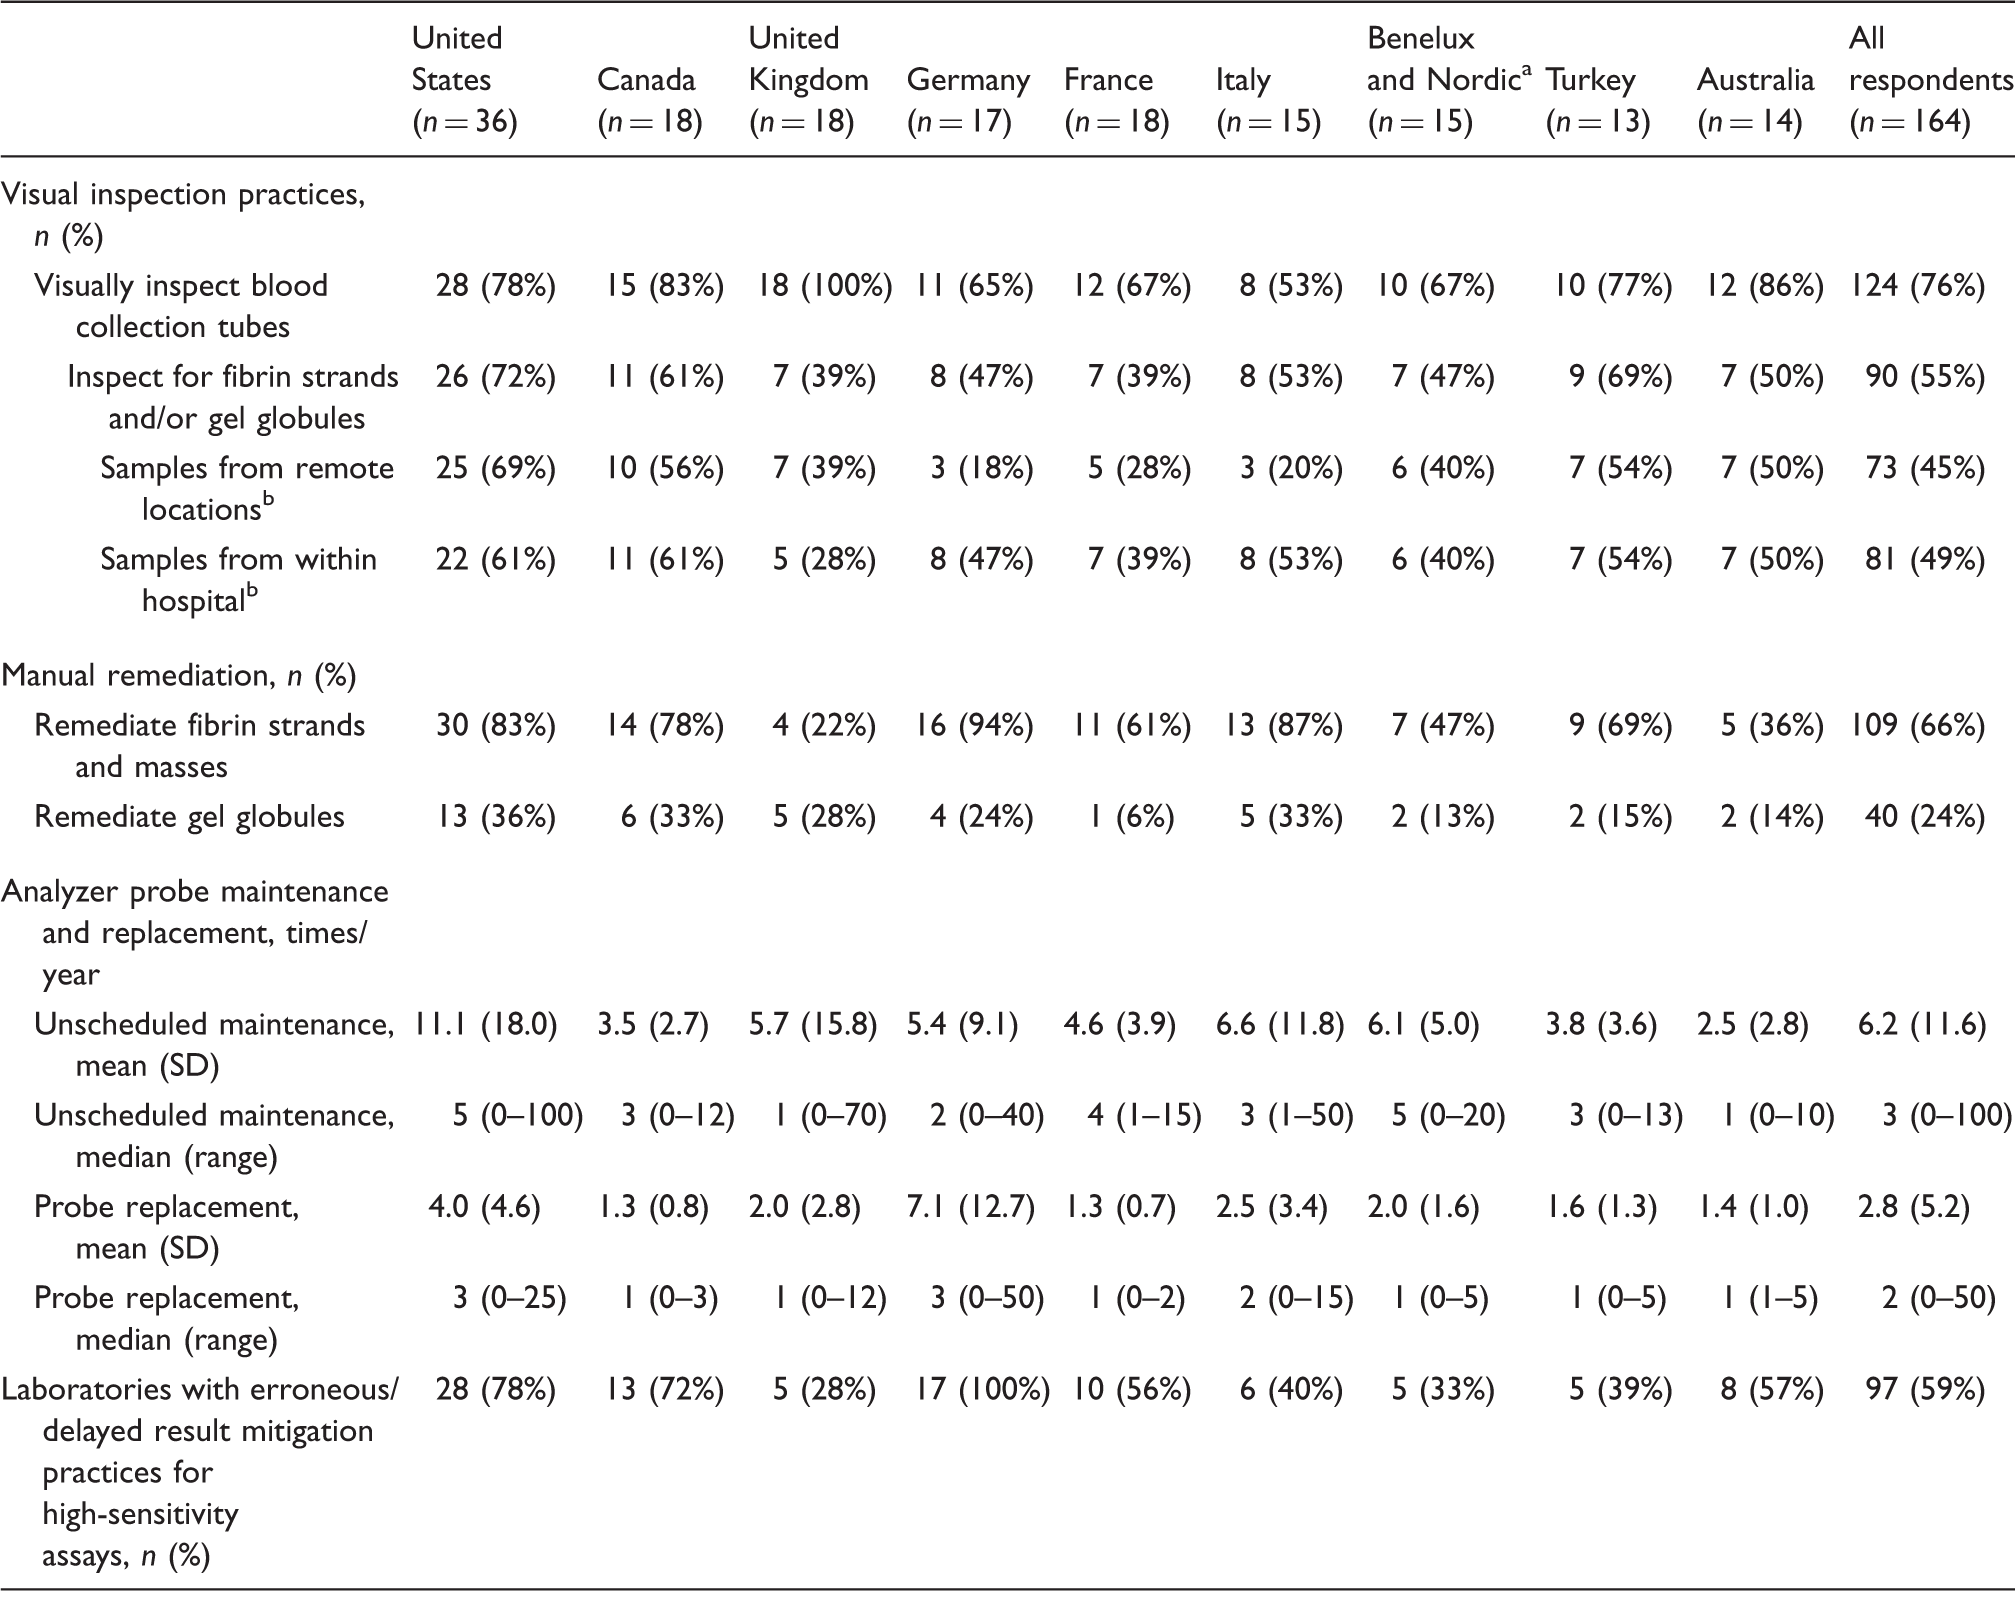
Note: All percentages rounded to the nearest unit and represent percent of all respondents unless otherwise noted.
Benelux includes Belgium, Netherlands, and Luxembourg; Nordic includes Finland and Sweden
Inspecting from remote locations vs. within hospital are non-mutually exclusive practices
Analyser probe maintenance and replacement
The mean frequency of unscheduled analyser probe maintenance varied from 11.1 ± 18.0 times per year (US) to 2.5 ± 2.8 times per year (Australia) (Table 3). Responses suggest a possible relationship between unscheduled probe maintenance frequency and the incidence sample quality issues. Respondents in the US and Italy, who reported high frequencies of fibrin- and gel-related sample quality issues, also reported relatively high rates of unscheduled probe maintenance. Laboratories processing mostly plasma samples reported more unscheduled analyser probe maintenance and replacement than mostly serum laboratories (Supplementary Table 4).
High-sensitivity assays
High-sensitivity assays may be more susceptible to erroneous results arising from issues related to sample quality (microclots, cellular contamination). Overall, 84% of respondents (n = 138) reported performing high-sensitivity assays (Table 1), but only 59% (n = 97) reported having preventive practices in place for mitigating potentially erroneous results (Table 3). Reported incidences of erroneous results with high-sensitivity assays were ≤1% for most respondents (Supplementary Figure 1). The most frequently cited remediation practice for high-sensitivity assays was testing a sample, and then re-testing a second sample from the tube if the first result was out of range (Supplementary Table 5). Depending on the assay, 85–88% of respondents whose laboratory performed the assay indicated that this was the remediation practice used (Supplementary Figure 2). Overall, 55% (n = 90) of respondents reported the need to re-test individual plasma tubes when performing high-sensitivity assays. In the case of high-sensitivity assays requiring re-testing, the most common practice was to ‘re-centrifuge the primary tube and then run through the analyser’ (n = 54, 33% of all respondents) (Supplementary Figure 2).
Financial impact of poor sample quality
Annual time costs of blood sample remediation and erroneous result mitigation.
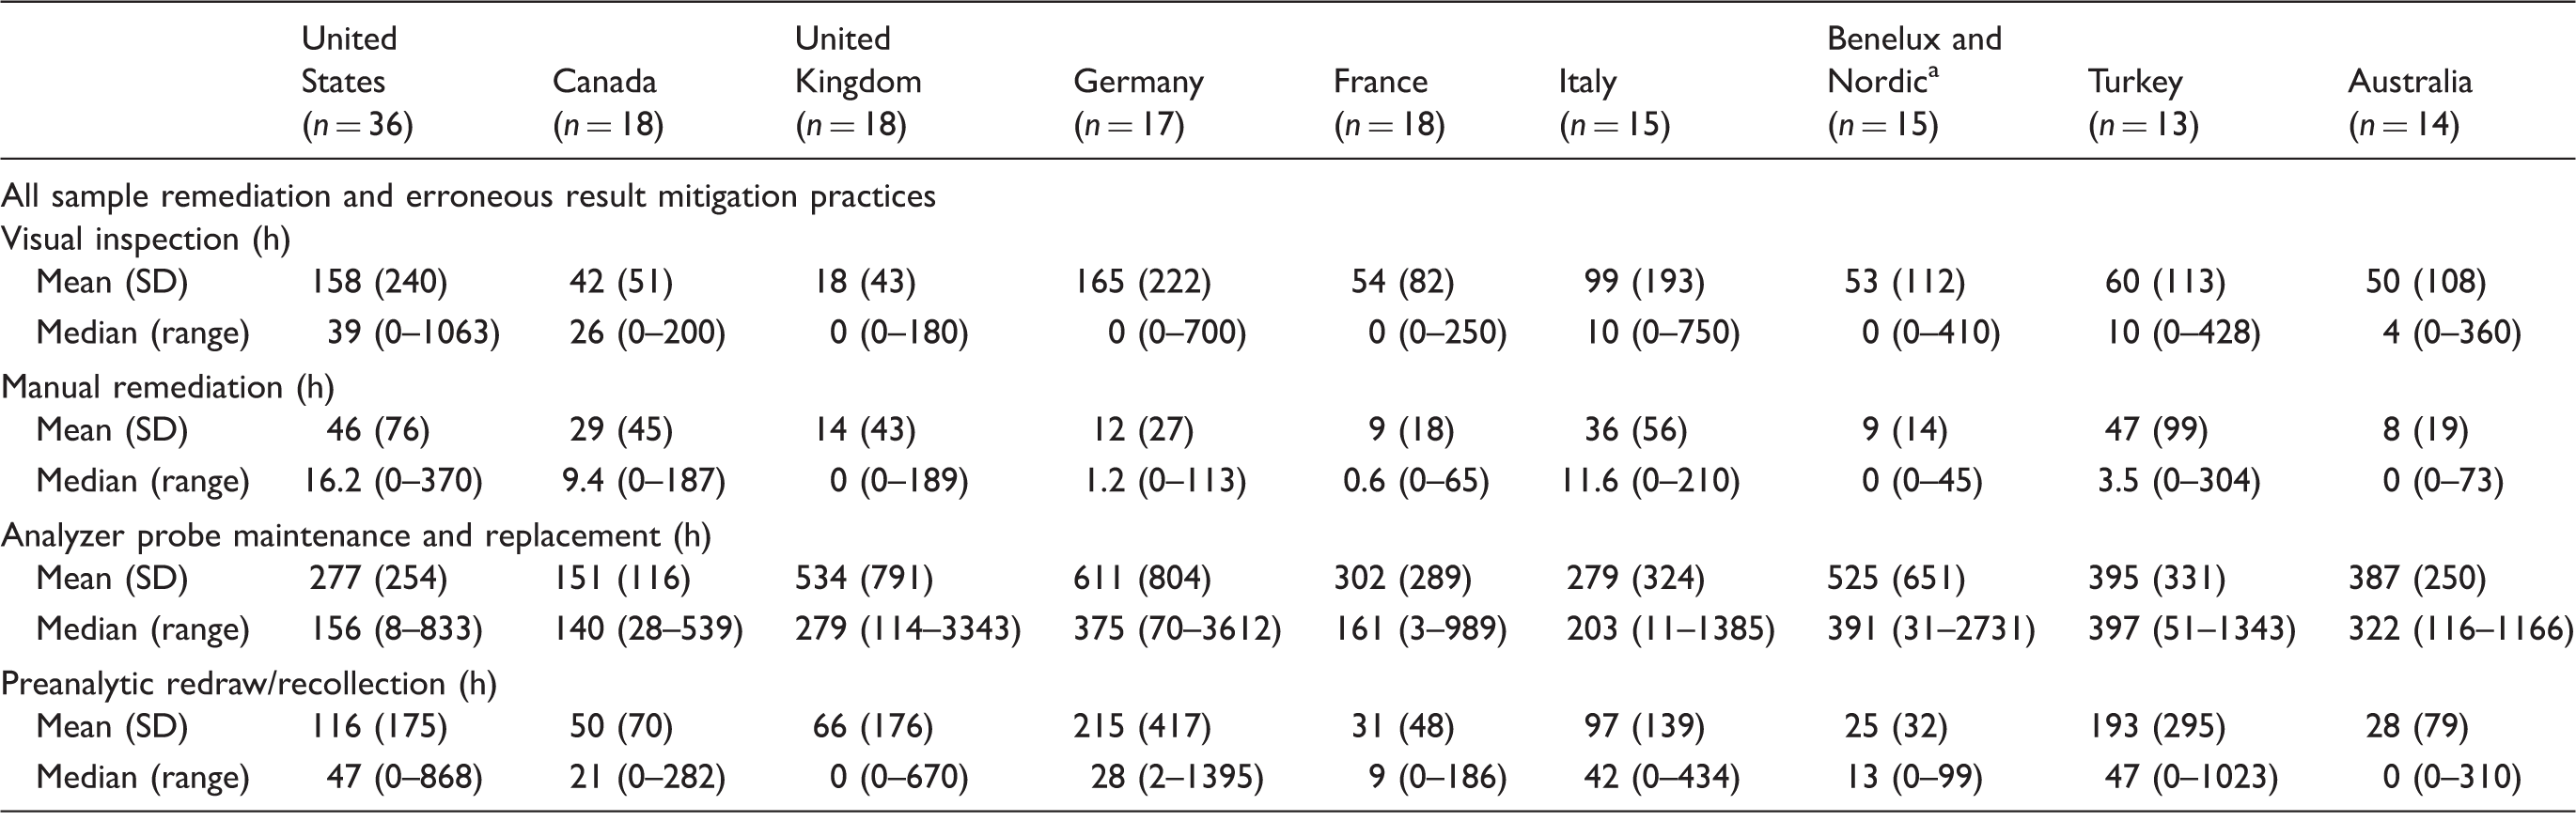
Benelux includes Belgium, Netherlands, and Luxembourg; Nordic includes Finland and Sweden.
SD = standard deviation
Annual costs of blood sample remediation and erroneous result mitigation, per 10,000 tubes.
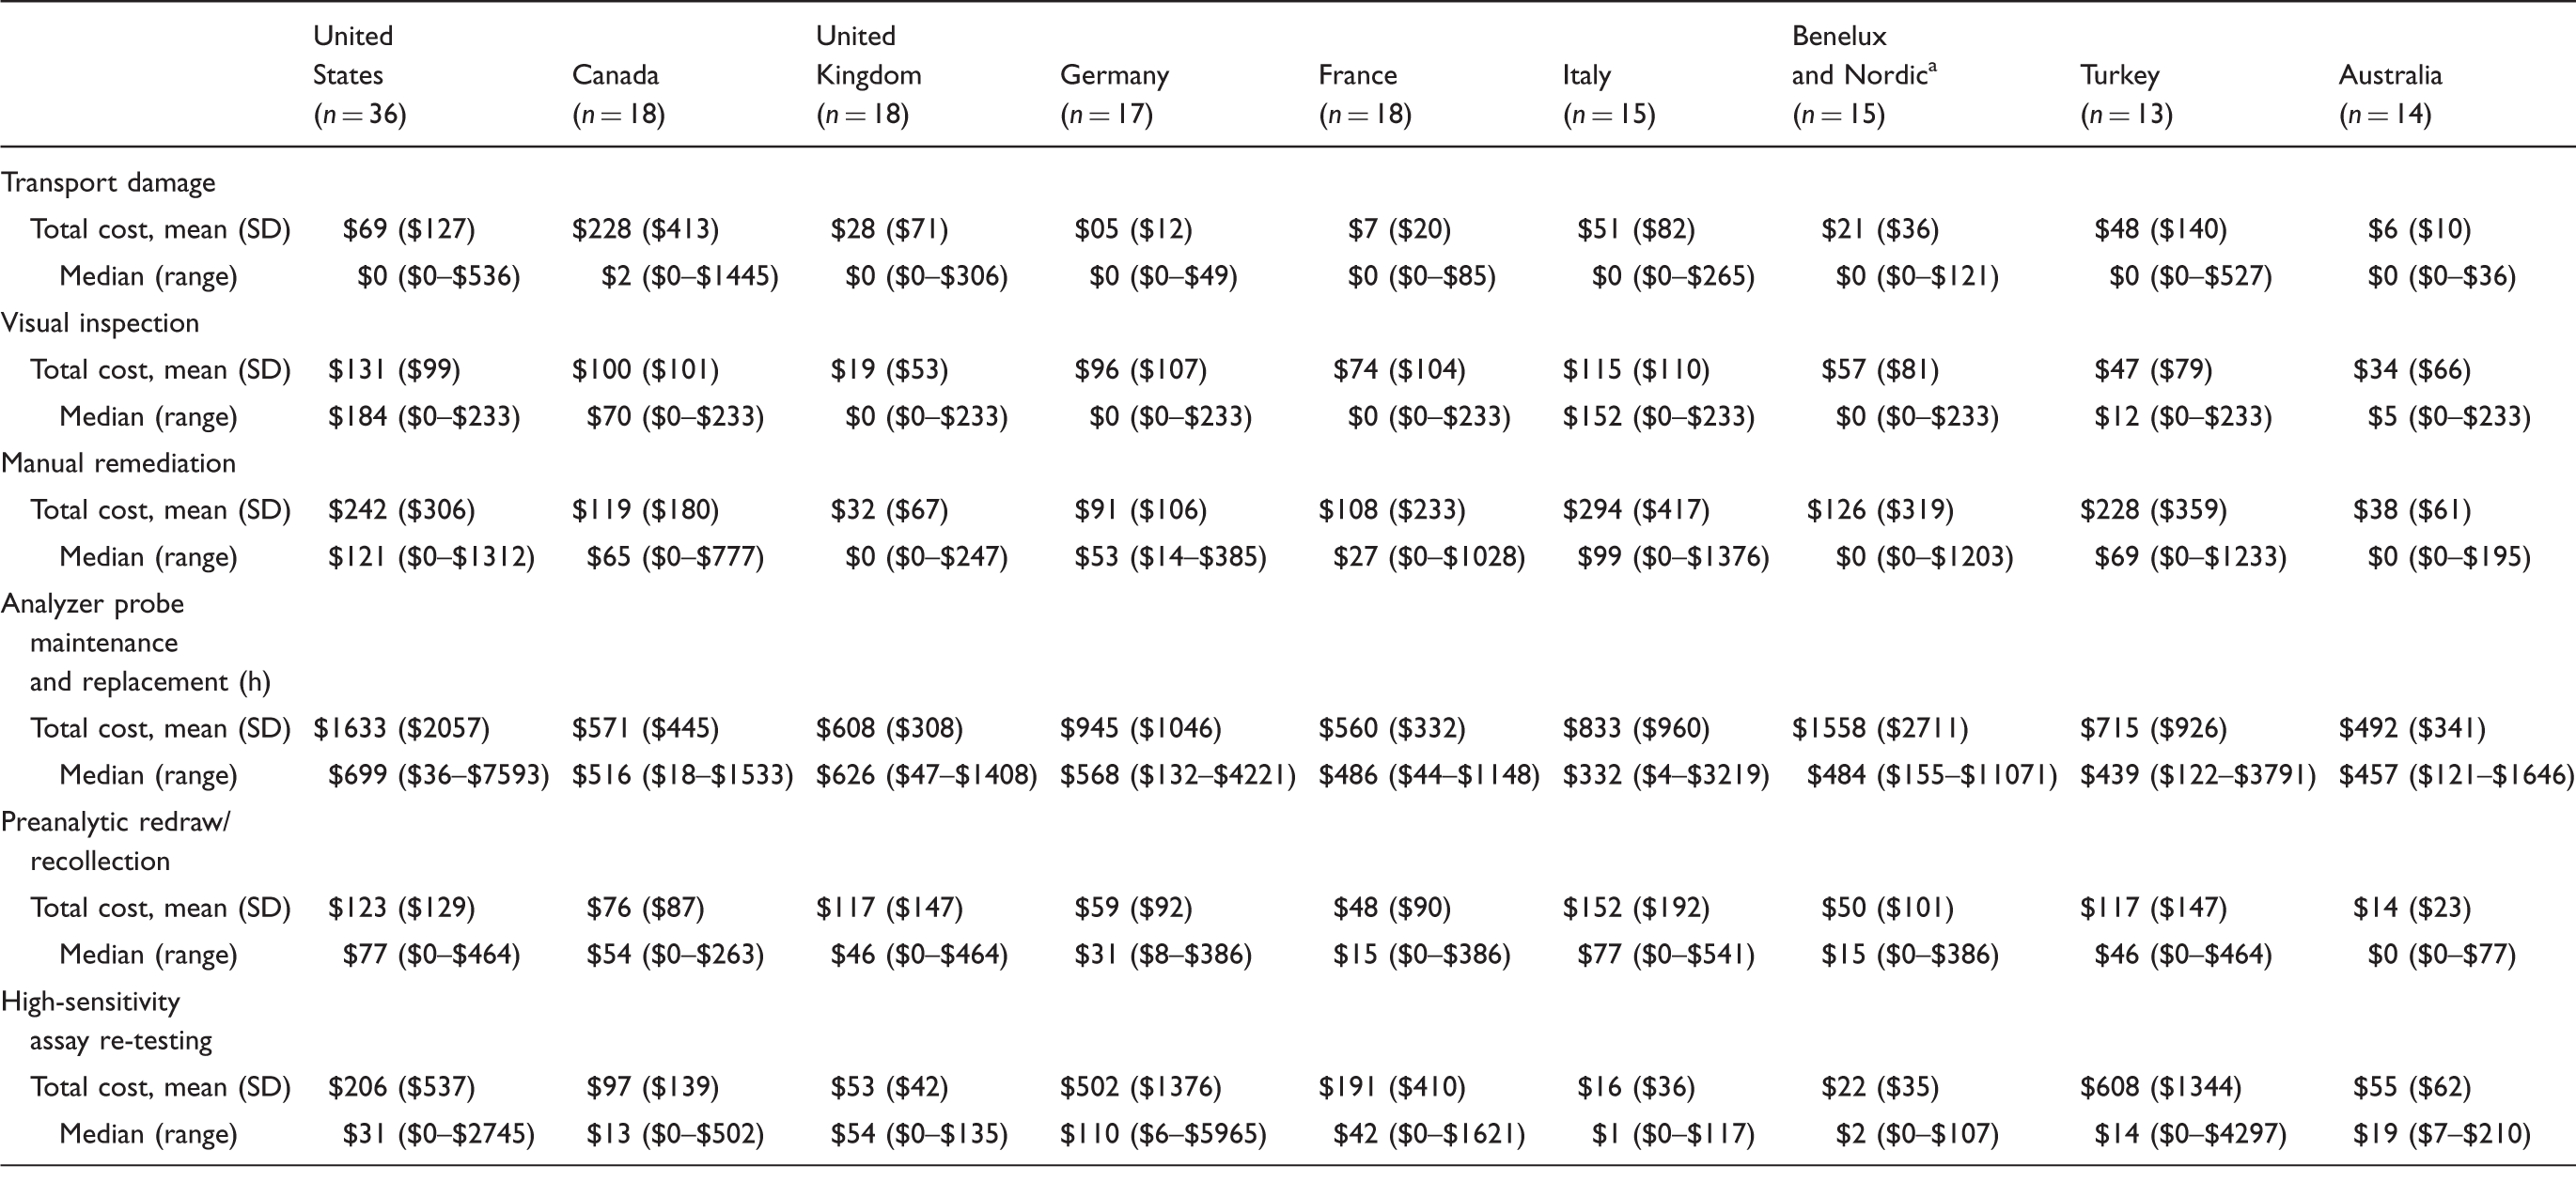
Note: All costs are annual and in 2013 USD.
SD: standard deviation.
Benelux includes Belgium, Netherlands, and Luxembourg; Nordic includes Finland and Sweden.
Discussion
The survey data demonstrate that blood sample quality issues related to fibrin strands, fibrin masses and gel globules occur in laboratories across the regions examined and highlight interesting region-specific differences that may reflect disparities in sample collection, testing practices or awareness regarding specific sample quality issues. Reported differences between surveyed laboratories regarding the sample quality issue incidences and general practices could likewise reflect differences with respect to factors including workflow, sample and test types and instrumentation. While the survey was not powered to examine differences based on these and other related factors, these represent important considerations for all laboratories.
While a lack of visual inspection or manual remediation may lead to downstream problems if fibrin or gel globules are present in the sample and left unremediated before reaching the analyser, it should be noted that the timing of visual inspection and manual remediation was not addressed in the survey. Further, it was not determined whether the fibrin strands/masses or gel globules were the sole cause of the necessary probe maintenance or repair. In addition, it is important to note that automation might contribute to a lack of preinspection; if laboratory processes are automated, tubes might only be inspected after a sample is rejected. It is also possible that additional unmeasured factors contributing to sample quality issues could impact results. For example, measurement of electrolytes with instruments using an ion selective electrode might be associated with an increased risk of aspirating fibrin and/or gel in samples and affecting probe performance. 24 Given these important considerations, future studies (including follow-on surveys or observational laboratory-based studies) focused on evaluating the comparative ability and corresponding cost-effectiveness of the various methods used to detect sample quality issues (e.g. visual inspection, preanalytics, detection by automated analyser and discovery of rejected results) are warranted.
This survey was intended to provide a broad view of current laboratory practices and the prevalence and potential impacts of fibrin- and gel-related samples quality issues. The study design did not specify the inclusion of minimum numbers of respondents from laboratories using tubes or analytical platforms from particular manufacturers. Thus, the study was not powered to statistically compare sample quality issue rates in light of such factors. Notably, some tube types were more highly represented than others among survey respondents (e.g. 61.0% of respondents reported using BD tubes), which may have contributed to a biased representation of tubes used across all clinical chemistry laboratories, with potential impacts on the data. Additional research is needed to more comprehensively understand the impacts of factors including sample tube and analyser type on the prevalence of specific sample quality issues, error rates and the resulting economic implications on the laboratory. Further, while data regarding inspection, remediation and recollection practices were collected in order to highlight their contribution to annual laboratory costs, the relative success of these approaches requires more in-depth studies of laboratory workflow.
Interestingly, fibrin and gel globules were more commonly reported in mostly serum versus mostly plasma laboratories, which may be related to the different serum tube components (e.g. clot activators) and treatment of serum samples (sufficient clotting time requirement).18,19 It is important to note, however, that respondents were not asked directly about which sample types were more prone to these specific sample quality issues. Thus, a more detailed understanding of sample- and type-specific issues requires further study. Additionally, the survey did not collect data regarding all laboratory procedures, such as sample standing time or storage conditions, which may contribute to sample quality issues. Interestingly, however, transportation damage was identified as potentially impacting sample quality by a number of respondents (Table 2). While this suggests storage during transport as a potential concern, this cannot be addressed through the present survey and requires further study.
Due to the self-reported nature of the survey, no independent verification or observations were made. Reported incidences of fibrin or gel globules may be higher than actual incidences due to the disruptive nature of their presence; however, we have no reason to believe that these values were inflated. Although the results of the survey cannot be generalized to all clinical chemistry laboratories in these regions, the data do represent a diverse set of laboratories with varying capabilities across a variety of geographic regions.
Previous studies have shown that errors in the preanalytical phase are often due to sample quality problems related to collection and processing;1,11 however, there have been few studies investigating the incidence of sample quality issues related to fibrin and gel particles specifically, and the methods employed by laboratories to remediate them. To the best of our knowledge, this is the first in-depth study of the incidence and impacts of these specific issues across multiple geographic regions.
Efforts related to preanalytical and analytical erroneous result mitigation have largely been focused on informatics and automating laboratory processes, 25 and although these improvements have been helpful, significant time and capital are still spent remediating blood sample quality issues in laboratories, as exhibited by the present study. As demonstrated by our economic estimates, even sample defects that occur relatively infrequently can have important impacts on laboratory workflow and costs. While this study was focused on the laboratory, the impact of these sample quality issues on patients (for example, time required to return for redraw, pain resulting from repeated venipuncture) were not estimated. These are also important downstream effects, however, that warrant attention from clinical chemistry laboratories. The results of this study suggest that focusing on improving the quality of the blood sample itself, for example by improving collection practices, transport or blood collection tube technology, may be the next logical step for further prevention and reduction of erroneous test results.
Footnotes
Acknowledgements
The authors acknowledge Alissa Kerner, Scott Paluszkiewicz, and Matthew O’Hara of Boston Strategic Partners, Inc. funded by Becton Dickinson and Company for editorial support.
Declaration of conflicting interests
EPE, SC, and EP are employees of Becton Dickinson and Company. DM was previously an employee of Becton Dickinson and Company, and is now an employee of Pfizer, Inc. VSK is an employee of Boston Strategic Partners, Inc., funded by Becton Dickinson for the conduct of the study.
Funding
This study was funded by Becton Dickinson and Company, Franklin Lakes, NJ, USA.
Ethical approval
Not applicable.
Guarantor
EPE.
Contributorship
DM and VSK contributed to study design and execution, data interpretation, and development, review, and approval of the manuscript. EPE, SC and EP contributed to data interpretation and development, review, and approval of the manuscript.
References
Supplementary Material
Please find the following supplemental material available below.
For Open Access articles published under a Creative Commons License, all supplemental material carries the same license as the article it is associated with.
For non-Open Access articles published, all supplemental material carries a non-exclusive license, and permission requests for re-use of supplemental material or any part of supplemental material shall be sent directly to the copyright owner as specified in the copyright notice associated with the article.