
Abstract
Background
It is necessary to achieve a reduction in the number of requests for laboratory tests by improving the appropriateness of testing behaviour. The aim of the study was, first, to compare laboratory requiring patterns for emergency department (ED) patients in clinical laboratories of different institutions in Spain; second, to design an appropriateness pre-pre-analytical quality control report based on appropriateness indicators.
Methods
A call for data was posted on a website. We obtained production statistics for the year 2010 from emergency laboratories at 36 hospitals. Two types of appropriateness indicators were calculated: test request per 1000 ED admissions or related test requesting ratios. In order to explore the inter-practice variability in tests requests, the ‘index of variability’ was calculated. A pre-pre-analytical quality control report was designed, prepared and sent to each participating laboratory. The savings generated, if each Health-care Department would have achieved the appropriate indicator standard, were calculated.
Results
The rate of request of the stat tests ranged from 44 to 412 per 1000 ED patient admissions. There was a high and peculiar dispersion of related test requesting ratio results. If every single laboratory would have achieved the appropriate indicator, we would have saved 1,019,230 urea, 302,511 AST and 316,161 CK unnecessary tests.
Conclusions
There are large variations of test requesting in the emergency setting. An appropriateness pre-pre-analytical quality control report was useful for comparing requesting patterns. The study shows the need to unify demand. The key to achieve this goal will be interdepartmental cooperation between ED clinicians and laboratory professionals.
Introduction
The volume of stat laboratory tests has increased considerably over the last year. 1,2 Several studies have suggested that inappropriate test ordering is a primary reason for the increase in laboratory expenses. 3 Laboratory data is an essential part of health care; it is used to verify diagnosis or to monitor treatment in 70% of clinical decisions. Conversely, it only accounts for a very small proportion of the overall health-care costs. 4 Inspite of that, in the actual scenario where the resources of the health-care sector are scarce, it is necessary to achieve a reduction in the number of requests for laboratory tests by improving the appropriateness of testing behaviour. The latter is an essential part of laboratory management quality improvement. 5
As Smellie 5 states ‘the appropriateness of tests depends on the clinical context of the patient, the severity of the disorder, the administrative necessities and many other factors’. Inappropriate tests could be defined as those that could reasonably be avoided at no significant detriment to a patient's care. 6 Inappropriateness may, however, be caused by over- or under-test requesting. The latter is more difficult to detect and, thus, may represent a bigger problem in stat setting.
The main features of stat laboratory test are two: (1) the reason for the request, when tests results may imply a change in patient treatment, and (2) the low turnaround time. Inappropriate stat laboratory test requesting may generate considerable concerns in the emergency department (ED) patients. By increasing the number of requested tests, laboratory turnaround time (TAT) will increase. This delay may have dramatic consequences in those really critical ED patients, affecting global ED patient outcome efficiency.
It is difficult to determine if a laboratory test is a tool for improving clinical effectiveness and patient outcome. To evaluate laboratory tests inappropriateness through studies that measure how requesting tests results has improved health outcomes is difficult, costly and cumbersome. 7 Under- and over-use of tests can only be judged in the context of the care pathway and the health outcomes. This is usually analysed in very costly prospective studies that take many years before they yield any answers. As opposed to these costly studies, a simple method to assess requesting patterns would be to study the regional differences in requiring tests. 6
The aim of the study was, first, to compare laboratory requesting patterns for ED patients in clinical laboratories of different institutions in Spain; second, to design an appropriateness pre-pre-analytical quality control report based on appropriateness indicators to be used by every laboratory to easily visualize and monitor over time its individual requesting situation compared with others.
Methods
A call for data was posted on a website (
Each participating laboratory was required to be capable of obtaining patient data from local databases and provide organizational data (i.e. population served, type of management, number of beds, location). After collecting data, two types of appropriateness indicators were calculated in a single coordinator institution: test request per 1000 ED admissions or related test requesting ratios. The statistical treatment of the previous calculated data included the mean, 95% confidence level for the mean, standard deviation, median and interquartile range. In order to explore the interpractice variability in tests requests, the ‘index of variability’ was calculated as follows: top decile divided by bottom decile. With these data, a frequency histogram and a box plot for each of the indicators was constructed, and a pre-pre-analytical quality control report was designed, prepared and sent to each participating laboratory indicating their individual results as compared with the others.
The savings generated, if each health-care department would have achieved the appropriate indicator standard (0.2 for aspartate transaminase (AST)/alanine transaminase (ALT), and 0.1 for urea/creatinine) were calculated. 8 Finally, savings if creatine kinase (CK)/troponin ratio would have been <1 were calculated.
Results
Laboratory organizational data.
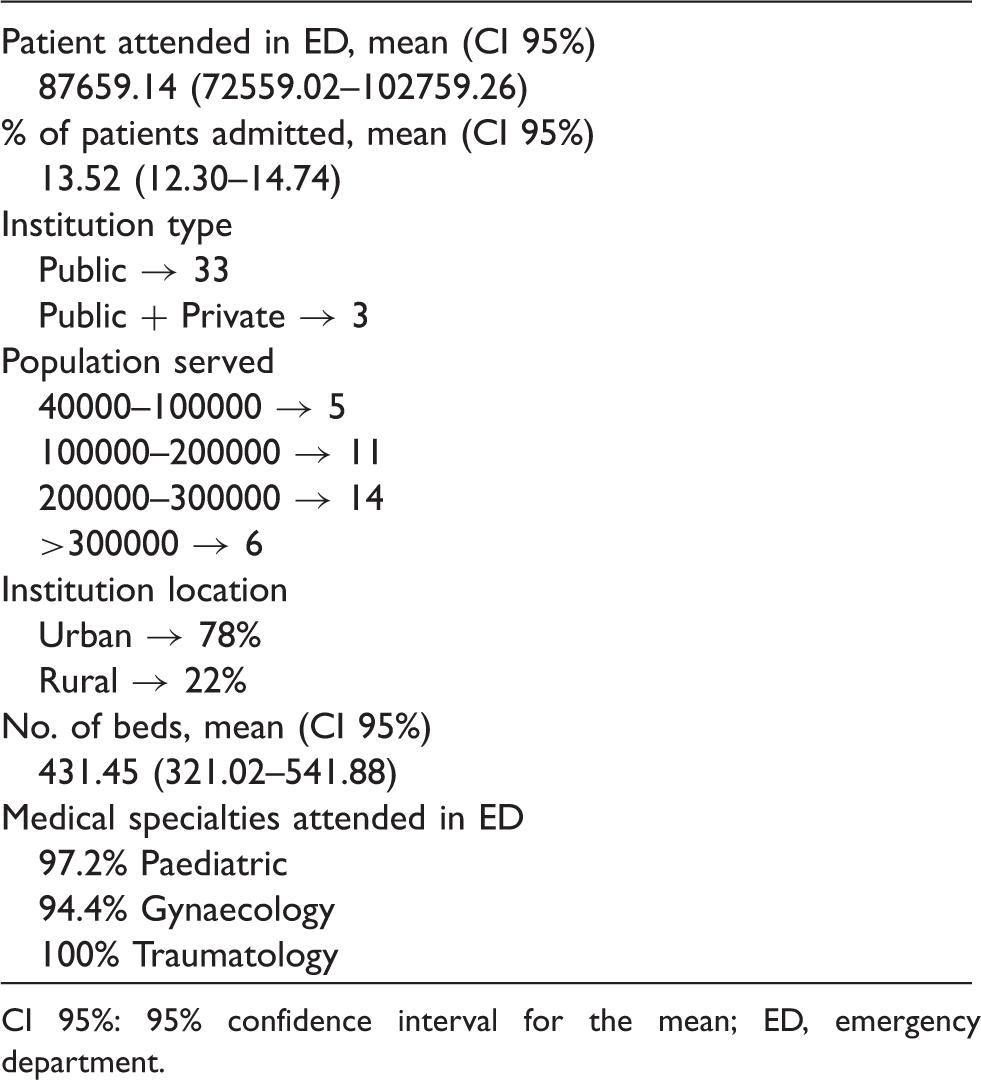
CI 95%: 95% confidence interval for the mean; ED, emergency department.
Mean, median, range and variability index (percentile90/percentile10) of every indicator result.
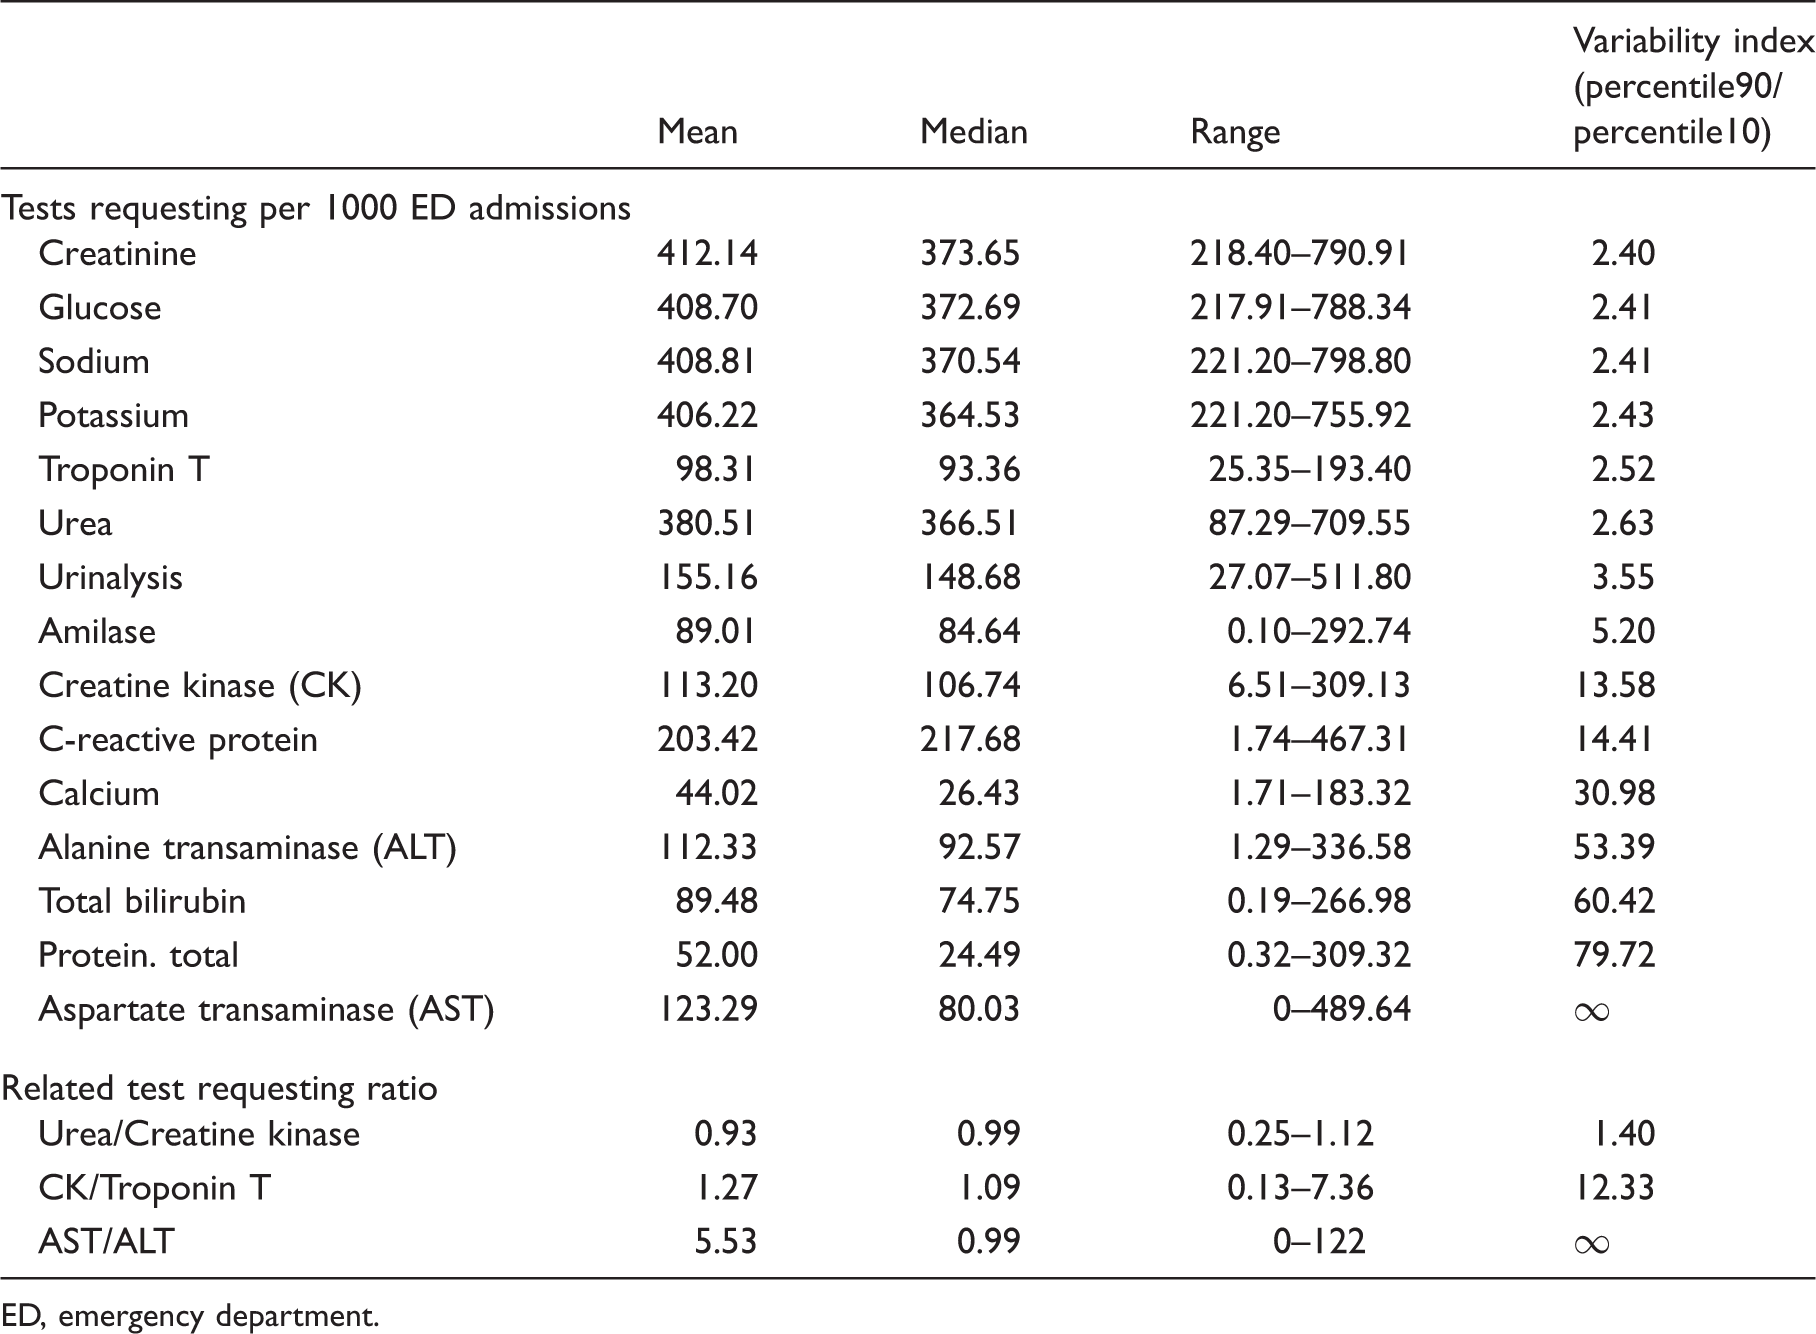
ED, emergency department.
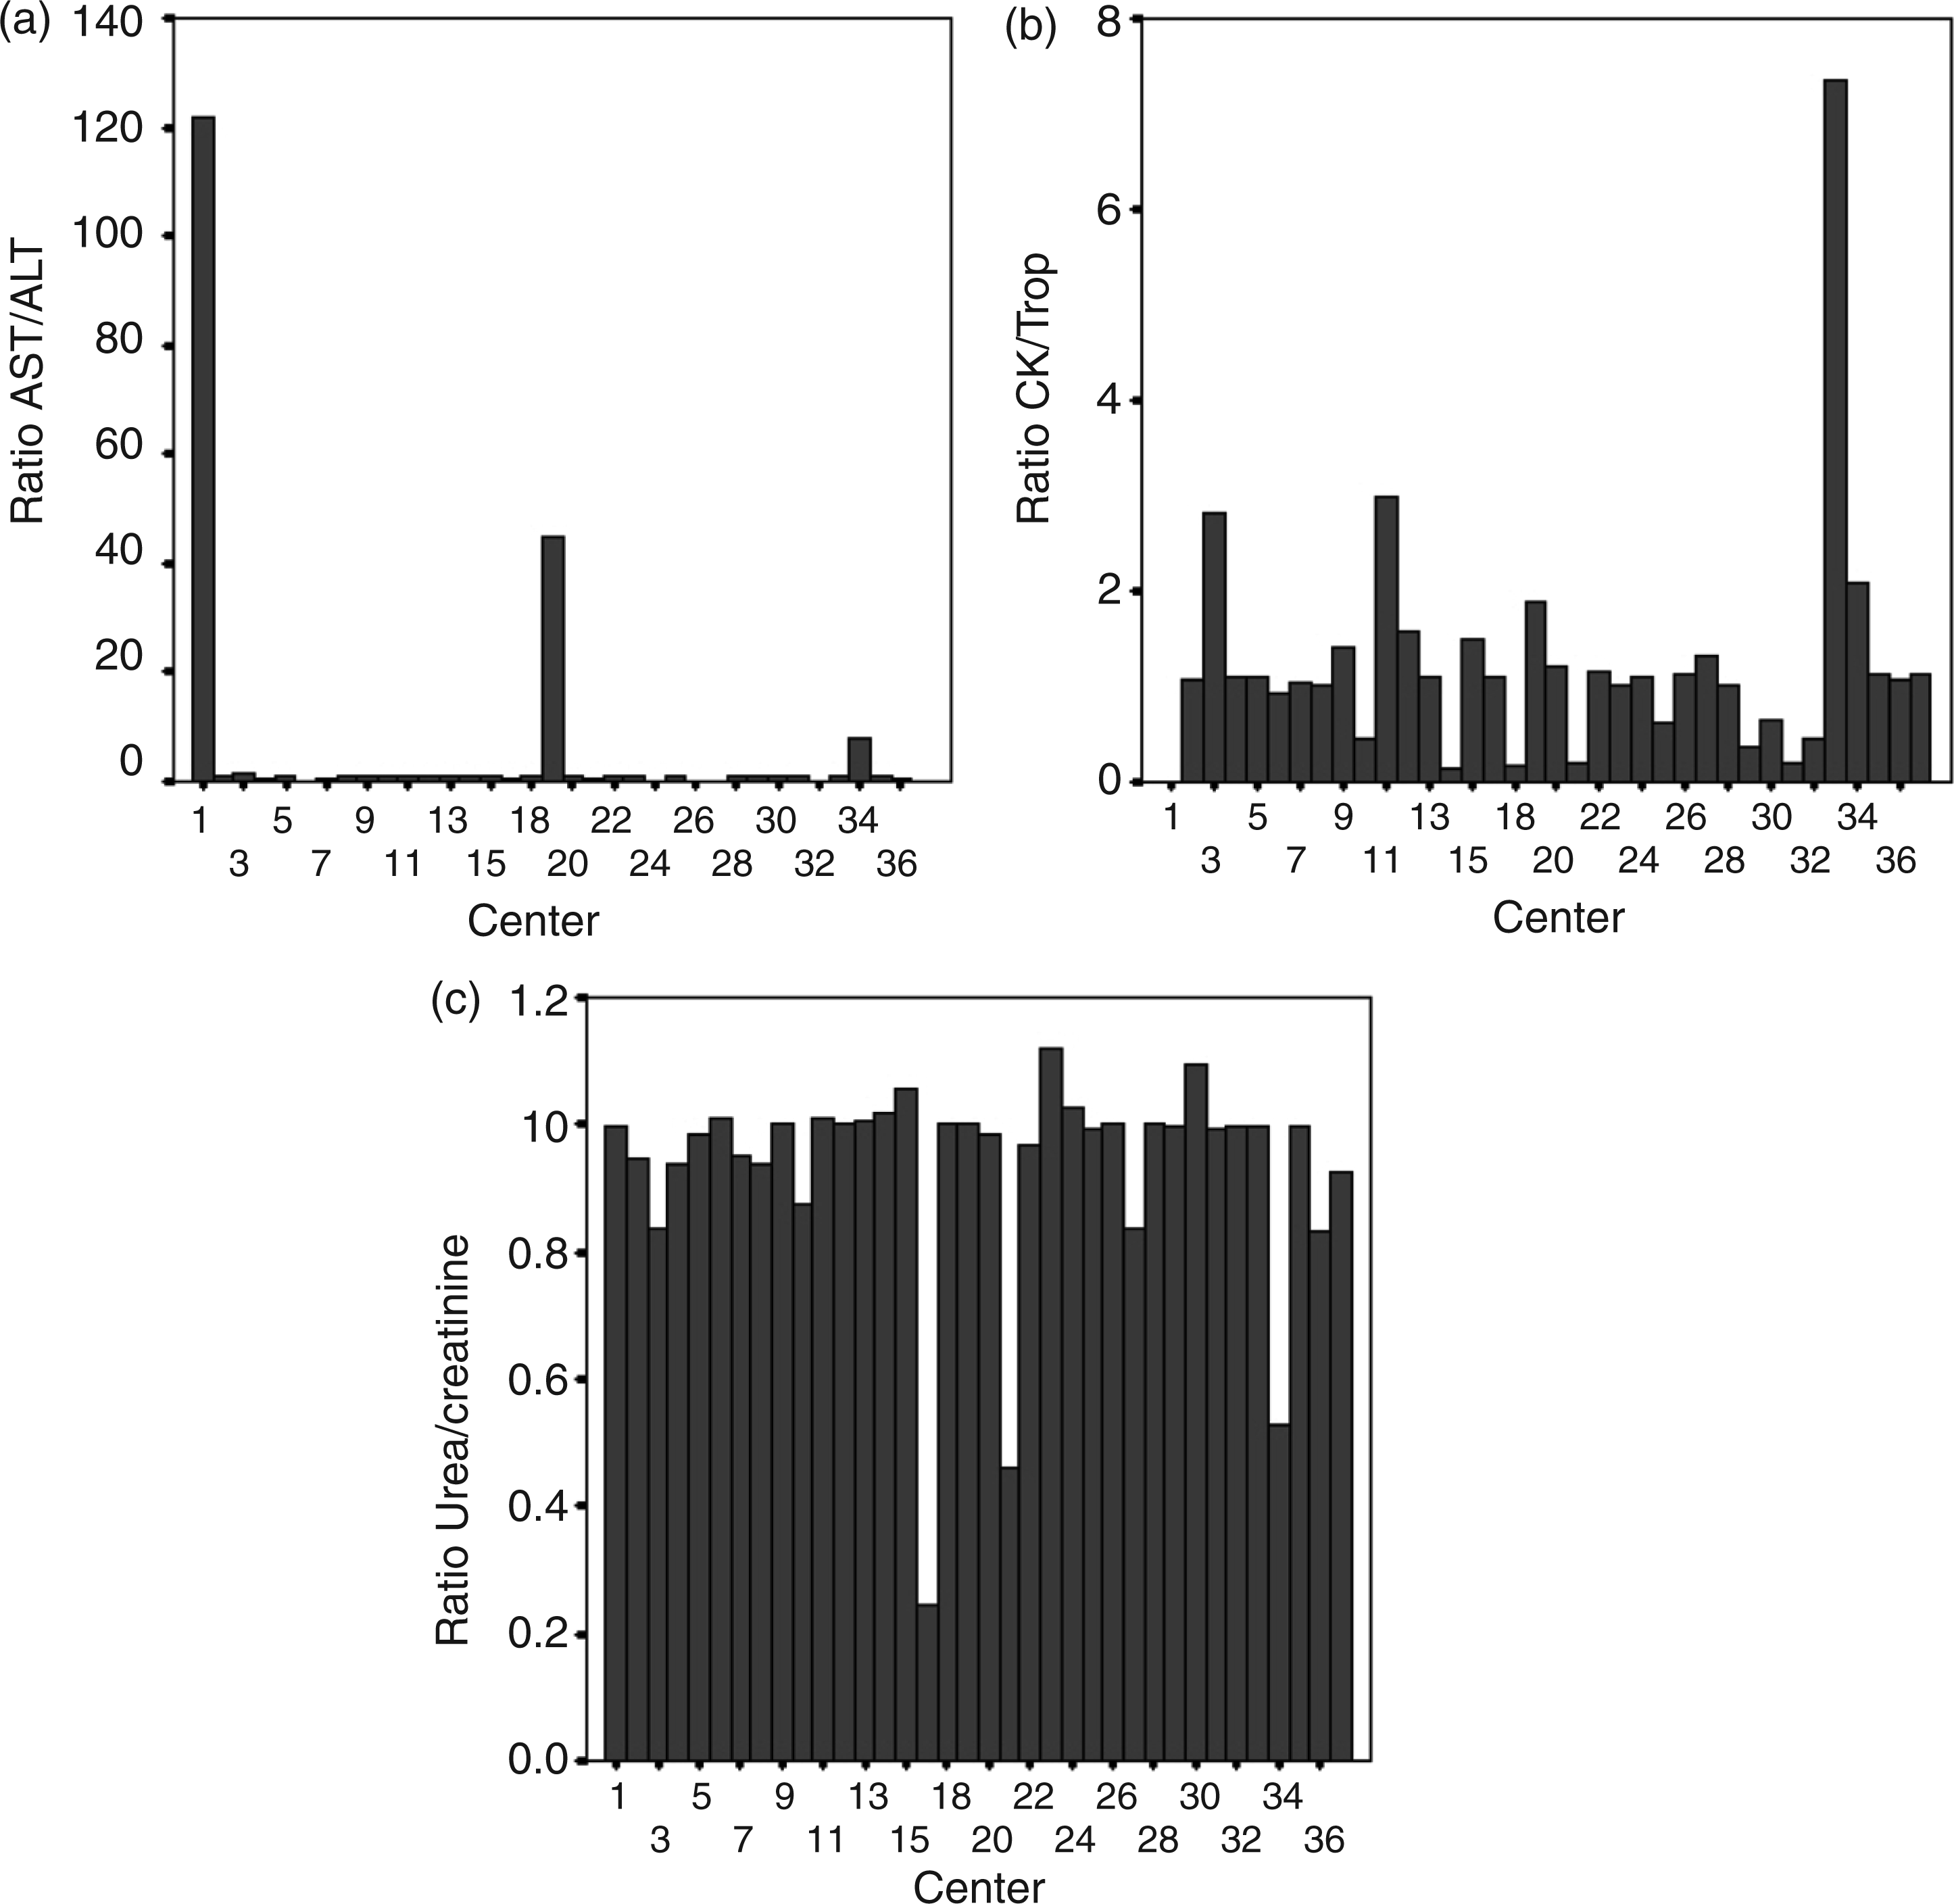
Dispersion of related test requesting ratio results: (a) AST/ALT: aspartate transaminase/alanine transaminase. (b) CK/Trp: creatine kinase/troponin. Centre 1 does not make Troponin in Stat Laboratory. (c) Urea/creatinine.
Figure 2 shows one of the sheets of the report sent to every laboratory that participated in the study. Each report had 18 sheets, each one regarding a single indicator: 15 test requests per 1000 ED admissions and three related test requesting ratios.
One of the sheets of the report sent to every laboratory that participated in the study. Alanine transaminase, The data follow a normal distribution, (Kolmogorov–Smirnov Test →P = 0.456), Descriptive statistics: N = 36; Mean = 112.33; CI 95% = 81.68–142.98; Standard deviation = 90.58.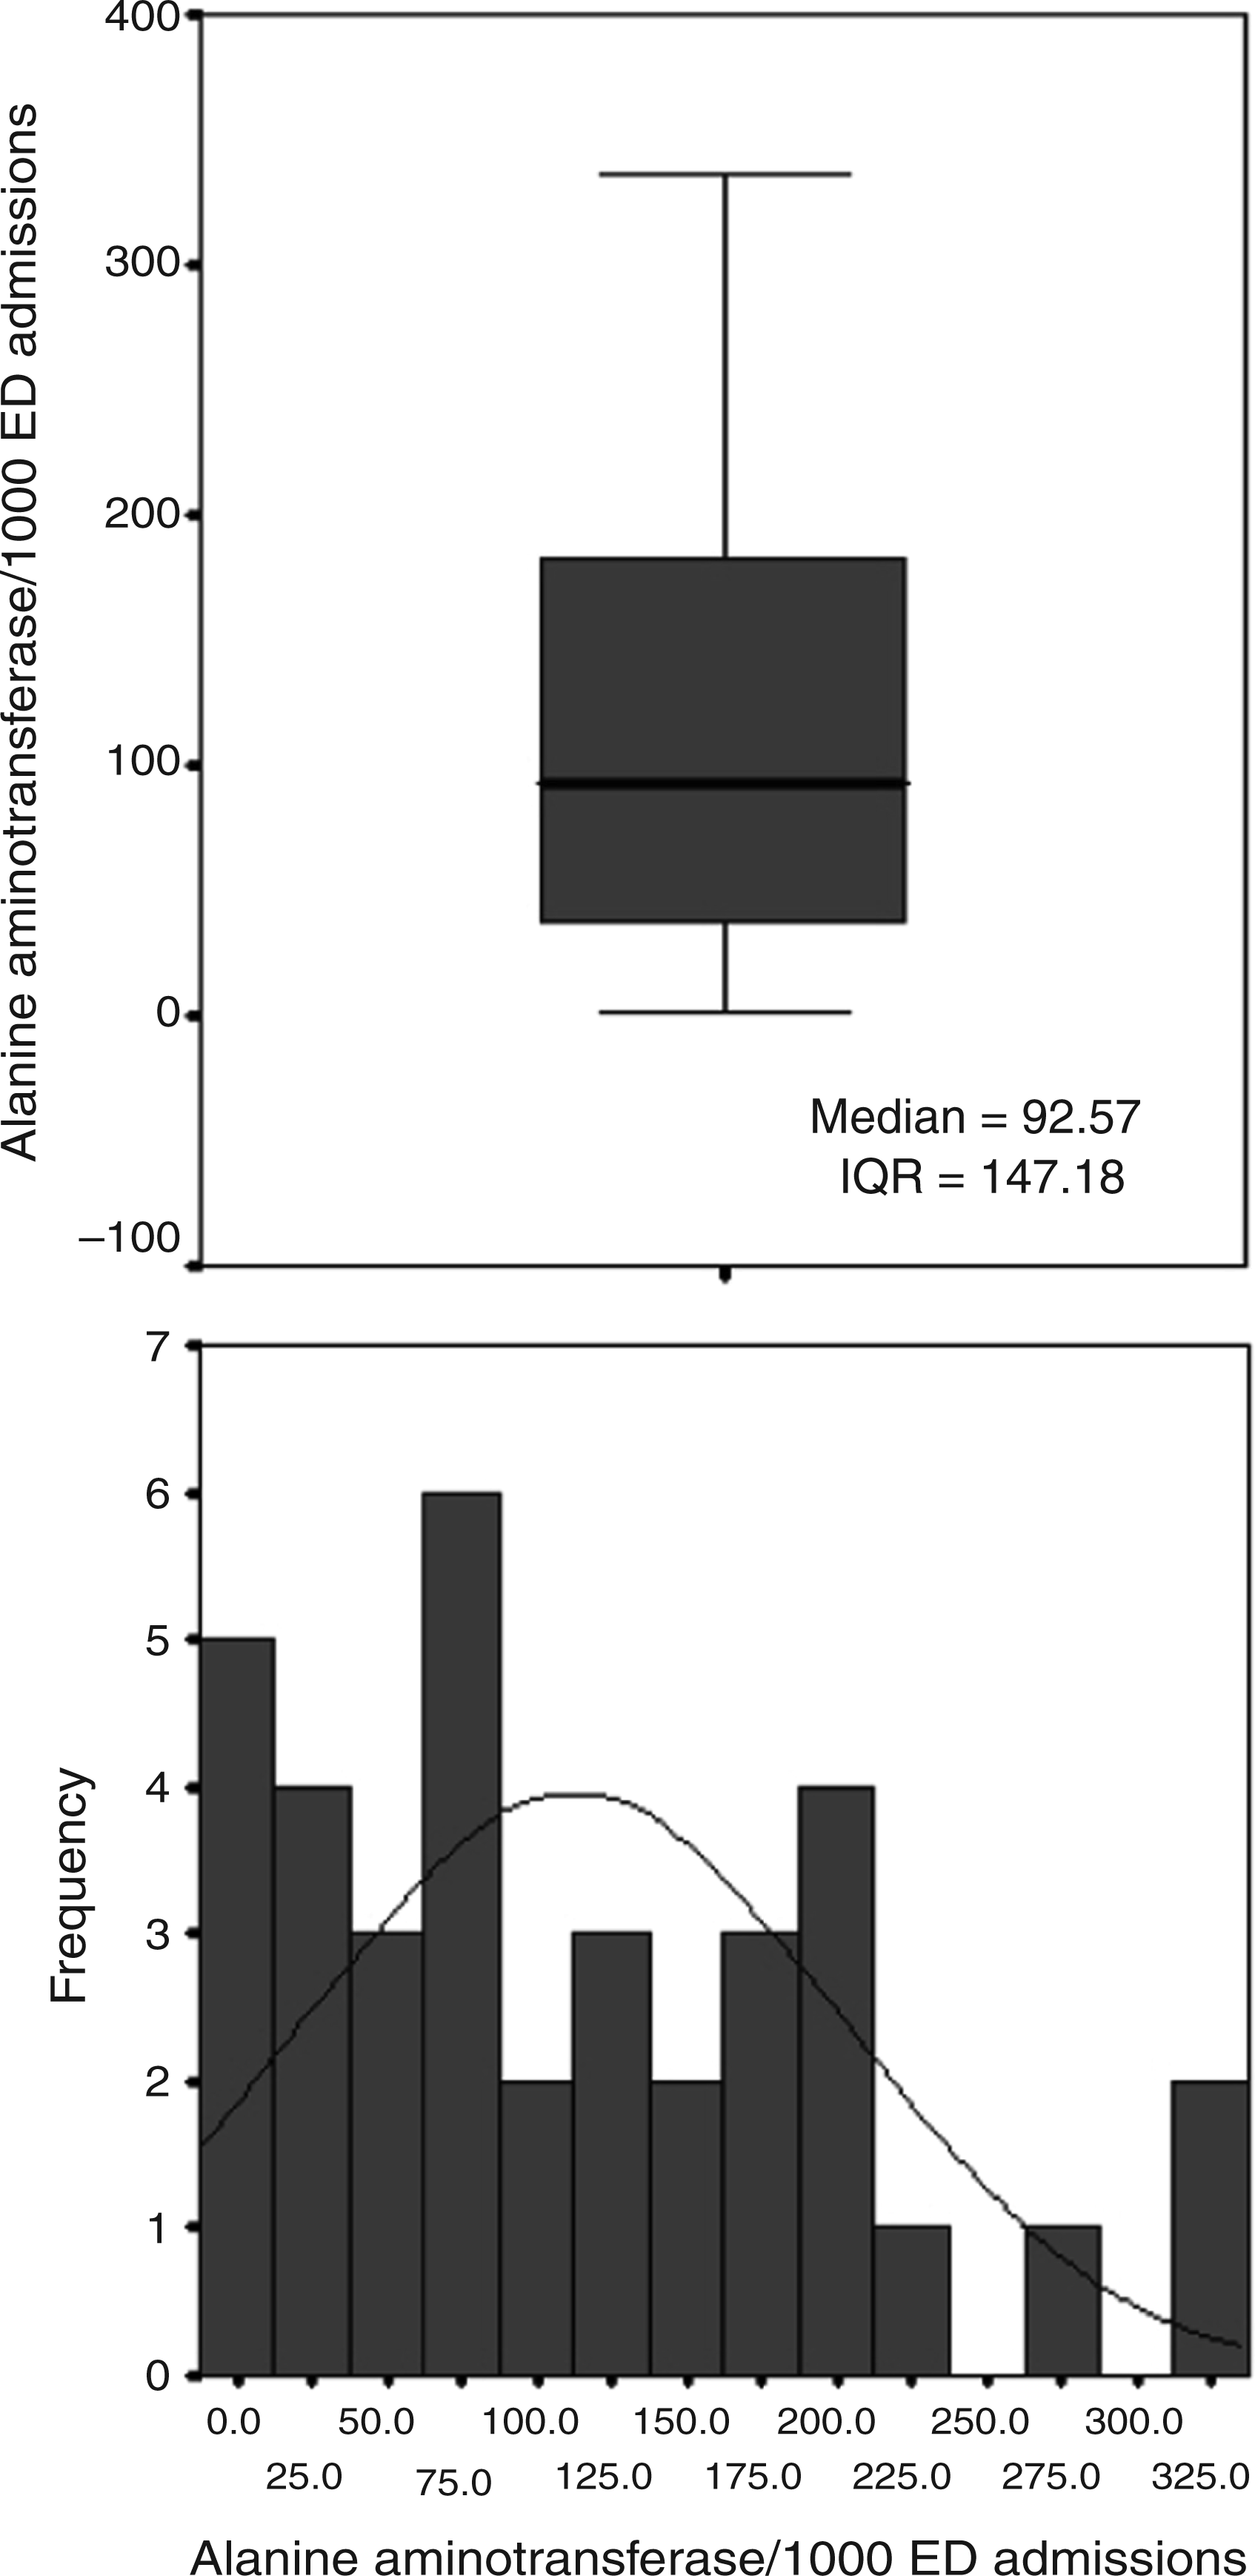
If every single laboratory would have achieved the appropriate indicator, we would have saved 1,019,230 urea, 302,511 AST and 316,161 CK unnecessary tests. The savings generated, if each Health-Care Department had achieved the appropriate indicator standard, were €496,361: €111,929 for AST, €254,807 for urea and €129,625 for CK.
Discussion
To our knowledge, this is the first study of stat laboratory test utilization in Spain. A considerable variability exists in the use of almost every stat laboratory test. The variability was strikingly high for the less frequently requested tests, despite the fact that there are clear accepted indications for such requests in the ED. This highlights the reality that some tests can be improperly requested probably out of habit or a wrong routine in some institutions.
The broad variability is also shown on a test-by-test basis. It is surprising to observe the great differences in requesting pattern in almost every studied test, including those that are frequently requested such as serum creatinine, glucose, sodium, potassium and urea. Urea and creatinine requests were similar for the majority of institutions as they were requested simultaneously, despite it being shown that creatinine is the first-line renal marker and serum urea provides little more information than creatinine alone. 9,10
CK was more frequently requested than troponin and showed more variability between centres although cardiac troponins are the best biochemical markers for the diagnosis, risk stratification and selection of therapy in acute coronary syndromes. 11 Again, this emphasizes that in some participant hospitals CK was probably requested out of habit. Indeed, both tests were simultaneously automatically requested in profiles in a redundant manner in seven laboratories.
Urinalysis and amylase requests present significant variations between institutions, despite both tests having limited indications in the emergency setting.
Probably, the high demand for C-reactive protein tests in some areas indicates a more frequent use to detect/rule out infectious/rheumatoid diseases, when compared with other areas. C-reactive protein was clearly an over-demanded test in some areas, and probably the information offered will be redundant with other laboratory tests such as leucocytes or neutrophils count, or even clinical symptoms such as fever.
Either ALT or AST was used as a single first liver marker. This explains the large differences observed in AST/ALT indicator results. There were three institutions where AST is requested as first liver marker; ALT was used as first liver marker in eight, and both were requested redundantly in the rest. Curiously enough, in certain centres AST and ALT requests were identical (1:1 demand ratio). Different studies show the ALT utility as a first liver marker. 12,13 There is evidence indicating that serum AST provides little more information than ALT alone. Despite that AST was strangely used as the first liver marker in some centres. It is not possible with our data to elucidate why this happened. Hopefully, our results will help different institutions in comparing their requesting patterns with a standard which will result in the establishment of measures to ensure an appropriate demand pattern.
Bilirubin request rates varied widely in our study. Many centres showed high rates of request of this test which is not recommended as a liver screening test. 14
There was also a huge difference in the requesting patterns of calcium and protein. It would be necessary for more patients and/or more participating institutions information to try to explain this fact.
Using indicators designed as requests per 1000 admissions as denominator, is a simple way to systematize the requesting rate that allows comparing laboratory request patterns between different laboratories. As such, we can learn about requesting patterns, 15 through a non-expensive way. Information generated through ratio indicators is currently very useful, but will be key in an emergency setting where ‘time is money’. One extra inappropriately processed test can delay appropriate tests laboratory report in severely ill patients.
The high variability of indicator results shows a probable stat abuse and misuse, a dangerous consideration in the emergency setting. Requests that are not justified may lead to delays in testing for patients who have truly life-threatening conditions. The great differences observed in the study for all tests in such a large population are inconsistent with the goal of providing equitable care and apparently reflects local traditions. 6 The differences are probably due to individual variations in clinical practice; however, they still undermine laboratory cost-effectiveness efforts and therefore should be changed, 7 preferably through regional strategies 7 developed by consensus between ED clinicians and clinical pathologists and formalized in health-care governance measures.
We have shown a practical and effective methodology to identify and monitor pre-pre-analytical test requesting behaviour, taking advantage of the data from every laboratory database achieved through a daily total testing laboratory process. Such a methodology implies continuous data collection over time and obtaining the pre-pre-analytical quality indicators without extra effort. We have designed and used, an appropriateness pre-pre-analytical quality control report based on appropriateness indicators that has been sent to every laboratory to visualize at a glance the individual requesting situation when compared with others. It provides meaningful information on each laboratory pre-pre-analytical requesting process, creating an ideal foundation not only to obtain a ‘photo’ of the current individual requesting pattern when compared with others, but also for future efficient feedback between different laboratories, or intralaboratory over time, to monitor requesting after the establishment of corrective measures.
We only studied the savings that would have been generated if three tests ratio indicator results would have achieved the indicator goal. As CK/troponin indicator target result is not referred to in the bibliography, we calculated the savings to achieve at least more troponin than CK requests. Our results show that the total savings would have been considerable. If we extrapolate these figures to calculate the total savings for all the health-care areas in Spain and all the tests requested in the ED, those would be enormous.
This study revealed that a considerable variability exists in the use of stat laboratory tests by 36 different EDs. It is not easy to establish a relationship between variability and hospital characteristics, or to establish a relationship between the indicator value and the type of hospital. The main limitation of the study is that different requesting patterns could be explained by case-mix differences in the different hospitals ED or the possible differences in the patient population that attended the different hospitals. In any case, such a large dispersion is very difficult to be explained only due to different patient demographics. The study also identified appropriate indicators that can be applied across a spectrum of clinical laboratories, and may be useful for examining requesting patterns. The main finding of this study, the large variation of ED test requesting, highlights the need to unify demand by optimizing the use of appropriate tests through interdepartmental communication and rigorous application of scientific evidence. An appropriateness pre-pre-analytical quality control report based on appropriateness indicators has been designed and used to show current individual requesting patterns compared with others. This can be further used to monitor demand over time once corrective measures have been established. 16
Conclusion
There are large variations of test requesting in the emergency setting. An appropriateness pre-pre-analytical quality control report based on appropriateness indicators results has been designed and applied across a spectrum of clinical laboratories. The study results show the need to unify demand. The key to achieving this goal will be interdepartmental cooperation between ED clinicians and laboratory professionals to evaluate test ordering patterns and to develop protocols and guidelines in order to optimize efficiency in medicine, to achieve a good use of diagnostic testing, on which many emergency clinical decisions are based.
Footnotes
Acknowledgements
Members of the REDCONLAB working group are the following Consuelo Tormo (Hospital General de Elche); Laura Navarro (Consorcio Hospitalario de Albacete); Mario Ortuño (Hospital Universitario de la Ribera, Alzira); José Sastre (Hospital Virgen de los Lirios, Alcoy); Maria Angeles Jiménez (Hospital de Antequera); Juan Ignacio Molinos (Hospital Comarcal de Sierrallana, Torrelavega); Jose Antonio Ferrero (Hospital General de Castellón); Maria del Pilar Megia (Hospital Virgen de Altagracia, Ciudad Real); Juan Bautista Ortola (Hospital de Denia); Ana Santo (Hospital Virgen de la Salud, Elda); Berta Gonzalez-Ponce (Hospital Da Costa, Burela); Julian Díaz (Hospital Francesc de Borja, Gandía); Vicente Granizo (Hospital Universitario de Guadalajara); Isidoro Herrera (Complejo Hospitalario de Jaen); Silvia Pesudo (Hospital de La Plana, Castellon); Raquel Blázquez (Hospital Universitario de Mostoles); Martin Yago (Hospital General de Requena); Diego Benitez (Hospital Vega Baja, Orihuela); Virtudes Chinchilla (Hospital General Universitario de Alicante); Pilar Garcia-Chico (Hospital General Universitario de Ciudad Real); M. Amalia Andrade-Olivié (Hospital Xeral – Complejo Hospitalario Universitario de Vigo); Mercé Ribelles (Hospital Arnau de Vilanova, Lleida); Jose Luis Barberá (Hospital de Manises); Felix Gascon (Hospital Valle de los Pedroches, Pozoblanco); Amparo Miralles (Hospital de Sagunto); Luis Rabadán (Complejo Hospitalario de Soria); Rafael Sánchez-Parrilla (Hospital Universitario Joan XXIII, Tarragona); Juan Molina (Hospital Comarcal de la Marina Baixa, Villajoyosa); Goitzane Marcaida (Consorcio Hospital General Universitario de Valencia); Begoña Laíz (Hospital Universitario La Fe, Valencia); Carmen Vinuesa (Hospital de Vinaros); Maria Fatas (Hospital Universitario Severo Ochoa, Madrid); Francisco Miralles (Hospital Lluis Alcanyis, Xativa); Maria Poncela (Complejo Asistencial Universitario de Burgos) and Arturo Carratala (Hospital Clínico Universitario de Valencia).
Declaration of Conflicting Interests
None.
Funding
None.
Ethical approval
Not applicable.
Guarantor
MS.
Contributorship
MS, ML-G and JU conceived, designed and drafted the manuscript; MS, ML-G and JU revised the final manuscript. All the authors contributed to the concept, reviewed all versions of the manuscript and commented, and approved the final revised version of the manuscript.