
Abstract
Background
Studies of gender difference in type 2 diabetes have been inconclusive. We investigated gender difference in type 2 diabetes and the contribution of body iron, as assessed by serum ferritin to this difference.
Methods
We performed cross-sectional (n = 1707) and prospective (n = 1506) analyses in males and females aged 53–73 years in 1998–2001. Type 2 diabetes diagnosis was determined by questionnaire, blood glucose measurements and record linkage to type 2 diabetes registers. Gender difference in type 2 diabetes and serum ferritin contribution to the difference was examined in multivariable logistic and Cox regression models. Gender difference in fasting plasma glucose and insulin and homeostasis model assessment of insulin resistance was examined in linear regression analysis.
Results
In the cross-sectional analysis, a total of 201 type 2 diabetes cases were observed (males = 111 [55.2%] vs. female = 90 [44.8%], P = 0.032), and in adjusted models, males had higher odds of type 2 diabetes (OR = 1.61, 95% CI 1.10 to 2.34); higher fasting plasma glucose (β = 0.28, 95% CI 0.15 to 0.41), fasting plasma insulin (β = 0.73, 95% CI 0.26 to 1.19) and homeostasis model assessment of insulin resistance (β = 0.11, 95% CI 0.04 to 0.17). In the prospective analysis, males had increased risk of type 2 diabetes (HR = 1.46, 95% CI 1.03 to 2.07). With serum ferritin introduction (100 µg/L, log-transformed) into the models, the type 2 diabetes prevalence (OR = 1.35, 95% CI 0.91 to 1.99) and incidence (HR = 1.38, 95% CI 0.96 to 1.97) were appreciably attenuated.
Conclusions
These data suggest a gender difference in type 2 diabetes, with a higher prevalence and increased type 2 diabetes risk in males. Body iron explains about two-fifths and one-fifth of the gender difference in type 2 diabetes prevalence and incidence, respectively.
Introduction
Some studies have suggested that there might be a gender difference in diabetes prevalence 1 and insulin sensitivity. 2 A recent study conducted in a Czech cohort suggests a male predominance in insulin resistance and type 2 diabetes (T2D) prevalence. 3 Evidence in Finland has suggested an alarming increase in the incidence of T2D with male preponderance.4,5 Recent studies in other population have also suggested that male sex is an independent risk factor of T2D.6,7 Furthermore, it is known that T2D risk increases with aging as clearly demonstrated in a multicentre study across different European countries, which showed a consistently higher age-adjusted risk of T2D diabetes (T2D) in males compared to females. 8
Body iron accumulation varies with age and gender.9–11 The physiological loss of blood during menstrual cycle contributes to the marked sex difference in body iron stores between premenopausal females and males of similar age. This evidence is further supported by the striking reduction in the difference postmenopause. 11 Serum ferritin (sF) is a useful marker of body iron stores 12 that has been used to demonstrate the difference in iron accumulation by gender. sF is also an acute phase protein which responds to inflammatory states, and may in addition act as a marker of insulin resistance. 13 However, it has been widely used to assess body iron stores in epidemiological studies, particularly after adjustments for inflammation. 14 Higher sF concentrations are often observed in males compared with females across varying population samples.9,12,15–17 Body iron as assessed by sF is a known independent risk factor of T2D.14,18 As iron accumulation varies by gender, body iron could to some extent explain the possible gender disparity in T2D prevalence and incidence.
The explanation for the gender difference in the prevalence and incidence of T2D is unclear. To our knowledge, no study has investigated whether gender differences in body iron accumulation influence the gender differences in T2D prevalence and incidence. We aimed therefore to address two important study questions. Firstly, whether there is a gender difference in the prevalence and incidence of T2D and the prevalence of abnormalities in glucose metabolism as assessed by fasting plasma glucose (FPG), fasting plasma insulin (FPI) and the homeostasis model assessment of insulin resistance (HOMA-IR), secondly, whether body iron accumulation explains any gender difference in T2D prevalence and incidence, and the prevalence of abnormalities of glucose metabolism.
Methods
Subjects and study design
We performed both cross-sectional and prospective analyses within the Kuopio Ischemic Heart Disease Risk Factor (KIHD) study, which is an ongoing population-based study designed to investigate the risk factors for cardiovascular diseases and other common illnesses in Kuopio and its environs. 19 At baseline examination rounds (1984–1989), a total of 2682 males (83% of the eligible study population) aged 42 to 60 years were recruited in two cohorts. In 1984–1986, the first cohort of 1166 males aged 54 years were recruited and the second cohort of 1516 males in four age categories, 42, 48, 54 or 60 years were enrolled in 1986–1989. 19 During the 11-year follow-up examination round (1998–2001), males from the second cohort were invited of which 854 participated. At the same 11-year examination round, a random sample of 920 postmenopausal females aged 53–73 years from the same area as the males entered the study. Out of those eligible, 95% of males and 78.4% of females participated in the 11-year examination. 20 The non-eligible males for the 11-year follow-up examination round were those who had migrated or had died between the baseline and the 11-year examinations. The 11-year follow-up study served as the baseline for the current analysis. Subjects with missing data on sF (n = 9), FPG or FPI (n = 64) were excluded from the analyses, leaving a total of 1707 individuals for the cross-sectional analysis. After the exclusion of prevalent T2D cases (n = 201) at baseline, the prospective analysis was carried out in 1506 subjects. The KIHD study was approved by the Research Ethics Committee of the Kuopio University Hospital, and all participants gave their written informed consent.
Data collection
Data on body mass index (BMI) and other anthropometry measurements 19 were obtained. In addition, data on dietary intakes of foods and nutrients using a four-day food recording, 21 physical activity using the 12-month leisure-time physical activity Questionnaire of the KIHD study, 22 alcohol consumption, 23 smoking status, 23 history of hypertension 24 and medication for dyslipidemia 24 were collected, and they all have been described earlier. A positive family history of diabetes was defined as the presence of diabetes history in a first-degree relative of the study participant. A history of hypertension was defined as systolic/diastolic blood pressure of ≥140/90 mmHg and/or the use of antihypertensive medication.
Diagnosis of T2D
The diagnosis of T2D was via a self-reporting of a previous diagnosis of T2D and/or FPG ≥ 7.0 mmol/L or 2-h oral-glucose-tolerance-test plasma glucose≥11.1 mmol/L at the study visit and by record linkage to the national hospital discharge registry and the Social Insurance Institution of Finland register for reimbursement of T2D medication expenses. 18
Biomarker and biochemical measurements
After an overnight fast and abstinence from alcohol use for three days and tobacco smoking for 12 h, fasting blood samples were collected between 8:00 and 10:00. The 11-year follow-up sF measurement was assayed from the stored serum samples by radioimmunoassay (RIA) based on a double-antibody technique (RIA Amersham International, Amersham, UK) as described previously. 23 The measurements of serum C reactive protein, 25 serum low-density lipoprotein, high-density lipoprotein and triglycerides, 24 serum insulin and blood glucose measurements 26 were as described previously. HOMA computer algorithm was used to estimate insulin resistance. 27
Statistical analyses
Baseline characteristics of 1707 Eastern Finnish males and females in the Kuopio Ischemic Heart Disease Risk Factor study in 1989–1991.
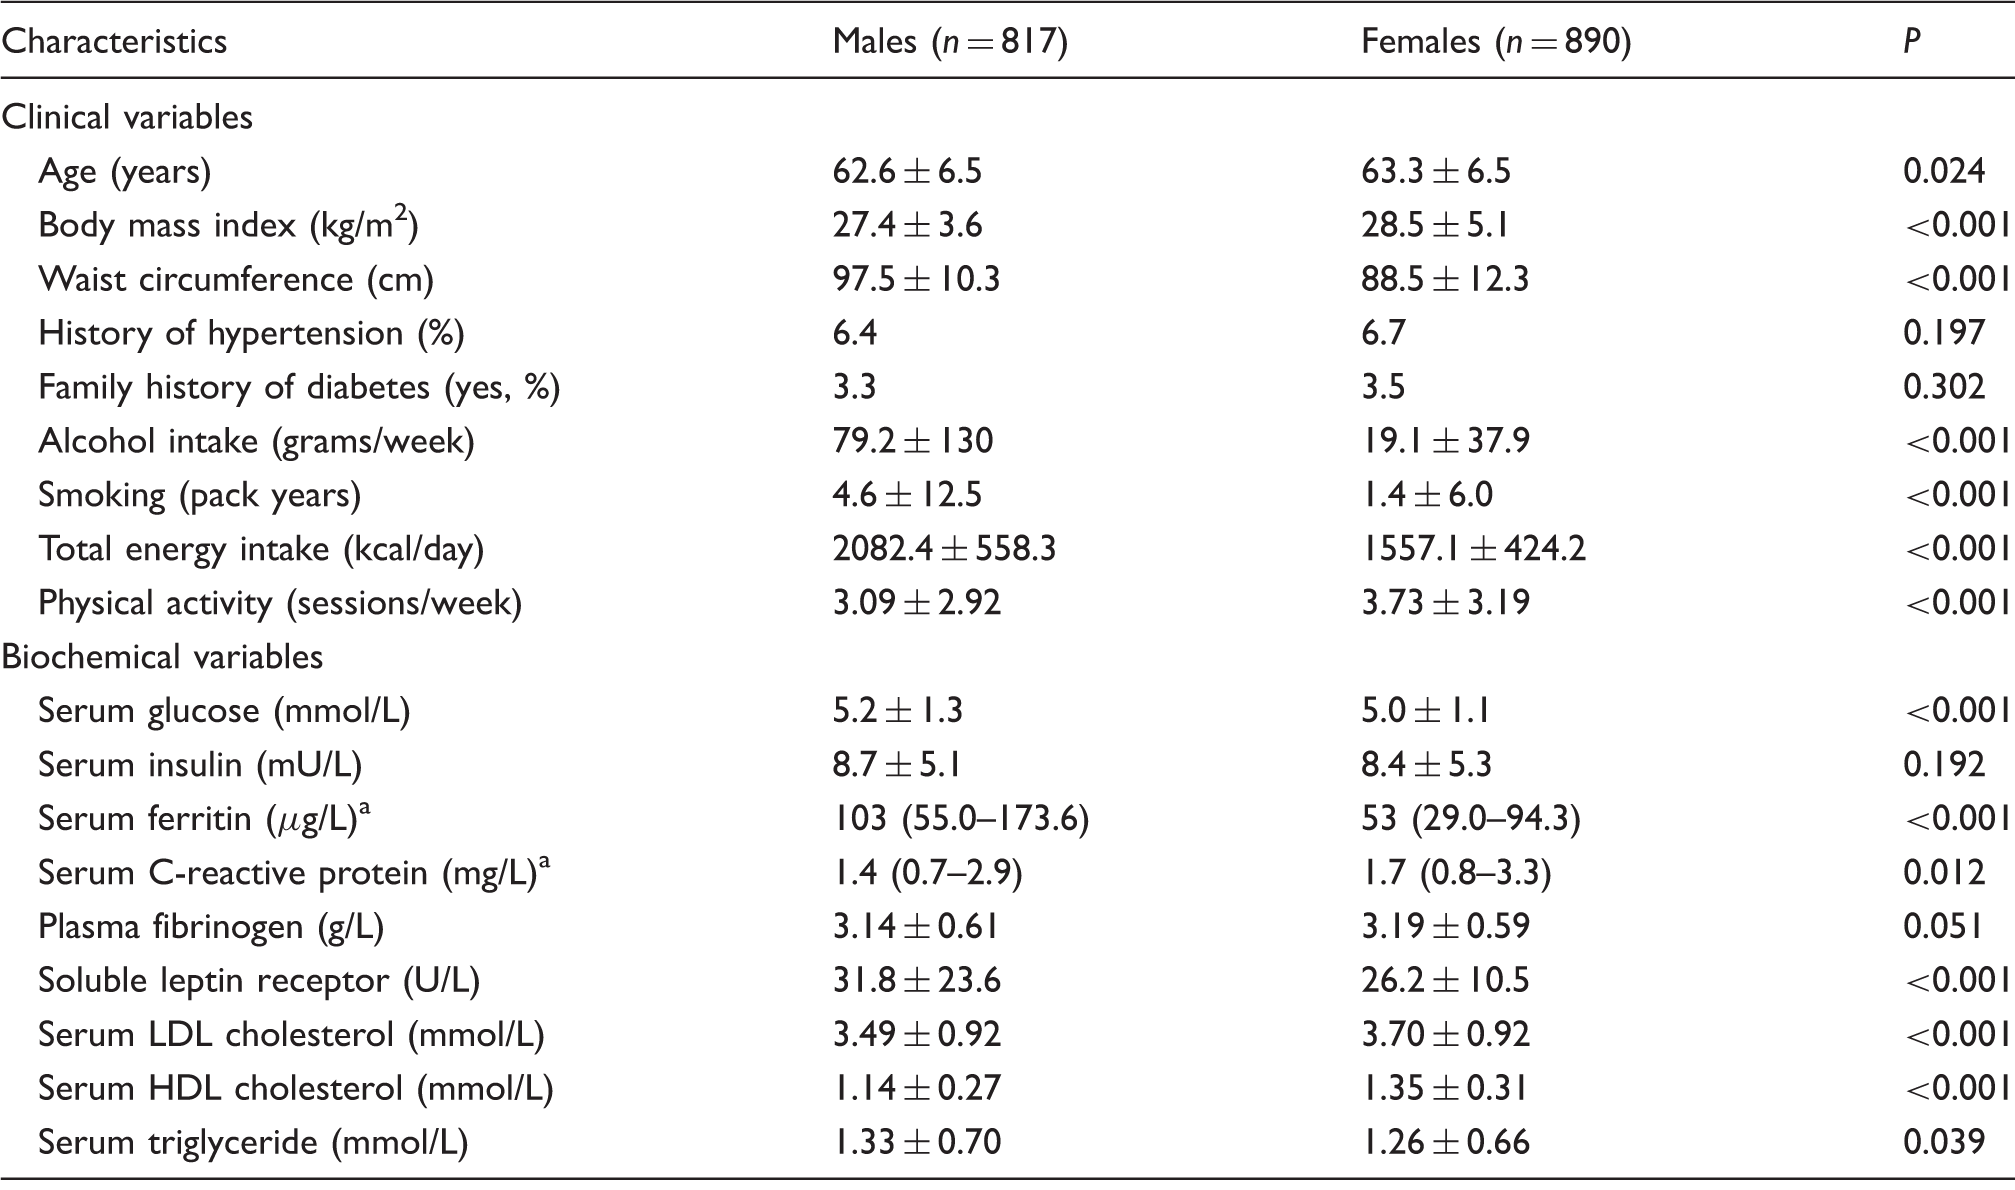
Note: Values are means ± SD. P-values were calculated by independent sample t-tests, Mann-Whitney U test and chi-square tests for categorical variables.
LDL: low-density lipoprotein; HDL: high-density lipoprotein.
median (interquartile range).
Association between gender and type 2 diabetes prevalence and incidence.
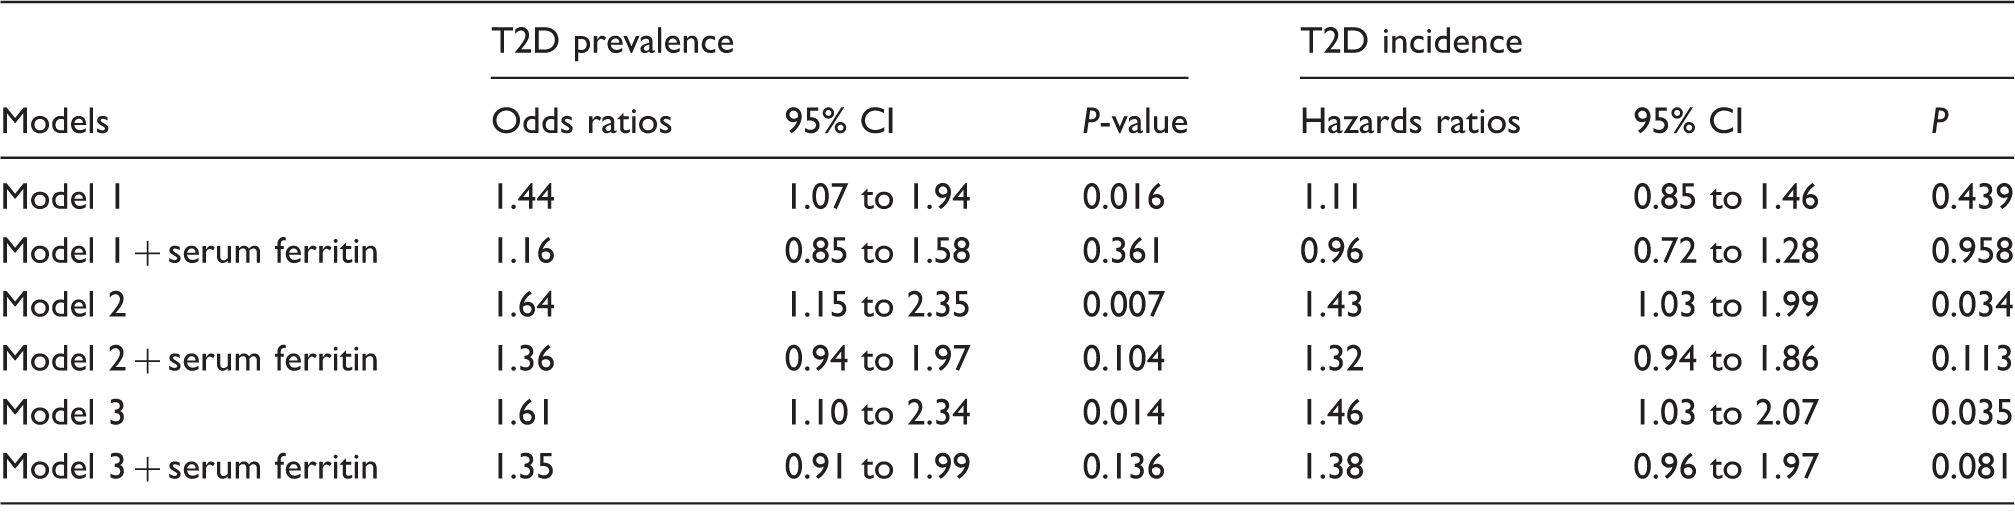
Note: Model 1 is adjusted for age and baseline examination year. Model 2 is adjusted for Model 1 plus body mass index, smoking, alcohol intake, leisure time physical activity and total energy intake. Model 3 is adjusted for Model 2 plus serum C-reactive protein, plasma fibrinogen, serum soluble leptin receptor, serum LDL/HDL-cholesterol ratio, serum triglyceride, hypertension, family history of diabetes and drug for dyslipidemia. Serum ferritin (100 µg/L) was log-transformed and treated as continuous variable.
CI: confidence interval.
Association between gender and fasting plasma glucose, fasting plasma insulin and homeostasis model assessment of insulin resistance.
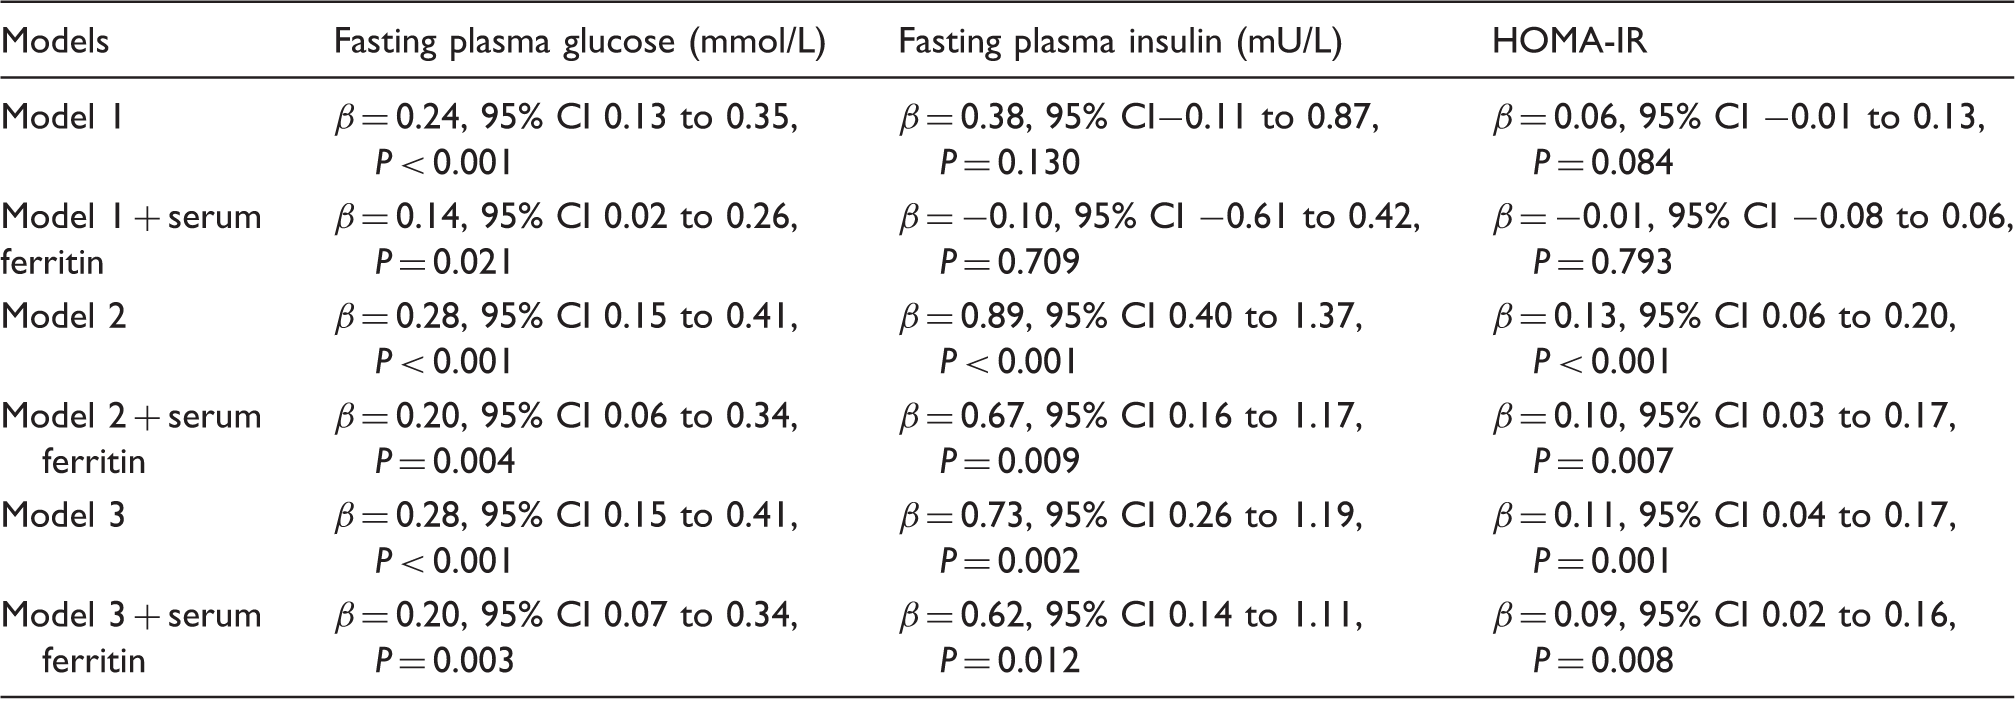
Note: Model 1 is adjusted for age and baseline examination year. Model 2 is adjusted for Model 1 plus body mass index, smoking, alcohol intake, leisure time physical activity and total energy intake. Model 3 is adjusted for Model 2 plus serum C-reactive protein, plasma fibrinogen, serum soluble leptin receptor, serum LDL/HDL-cholesterol ratio, serum triglyceride, hypertension, family history of diabetes and drug for dyslipidemia. Serum ferritin (100 µg/L) was log-transformed and treated as continuous variable.
: regression coefficients; CI: confidence interval; HOMA-IR: homeostasis model assessment of insulin resistance.
The associations were adjusted for known risk factors of T2D. Model 1 included age (years) and baseline examination years. Model 2 included variables in model 1 and modifiable clinical variables, i.e. BMI (kg/m2); smoking (pack years); alcohol intake (grams of absolute ethanol per week); total daily energy intake (kcal/day) and leisure-time physical activity (conditioning leisure-time sessions per week). Model 3 included variables in model 2 and other clinical variables as well as biochemical variables, i.e. history of hypertension (≥140/90 mmHg and/or use of hypertension medication [%]); medication for dyslipidaemia (%); family history of diabetes (%); serum C-reactive protein concentration (mg/L, high sensitivity method); plasma fibrinogen (g/L); serum soluble leptin receptor (U/L) serum low-density lipoprotein/high-density lipoprotein ratio and serum triglyceride concentrations (mmol/L). Missing values in covariates were less than 3% and were replaced with the cohort mean. Statistical analyses were performed with SPSS version 21 for Windows (Armonk, NY: IBM corporation), and all tests of statistical significance (P < 0.05) were two sided.
Results
The characteristics of the study participants by gender are as shown (Table 1). The mean age was 62.6 years (SD = 6.4), and the median sF concentration was 103.0 µg/L (IQR = 55.0–173.6) in males and 63.3 years (SD = 6.5) and 53.0 µg/L (IQR = 29.0–94.3) in females, respectively. Although baseline clinical and biochemical characteristics were similar between the genders, males had a higher total daily energy intake, less leisure-time physical activity, higher alcohol intake and they smoked more cigarettes (Table 1).
At baseline, a total of 201 participants had prevalent T2D, with a significantly higher T2D prevalence in males (111 cases [55.2%] vs. 90 cases [44.8%] in males and females, respectively; P = 0.032). The cross-sectional analysis showed a statistically significant association between gender and T2D in model 3, with a 61% higher odds of having T2D in males (Odds ratio [OR] = 1.61, 95% CI 1.10 to 2.34, P = 0.014). Introduction of body iron stores as assessed by sF into the model, significantly attenuated the association (OR = 1.35, 95% CI 0.91 to 1.99, P = 0.136, in model 3) (Table 2). Factors that remained statistically significant in association with T2D in the model 3 were age (OR per 1 year = 1.05, 95% CI 1.02 to 1.07, P = 0.001), BMI (OR per 1 kg/m2 = 1.07, 95% CI 1.03 to 1.11, P = 0.001), serum triglyceride concentration (mmol/L, OR = 1.76, 95% CI 1.41 to 2.20, P < 0.001), serum LDL/HDL ratio (OR = 0.83, 95% CI 0.70 to 0.98, P = 0.030), medication for dyslipidaemia (OR = 2.00, 95% CI 1.12 to 3.61, P = 0.020), family history of diabetes (OR = 2.41, 95% CI 1.76 to 3.29, P < 0.001), hypertension (OR = 1.77, 95% CI 1.19 to 2.64, P = 0.005) and log sF (OR per 100 µg/L = 2.17, 95% CI 1.42 to 3.30, P < 0.001).
In linear regression analysis with markers of glucose homeostasis, a statistically significant association was observed between gender and FPG after multivariable adjustments in model 3 (β = 0.28, 95% CI 0.15 to 0.41, P < 0.001). The association was again attenuated after the introduction of sF into the model (Table 3). Introduction of sF into the models with FPI and HOMA-IR showed a similar impact on the associations between gender and FPI and HOMA-IR (Table 3).
In the prospective analysis of 1506 people free of prevalent diabetes at baseline, a total of 207 incident T2D cases were observed during the mean follow-up of 7.3 years. In adjusted model 3, a statistically significant association was observed between gender and incident T2D (HR = 1.46, 95% CI 1.03 to 2.07, P = 0.035). The risk of developing T2D was attenuated with the introduction of sF into the models (Table 2). When males and females were examined separately, a statistically significant increased risk of developing T2D was observed in males in model 3 (HR = 1.52, 95% CI 1.19 to 1.95, P = 0.001), whereas an inverse association was observed among the females (HR = 0.66 95% CI 0.51 to 0.84, P = 0.001). We also examined the impact of excluding subjects with chronic liver/pancreatic disease and chronic kidney disease (n = 10) from the analysis which did not significantly attenuate the associations (Data not shown).
Discussion
This population-based cross-sectional and prospective study showed that there is a gender difference in T2D prevalence and incidence. Males had higher prevalence and increased risk of developing T2D. Body iron, as assessed by sF, explains about two-fifths and one-fifth of the gender difference observed in the prevalence and incidence of T2D, respectively (Table 2). In addition, gender difference was observed in glucose homeostasis with males having higher FPG, FPI and HOMA-IR. sF explains about one-fourth and one-fifth of the difference in FPG and markers of insulin resistance (FPI and HOMA-IR), respectively (Table 3).
In agreement with relatively recent studies6,7,28 that demonstrated gender difference in T2D prevalence with more cases among males, we also observed more cases of T2D in males (55.2%) than in females (44.8%). This male predominance was not only limited to T2D prevalence but was also observed in T2D incidence, in which we found a 46% increased risk of T2D in males in models adjusted for age and other factors. The development of T2D has been suggested to increase linearly with age, with more cases observed in the middle-aged and ageing periods,7,8 even in age-dependent T2D risk, the role of gender is clearly evident as demonstrated in our study. The influence of gender was particularly highlighted in the relatively large Inter Act Consortium study that cut across many European nations and which reported a 51% excess risk of T2D in males as compared with females in an age-adjusted model. 8 Likewise, in Lin et al. 7 , which investigated the annual trends of incidence of T2D among adults in Taiwan, a 20% increased risk of T2D in males compared with females was observed, thus, providing more evidence base for the male preponderance in the incidence of T2D.
The direction of the gender bias in T2D prevalence and incidence as suggested in our study, as with other previous studies,6–8,28 appeared to be in keeping with the known direction of gender influence on body iron stores.9,12,15–17 Body iron accumulation follows a divergent pattern between males and females, so that body iron stores increase in males and decrease in females from teenage years up till the age of menopause in females and the comparable age in males.9,15 During the middle-aged periods and particularly after menopause, iron accumulation slightly plateaus in males but increases markedly in females till the elderly aged periods, after which iron accumulation drops in both genders.9,15 Despite the steep rise in iron accumulation in females in postmenopausal ages, it is still below the total iron accumulation in males throughout life,16,17 which further strengthens the role of gender in iron accumulation. The similarities in the direction of gender influence on body iron accumulation and prevalence and incidence of T2D suggest that body iron stores may well explain to some extent the gender bias in T2D prevalence and incidence. We observed in our study, a significant attenuation in the association between gender and T2D when body iron, as assessed by sF, was introduced into the models (Table 2), which suggests that body iron to some extent explains the gender–T2D association. Of the previous studies that found a gender difference in the prevalence6,7,28 and incidence of T2D,7,8 none either investigated or reported iron as a possible explanation for the gender difference in T2D prevalence and incidence.
A study conducted in Glasgow, United Kingdom 29 suggested some explanations for the gender difference in insulin sensitivity – hallmark of T2D, but again, body iron was not reported. However, some of the factors identified in the study have being linked to body iron stores. A limited capacity for subcutaneous fat expansion in males as compared with females, 30 causing males to accumulate more fat in the viscera – liver, spleen and pancreas 31 and in the skeletal muscles was one of the factors reported. Likewise, these organs are known sites for body iron stores, which implies more oxidation of the accumulated fats leading to an increase in insulin resistance in males as compared with females. 31 Furthermore, a few studies2,3,32,33 had reported the effect of gender on insulin sensitivity among the adolescents in which difference in body iron accumulation by gender is known to be relatively marked. However, none of these studies attributed the gender difference in insulin sensitivity to the difference in body iron accumulation. Aldhoon-Hainerova et al. 3 in their study among the Czech adolescents suggested that there might be gender difference in insulin resistance. They found that obese boys had significantly higher insulin resistance as assessed by HOMA-IR than obese girls. 3 In keeping with their results, we also found a higher HOMA-IR in males after multivariable adjustments (Table 3). Our analysis on the gender difference in insulin resistance adds to the existing knowledge 31 by demonstrating that gender difference in insulin resistance is not restricted to the adolescents but also exists in the middle-aged and ageing population. Another factor identified in the Glasgow report was the differential circulating adiponectin concentrations by gender that is suggested to be lower in males. 29 Molecular studies have shown that iron supresses the transcription of adiponectin mRNA, 34 which leads to a reduction in adiponectin production and subsequent disturbance in insulin sensitivity. Hence, this further suggests that body iron perhaps could be the main determinant for a lower insulin sensitivity observed in middle-aged and ageing males as compared with females.
The disparity in body iron accumulation between males and females which may underlie the gender difference in T2D and glucose homeostasis in our study is supported by several suggested mechanisms. Higher body iron accumulation in males may cause more impairment to peripheral glucose uptake due to oxidative muscle damage. 35 Also body iron accumulation may cause greater derangement of glucose homeostasis in males than in females due to gender-related differences in visceral and subcutaneous fat distribution. Increased visceral white adipose tissue has been found to be associated with altered glucose homeostasis and it is reported that males store more lipids in it than in the subcutaneous white adipose tissue as is the case in females. 36 Thus, males may oxidize dietary fatty acids more readily than females. 36 This further suggests that a more accelerated production of free radicals may occur in males than in females since iron is a pro-oxidant catalyst. The end result is the decreased glucose uptake in the muscles which stimulates gluconeogenesis in the liver and increases insulin resistance.37,38 Other authors have suggested a mechanism mediated through an effect on sex hormone concentrations which might warrant further consideration. 39
Among the strengths of our study is the use of a randomly selected sample in a genetically and culturally homogenous ethnicity. It is known that body iron stores vary with ethnicity 15 and previous multiethnic studies have showed how ethnicity could impact on gender difference observed in insulin resistance 2 and T2D prevalence. 40 Some of the previous studies adjusted for ethnicity in their analysis, but the findings were still contradictory.2,33 Our study had no confounding due to ethnicity in the analyses of gender difference in HOMA-IR and T2D prevalence and incidence. The inclusion of only postmenopausal females from the same area as the males in our study provided to some extent an unbiased comparison in body iron accumulation between males and females. It also reduced the influence of hormonal differences between males and females on the analyses. The T2D cases in our cohort were not restricted to only self-report reporting of a previous T2D diagnosis and/or blood glucose measurements, but were further confirmed with record linkage to the hospital discharge register and reimbursement register of those people on medication for T2D, which further increased the sensitivity of T2D diagnosis in our study.
One of the limitations of this study is the relatively narrow age range of the study subjects. The difference in body iron accumulation between males and females is known to be marked during the premenopausal period in females and the comparable age in males. 15 The inclusion of this younger age group could have increased the contribution of body iron to the gender difference observed in our analysis. The parallel increase in body iron and low-density lipoprotein in postmenopausal period may confound gender–T2D association in females; 41 however, we extensively adjusted our analysis for the serum lipids, i.e. low-density lipoprotein, high-density lipoprotein and triglycerides. We are also aware that there could be a selection bias in the prevalence of T2D observed in the cross-sectional analysis; however, we performed a prospective analysis to further strengthen the gender difference observed in T2D prevalence. Also, our primary claim is not to reiterate the gender difference in T2D prevalence and incidence as it has been reported earlier,6–8,28 but, that in such a difference, body iron accumulation has a role. The use of sF as a marker of iron accumulation has been questioned by some authors because of its variation with inflammation and for its role as a marker of insulin resistance; hence reverse causality cannot be completely ruled out. 13
In conclusion, our data suggest that there is a gender difference in the prevalence and incidence of T2D, with a higher prevalence, and increased risk of T2D observed in males. Body iron accumulation, as assessed by sF, explains about two-fifths and one-fifth of the gender difference observed in T2D prevalence and incidence, respectively. Larger prospective cohort studies are needed to further confirm the extent of contribution of body iron to the gender dimorphism in T2D.
Footnotes
Acknowledgements
The authors express their gratitude to the staff of Research Unit of Public Health for data collection.
Declaration of conflicting interests
The author(s) declared no potential conflicts of interest with respect to the research, authorship, and/or publication of this article.
Funding
This study was funded by the University of Eastern Finland and Juho Vainio Foundation Research Grant #201510337 to AA.
Ethical approval
The KIHD study was approved by the Research Ethics Committee of the Kuopio University Hospital with approval number 143/97.
Guarantor
T-PT.
Contributorship
AA and T-PT were involved in conception and design of this study. T-PT, SV and JKV were involved in the acquisition of data. AA, T-PT and JKV performed the statistical analysis and interpretations. All authors contributed to and edited the final version of the manuscript.