
Abstract
Type 2 diabetes mellitus (T2DM) is associated with insulin resistance-induced lipid and glucose metabolism disorder. The study was aimed to explore the potential functional role of microRNA (miR)-27b-3p in T2DM, as well as underlying mechanisms. An insulin resistance cell model was induced in HepG2 cells and then expression of miR-27b-3p and receptor tyrosine kinase-like orphan receptor 1 (ROR1) was analyzed. The expression of miR-27b-3p was overexpressed or silenced, and the relationship between ROR1 and miR-27b-3p was investigated. Thereafter, the effects of miR-27b-3p on percentage of glucose uptake, fatty acid oxidation and cell cycle were analyzed. The expressions of miR-27b-3p were significantly increased, while the ROR1 levels were statistically decreased in the cells of the model group. Overexpression of miR-27b-3p dramatically decreased the levels of ROR1 and the percentage of glucose uptake, but had no effects on fatty acid oxidation. ROR1 was a target of miR-27b-3p. Moreover, overexpression of miR-27b-3p could remarkably highlight the percentages of cells at G0/G1 phase, but decreased the percentages of cells at S phase. In conclusion, our results suggest that miR-27b-3p regulates the function and metabolism of insulin resistance cells by inhibiting ROR1. miR-27b-3p might be a potential drug target in treating T2DM.
Keywords
Introduction
Type 2 diabetes mellitus (T2DM) is a complex, multisystem, metabolic disease, which is characterized by hyperglycemia resulting from deficiencies in insulin secretion, target-cell resistance to the activity of insulin (insulin resistance), or both. The prevalence of T2DM has been rapidly growing due to population aging, urbanization, and lifestyle changes. T2DM has been demonstrated to be associated with adiposity, hypertension, platelet hyperreactivity, and dyslipidemia, increasing the risk of macrovascular and microvascular injuries. 1 Patients with T2DM may develop into multiple organ damage and are at high risk for early mortality. 2 It has been well acknowledged that abnormalities in lipid and glucose metabolism induced by insulin resistance are two main characteristics of T2DM. 3 Therefore, it is necessary to explore the molecule mechanism underlying hypoglycemic and/or hypolipidemic effects to treat T2DM.
Receptor tyrosine kinase-like orphan receptor (ROR) 1 belongs to the receptor tyrosine kinase family. ROR1 coding gene is localized to chromosomes 1p31-32 and encodes 937 amino acids. In recent years, it has been reported that ROR1 is involved in the development of various organs and tissues during embryonic organogenesis, as well as in tumorigenesis. 4 In addition, the critical role of ROR1 in adipogenesis and glucose homeostasis in 3T3-L1 cells has been revealed. 5 Thus, we assumed that ROR1 might be responsible for the lipid and glucose metabolism induced by insulin resistance.
MicroRNAs (miRs) are highly conserved endogenous small regulatory non-coding ribonucleic acids (RNAs). miRs are known to negatively regulate gene expression by preventing translation and/or stimulating messenger RNA (mRNA) degradation by base pairing to the 3′ untranslated region (3′-UTR) of the target genes. An increasing number of studies have suggested that miRs are associated with different human diseases including T2DM,6,7 and a variety of miRs have been identified as the important regulators of lipid and glucose metabolism. Recently, a previous study suggested that miR-27b-3p was highly expressed in human islets. 8 In addition, miR-27b-3p could regulate the expression of ROR1 in gastric cancer (GC) cells. 9 However, little information is available regarding whether miR-27b-3p regulates the lipid and glucose metabolism by regulating expression of ROR1.
Therefore, in this study, we aimed to explore the functional role of miR-27b-3p in lipid and glucose metabolism in T2DM, as well as the underlying mechanisms. Our study might provide a new insight into a potential novel target treatment of T2DM.
Materials and methods
Cell culture
Human hepatoma HepG2 cells were obtained from Cell bank of Chinese Academy of Sciences (Shanghai, China). The cells were grown in high-glucose Dulbecco’s modified Eagle’s medium (DMEM; Sigma-Aldrich, St. Louis, MO, USA) containing 10% (v/v) fetal bovine serum (FBS; Gibco, Grand Island, NY, USA), 100 units/mL penicillin (Gibco), 100 μg/mL streptomycin (Gibco), and 1%
Insulin resistance cell model
An insulin resistance cell model was induced in HepG2 cells as previously described. Briefly, HepG2 cells were seeded on six-well plates at 3 × 10⁵ cells/well and serum-starved for 24 h. The cells were maintained in serum-free DMEM containing either normal (5.5 mM, control group) or high (30 mM, model group) glucose concentration of
Cell transfection
Mature miR-27b-3p mimics, inhibitor, and negative control (miR-NC) were designed and synthesized by GenePharma (Shanghai, China). For transient transfection, the cells were seeded on six-well plates at 5 × 10⁵ cells/per well and then were transiently transfected with 50-nM miR-27b-3p mimics or 150-nM miR-27b-3p inhibitor. Cell transfections were carried out using Lipofectamine 3000 Reagent (Invitrogen, Carlsbad, CA, USA) following the manufacturer’s instructions.
Quantitative real-time polymerase chain reaction
Total RNA was extracted from the cells using the TRIzol reagent (Invitrogen) according to the manufacturer’s protocol. Complementary DNA (cDNA) was synthesized with the PrimeScript RT reagent Kit (TaKaRa, Dalian, China). Specific primers were designed by GenePharma. Real-time polymerase chain reaction (PCR) was performed on a 7500 Real-time PCR System (Applied Biosystems, Foster City, CA, USA) using SYBR Premix Ex Taq Kit (TaKaRa). The following primers were used: hsa-miR-27b-3p, forward: 5′-GGCGT GTTCA CAGTG GCTAA G-3′, reverse: 5′-GTCGT ATCCA GTGCA GGGTC CGAGG TATTC GCACT GGATA CGACG CAGAA-3′; U6 forward: 5′-C TCGCT TCGGC AGCAC A-3′, reverse: 5′-AACGC TTCAC GAATT TGCGT-3′; ROR1, forward: 5′-CAGTC AGTGC TGAAT TAGTG CC-3′, reverse: 5′-TCATC GAGGG TCAGG TAAGA AT-3′; glyceraldehyde 3-phosphate dehydrogenase (GAPDH), forward: 5′-CCCAT GTTCG TCATG GGT GT-3′, reverse: 5′-TGGTC ATGAG TCCTT CCACG ATA-3′. All procedures were done independently in triplicate. The small nuclear RNA (snRNA) U6 and GAPDH were considered as an endogenous reference to calculate the relative expression levels of miR-27b-3p and ROR1 mRNA, respectively, using the 2-ΔΔCt method. All experiments were done independently in triplicate.
Luciferase reporter assay
Fragments of human ROR1 3′-UTR containing miR-27b-3p binding site were cloned into pmirGLO Dual-luciferase miRNA Target Expression Vector (Promega, Madison, WI, USA), and the recombined plasmid was referred to as ROR1-WT. Mutation at the binding site generated mutant ROR1-WT plasmid, which was referred to as ROR1-MUT. The vectors (ROR1-WT or ROR1-MUT) and miR-27b-3p mimics or miR-NC were then co-transfected into 293T cells, and luciferase activity was tested using Dual-Luciferase Reporter Assay System (Promega).
HepG2 glucose uptake test
After stimulation with insulin for 24 h and transfection with miR-27b-3p mimics or miR-27b-3p inhibitor, HepG2 cells were subsequently washed in serum-free (once), high-glucose DMEM (once), and in phosphate-buffered saline (PBS) (twice). The concentration of glucose in the culture medium was assessed by the glucose oxidase–peroxidase method using the glucose assay kit (Cayman Chemicals, Burlington, ON, Canada) as previously described. 10
Fatty acid oxidation
After stimulation with insulin for 24 h and transfection with miR-27b-3p mimics or miR-27b-3p inhibitor, HepG2 cells were seeded in 24-well plates (2.5 × 10⁵ cells/well) for 24 h. Afterward, the cells were loaded with free fatty acids (100-μM palmitic acid and 100-μM oleic acid) supplemented with 0.5% bovine serum albumin (BSA, Sigma-Aldrich) for another 24 h. The medium was then removed to a sealed container and the amount of l4CO2 was measured using a liquid scintillation counter.
Cell cycle analysis
For cell cycle analysis, HepG2 cells were stimulated with insulin, transfected with miR-27b-3p mimics or miR-27b-3p inhibitor, and cultured for 48 h. Subsequently, the cells were fixed with 70% ethanol at 4°C. After washing, the fixed cells were incubated in PBS containing propidium iodide (PI; 20 μg/mL; BD Biosciences, Bedford, MA, USA), RNase A (200 μg/mL), and Triton X-100 (0.1%) at 37°C for 20 min. The cell cycle distribution was analyzed with a flow cytometer (FACSArray Bioanalyzer, BD Biosciences).
Statistical analysis
Each experiment was done in triplicate. The numerical values are expressed as the mean ± standard deviation (SD) or the median with minimum and maximum. Statistical analyses were conducted using GraphPad statistical software (GraphPad Software, La Jolla, CA, USA). A Student’s two-tailed unpaired t-test was applied to analyze statistical difference between groups. A P < 0.05 was considered statistically significant.
Results
Expression levels of miR-27b-3p and ROR1 in insulin resistance cell model
To investigate the potential functional role of miR-27b-3p and ROR1 in T2DM, we measured the expression levels of miR-27b-3p and ROR1 in insulin resistance cell model using quantitative real-time polymerase chain reaction (qRT-PCR). The results showed that the expression levels of miR-27b-3p were significantly increased compared to the control group (P < 0.05, Figure 1(a)), while the levels of ROR1 were statistically decreased compared to the control group (P < 0.05, Figure 1(b)). The results indicated that miR-27b-3p and ROR1 might play significant roles in the function and metabolism of T2DM.

Expression levels of miR-27b-3p and ROR1 in insulin resistance cell model: (a) levels of miR-27b-3p in insulin resistance cell model and (b) levels of miR-27b-3p in insulin resistance cell model. Data are presented as the mean + SD.
Effects of abnormal expression of miR-27b-3p on ROR1 level
To further explore the potential relationship between miR-27b-3p and ROR1, the HepG2 cells were transfected with miR-27b-3p mimics or miR-27b-3p inhibitor. The transfection efficiency was analyzed by qRT-PCR. As shown in Figure 2(a), the results revealed that the expression levels of miR-27b-3p were significantly elevated by miR-27b-3p mimics, but reduced by miR-27b-3p inhibitor (both P < 0.05), indicating the transfection efficiency was high and those miRs could be used for further studies. After transfection, the expression levels of ROR1 were also analyzed by qRT-PCR. The results demonstrated that the levels of ROR1 were prominently lowered by miR-27b-3p overexpression, but raised by miR-27b-3p inhibition (both P < 0.05, Figure 2(b)), implying that ROR1 was negatively regulated by miR-27b-3p. Results in Figure 2(c) showed miR-27b-3p mimics could significantly reduce luciferase activity of cells transfected with ROR1-WT (P < 0.05). However, effects of miR-27b-3p on luciferase activity of cells transfected with ROR1-MUT were non-significant. Results indicated that ROR1 might be a target of miR-27b-3p.

Effects of abnormal expression of miR-27b-3p on ROR1 level: (a) the transfection efficiency of miR-27b-3p mimics and miR-27b-3p inhibitor, (b) the expression levels of ROR1 after transfection, and (c) the luciferase activity after co-transfection. Data are presented as the mean + SD.
Effects of abnormal expression of miR-27b-3p on lipid and glucose metabolism
We further investigated the role of miR-27b-3p in lipid and glucose metabolism. After transfection, the percentage of glucose uptake and fatty acid oxidation were measured. As demonstrated in Figure 3(a), the percentage of glucose uptake was significantly decreased by overexpression of miR-27b-3p but increased by downregulation of miR-27b-3p (both P < 0.05). However, abnormal expression of miR-27b-3p had no effects on fatty acid oxidation (Figure 3(b)). The results indicated that miR-27b-3p regulated the glucose metabolism, but not the lipid metabolism.
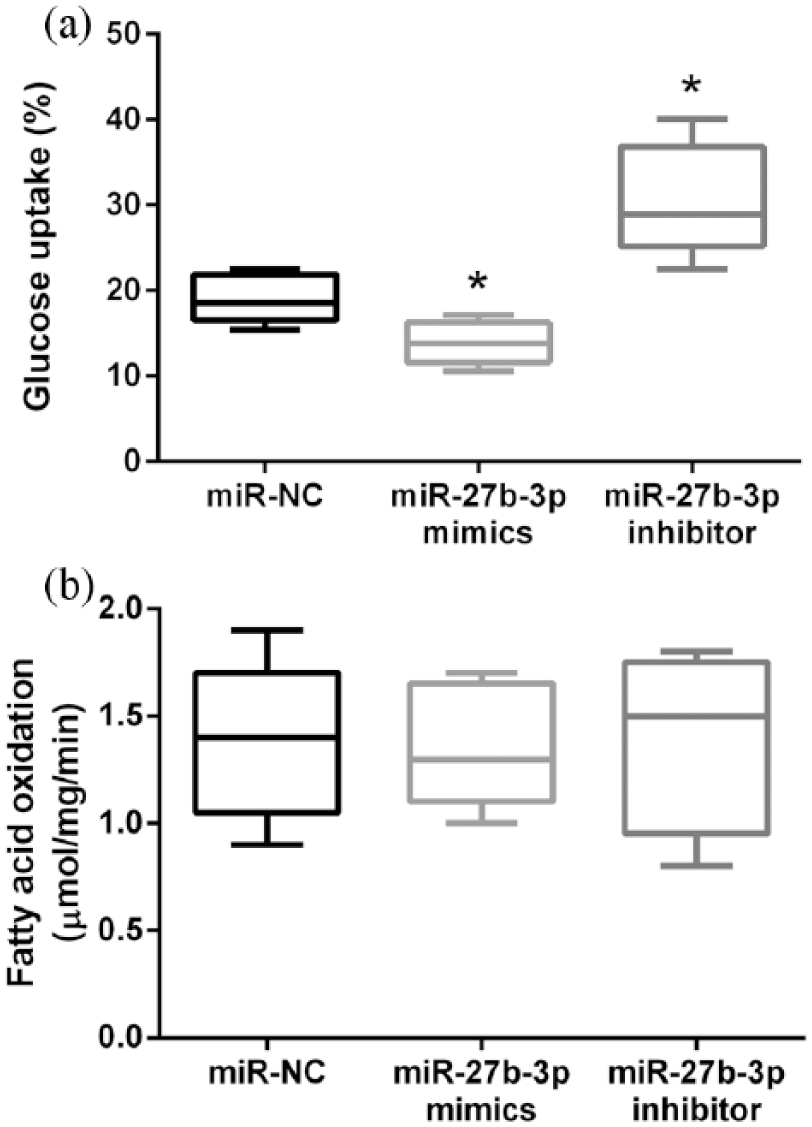
Effects of abnormal expression of miR-27b-3p on lipid and glucose metabolism: (a) the percentage of glucose uptake after transfection and (b) the fatty acid oxidation after transfection. Data are presented as the median. Error bars indicated minimum and maximum.
Effects of abnormal expression of miR-27b-3p on cell cycle
After transfection, the cell cycle was analyzed by flow cytometer. The results showed that overexpression of miR-27b-3p caused a significant increase in the percentage of G0/G1 phase cells and a dramatic decrease in the percentage of S phase cells (both P < 0.001). In contrast, downregulation of miR-27b-3p induced a lower percentage of G0/G1 phase cells (P < 0.01) and a higher percentage of S phase cells (P < 0.05). The results indicated that miR-27b-3p could induce cell arrest at G0/G1 phase (Figure 4).
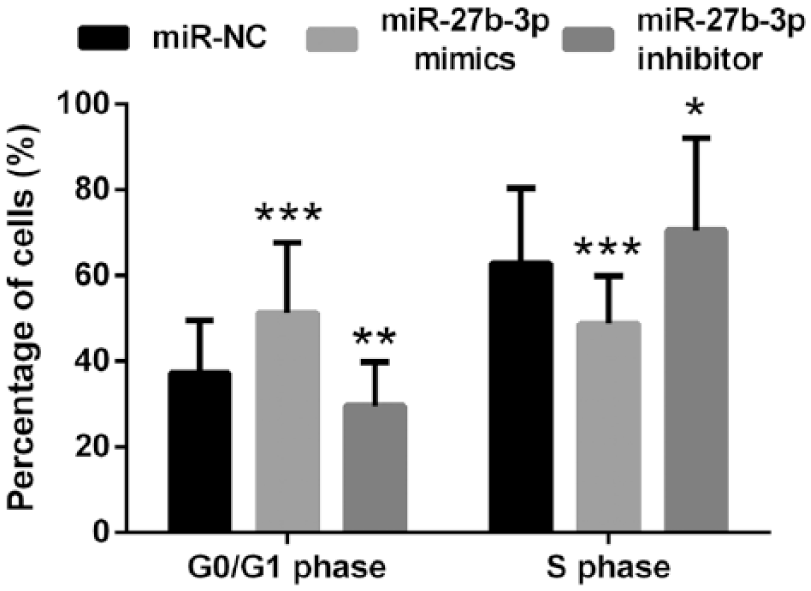
Effects of abnormal expression of miR-27b-3p on cell cycle. Data are presented as the mean + SD.
Discussion
In this study, we explored the potential functional role of miR-27b-3p in T2DM together with underlying mechanisms. The results indicated that in the insulin resistance cell model, the expressions of miR-27b-3p were significantly elevated, while the ROR1 levels were statistically lowered. miR-27b-3p negatively regulated the levels of ROR1. Overexpression of miR-27b-3p decreased the percentage of glucose uptake, but had no effects on fatty acid oxidation. In addition, we observed that miR-27b-3p could induce cell arrest at G0/G1 phase. These results revealed that miR-27b-3p might play a potential significant role in treating T2DM.
Recently, a growing number of evidence demonstrates that the aberrant miRs expression is involved in the pathology of T2DM and its related complications,11,12 and it also has been known that miRs play significant roles in regulating various cellular processes including lipid and glucose metabolism. Therefore, it is important to explore the mechanism by which miR regulating lipid and glucose metabolism, which might provide new insight into treating T2DM. The functional roles of miR-27b in many human diseases have been well studied. For example, it has been reported that miR-27b is responsible for atherosclerosis obliterans, cardiac hypertrophy, osteoarthritis, and tumorigenesis. In addition, previous studies suggested that miR-27b might control lipid metabolism and influence adipocyte differentiation and was highly expressed in human islets. 8 Moreover, Tao et al. 9 found that miR-27b-3p suppressed the cell proliferation in GC through suppression of oncogene ROR1 expression. We, therefore, inferred that miR-27b-3p might also be involved in glucose and lipid metabolism disorder induced by insulin resistance by regulating the expression of ROR1.
To confirm the assumption, we induced insulin resistance cell model using human hepatoma HepG2 cells. Thereafter, the expressions of miR-27b-3p and ROR1 were measured. In line with the previous study, 9 our results also revealed that miR-27b-3p was highly expressed in insulin resistance cells, with a decrease in ROR1 expression. To further investigate the functional role of miR-27b-3p and the potential associations between miR-27b-3p and ROR1, the expression patterns of miR-27b-3p were changed by transfection with mimics or inhibitor. The levels of ROR1 were analyzed after transfection. ROR1 is one member of the RORs family, which includes ROR1 and ROR2. RORs comprise one transmembrane domain and two distinct extracellular cysteine-rich domains. ROR1 has been shown a critical role in modulating neurite growth in the central nervous system and metastasis of cancer cells. 13 ROR1 has recently been found to be involved in adipogenesis and glucose uptake. As indicated in our results, we observed that ROR1 was negatively regulated by miR-27b-3p. According to a previous study, 9 the binding between miR-27b-3p and the 3′-UTR of ROR1 should be a possible reason for the negative correlation between miR-27b-3p and ROR1 expression. The following luciferase reporter assay verified the assumption. We further explored the effects of abnormal expression of miR-27b-3p on the glucose and lipid metabolism. The data suggested that overexpression of miR-27b-3p decreased the percentages of glucose intake, while suppression of miR-27b-3p elevated the amount of glucose intake. Although previous studies suggested that miR-27b played significant roles in adipocyte differentiation, 14 our results revealed that either overexpression or suppression of miR-27b-3p had no effects on the fatty acid oxidation. Our data indicated that decrease in the miR-27b-3p level might protect against insulin resistance in T2DM by regulating glucose metabolism, but not lipid metabolism. Furthermore, the effects of miR-27b-3p abnormal expression on cell cycle were explored. We found that overexpression of miR-27b-3p promoted phase transition of HepG2 cells into G0/G1 phase, while suppression of miR-27b-3p elevated the percentage of S phase cells. Thus, miR-27b-3p might contribute to the alterations of proliferation and apoptosis in insulin resistance-induced cells. However, further studies should be performed to confirm the results.
Based on these results, we suggested that miR-27b-3p might be responsible for the insulin resistance and T2DM by regulating the expression of ROR1.
Footnotes
Declaration of conflicting interests
The author(s) declared no potential conflicts of interest with respect to the research, authorship, and/or publication of this article.
Funding
The author(s) received no financial support for the research, authorship, and/or publication of this article.