
Abstract
Background
Detection of alcohol consumption in clients undergoing treatment for alcohol dependence can be difficult. The ethanol metabolites ethyl glucuronide and ethyl sulphate are detectable for longer in urine than either breath ethanol or urine ethanol. Our aim was to develop a liquid chromatography-tandem mass spectrometry method for urine ethyl glucuronide and ethyl sulphate for use in a routine clinical laboratory and define clinical cut-offs in a large population who had not consumed alcohol for at least two weeks.
Methods
Urine samples were diluted in 0.05% formic acid in HPLC grade water and then directly injected onto a Waters Acquity ultra high performance liquid chromatography coupled to a Waters TQ Detector. Eighty participants were recruited who had not consumed alcohol for at least two weeks to define cut-offs for urine ethyl glucuronide and ethyl sulphate. Samples and alcohol diaries were also collected from 12 alcohol-dependent clients attending a treatment programme.
Results
The assay was validated with a lower limit of quantitation of 0.20 mg/L for ethyl glucuronide and 0.04 mg/L for ethyl sulphate. Accuracy, precision, linearity and recovery were acceptable. Cut-offs were established for ethyl glucuronide, ethyl sulphate and ethyl sulphate/creatinine ratio (≤0.26 mg/L, ≤0.22 mg/L and ≤0.033 mg/mmol, respectively) in a non-drinking population. The validated cut-offs correctly identified clients in alcohol treatment who were continuing to drink alcohol.
Conclusions
A simple liquid chromatography-tandem mass spectrometry method for urine ethyl glucuronide and ethyl sulphate has been validated and cut-offs defined using 80 participants who had not consumed alcohol for at least two weeks. This is the largest study to date to define cut-offs for ethyl glucuronide, ethyl sulphate and ethyl sulphate/creatinine ratio.
Introduction
Following the ingestion of ethanol, over 95% is metabolized in the liver by alcohol dehydrogenase to acetaldehyde then by aldehyde dehydrogenase to acetic acid. 1 Less than 5% is excreted unchanged in the urine, breath and sweat. A small amount of ethanol is conjugated to form ethyl glucuronide (EtG) and ethyl sulphate (EtS). The significance of this metabolic pathway is the ability to detect these markers in urine for many hours after ethanol itself becomes undetectable, therefore increasing the time window of detection of alcohol ingestion. A breath ethanol test is usually only positive if there has been very recent alcohol consumption (4–6 h), and the detection time window depends on the amount of alcohol consumed.2,3 Ethanol can be detected in urine for a longer time period than in the breath or in blood, but only up to 12 h following alcohol consumption depending on the amount of ethanol consumed.4,5 In comparison, EtG and EtS remain detectable in urine for up to 24 h after a single dose of ethanol and for up to 130 h in patients admitted for alcohol detoxification. 6
In the UK, only 38% of clients successfully completed treatment for alcohol dependence in 2013/14. 7 Monitoring these clients is difficult and relies largely on self-reporting via alcohol diaries and breath ethanol measurements, both of which can be unreliable.
Studies that recruited clients in alcohol treatment programmes have demonstrated the benefit of measuring urine EtG and EtS to identify clients who claim that they are abstaining from alcohol but are still continuing to drink.8,9 If these tests are to be used routinely to detect alcohol use in clients participating in alcohol treatment programmes, it is important that the cut-offs used are well defined. With poorly defined cut-offs, there is a risk of low-positive EtG results in urine samples with bacterial contamination and glycosuria 10 and a risk of low-positive EtG and EtS results after the use of ethanol-based mouthwash or hand gels and after the consumption of non-alcoholic beers that contain trace amounts of ethanol.11–13 Similar to urine drugs of abuse testing, there is a risk of false-negative results if the client has consumed a large amount of water prior to providing a urine sample so reporting EtG and EtS results as creatinine ratios may be beneficial. 5
Solid phase extraction followed by liquid chromatography-tandem mass spectrometry (LC-MS/MS) has been proposed as the reference method for EtG and EtS. 14 Previously published studies using LC-MS/MS to measure urine EtG and EtS have not attempted to clearly define cut-offs for these tests. EtG and EtS have been measured in small numbers of non-drinkers and the lower limit of detection (LOD) or lower limit of quantitation (LLOQ) has often been used as the cut-off. Other studies have reported LODs of 0.003–0.052 mg/L for EtG and 0.025–0.05 mg/L for EtS using LC-MS/MS. LLOQs between 0.05 and 0.15 mg/L have been reported for both EtG and EtS.5,14–18 Stephanson et al. 15 demonstrated that EtG was undetectable (LLOQ: 0.10 mg/L) in 10 healthy subjects who had abstained from alcohol for 10 days. In another study, EtS was not detected (LOD: 0.05 mg/L) in urine collected from nine subjects who had abstained from alcohol for at least 48 h. 5 Hoiseth et al. 19 collected urine samples from 10 healthy subjects who had abstained from alcohol for seven days prior to a controlled drinking experiment. In 9/10 urines, EtG and EtS were undetectable (same method as used by Stephanson et al. 15 ). However, the EtG was 0.19 mg/L and the EtS was 0.33 mg/L in one urine sample. This subject reported abstinence in the previous seven days, but admitted to consuming a large amount of alcohol eight days before sample collection. 19 Due to the risk of false-positive EtG results, Bottcher et al. 20 proposed a clinical cut-off of 0.50 mg/L for EtG and 0.10 mg/L for EtS to determine if a subject has recently consumed alcohol. These clinical cut-offs have been adopted in subsequent studies.9,21 However, the proposed cut-offs for EtG and EtS have not been validated in a large non-drinking population. Studies have used small numbers of subjects (n < 10) and have usually been performed prior to a controlled drinking experiment.
An enzyme immunoassay method for EtG is also available and has been shown to compare well to LC-MS/MS. 20 However, as with any immunoassay, there are concerns about cross-reactivity with other metabolites in a urine sample. Mass spectrometry methods are more specific and allow the simultaneous measurement of both EtG and EtS. In the UK, only a small number of laboratories are routinely measuring urine EtG and EtS. Currently, there are up to 12 participants returning results for EtG on the LGC Standards Proficiency Testing Scheme (Bury, UK) for Drugs of Abuse in Urine. Less than 20% of those participants are using LC-MS/MS.
The aim of this study was to develop a LC-MS/MS method for urine EtG and EtS to be used in a routine clinical laboratory and to validate the cut-offs in a non-drinking population. We report the validation of this method and the determination of cut-offs to support the use of these tests in clients in community alcohol treatment.
Materials and methods
Standards and reagents
High performance liquid chromatography (HPLC) grade acetonitrile, methanol and water were purchased from VWR (Leicestershire, UK). EtG (1 mg/mL in methanol), EtG-d5 (1 mg/mL in methanol), EtS (sodium salt) and EtS-d5 (sodium salt) were purchased from LGC Standards (Middlesex, UK). The sodium salts were combined with HPLC grade methanol to make stock solutions of 3 mg/mL EtS in methanol and 4 mg/mL EtS-d5 in methanol.
The eight calibrators were prepared in phosphate-buffered saline (PBS) pH 7.4 using the EtG and EtS standards (concentration range: 0.10–100 mg/L and 0.05–50 mg/L respectively). The deuterated standards were combined with deionized water to create an internal standard solution containing 30 mg/L EtG-d5 and 15 mg/L EtS-d5. Quality control (QC) levels 2, 3 and 4 were prepared using the standards and urine from a recruited participant to have EtG concentrations of 0.8, 5 and 40 mg/L and EtS concentrations of 0.2, 5 and 10 mg/L. QC Level 1 (EtG 0.25 mg/L and EtS 0.08 mg/L) was prepared in PBS. All the calibrators, controls and deuterated standards were stored frozen at −20℃.
Study participants
Urine samples were obtained from attendees at the Blood Test Clinic in the Royal Preston Hospital who stated that they had not consumed alcohol for at least two weeks. Eighty-one participants were recruited (42 females, mean age 53 years). In addition, urine samples were obtained from alcohol-dependent clients attending weekly community alcohol treatment programmes in Lancashire. Fourteen urine samples were collected from 12 clients (two females, mean age 47 years). Participants provided a record of alcohol intake in the previous seven days. Six participants recorded no alcohol intake (n = 7 samples) and six participants recorded alcohol intake of up to 215 units (n = 7 samples). The study was approved by the NRES Committee North West (Preston) in August 2013 (REC Reference 13/NW/0551), Lancashire Teaching Hospitals NHS Foundation Trust and Greater Manchester West Mental Health NHS Foundation Trust. All participants provided written informed consent.
Sample preparation
Participant urine samples were stored at −20℃ prior to analysis. Urine samples and QCs were centrifuged at 2200 rpm for 10 min prior to analysis. Fifty microlitres of urine sample, QC and calibrators were added to 940 μL mobile phase A (0.05% formic acid in HPLC grade water) and 10 μL internal standard solution in 5 mL glass tubes. All were vortex mixed for 30 s, then transferred to a 2 mL square well in a polypropylene 96-well plate for analysis.
Ultra high performance liquid chromatography (UPLC)
Chromatography was performed on an Acquity ultra high performance liquid chromatography (UPLC) system with a high strength silica (HSS) C18, 1.8 μm, 2.1 × 150 mm column (both Waters, Manchester, UK). Mobile Phase A consisted of 0.05% formic acid in HPLC grade water, and Mobile Phase B was HPLC grade acetonitrile. A flow rate of 0.4 mL/min was maintained for the run time of 4.75 min. The injection volume from the autosampler was 10 μL. The mobile phase gradient changed from 1% B to 10% B over the first 2 min then 10% B to 100% B from 2 min to 2.5 min. The flow was diverted to waste for the first 0.5 min and then again after 3 min.
Mass spectrometry
Mass spectrometry detection was performed using a TQ detector (Waters, Manchester, UK) in the negative electrospray ionization mode. The source temperature was 150℃, desolvation temperature 450℃, cone gas flow 0.15 mL/min, capillary voltage 2.50 kV and desolvation gas flow 800 L/h. Transitions for EtG and EtS were chosen by tuning the instrument with 1 mg/L solutions of the standards and deuterated standards in mobile phase A. The cone voltage and collision energy were optimized for each transition. Analysis was performed by multiple reaction monitoring, and data were processed using MassLynx v4.1 with TargetLynx (Waters).
Method validation
To assess matrix effects, three recruited participant urine samples were prepared and analysed using the standard method described. At the same time, a standard containing 1 mg/L EtG and 1 mg/L EtS was infused into the MS/MS at a constant flow rate of 20 µL/min. The transitions were monitored to check for any suppression or enhancement at the retention times for EtG and EtS.
The LOD was determined by analysing PBS 10 times then calculating the mean + 1.65 standard deviations. 22 The LLOQ was determined by spiking ethanol-free blank urine with 1 mg/L EtG and 1 mg/L EtS, then serially diluting 1 in 2 with blank urine. Each was measured 10 consecutive times to calculate the coefficient of variation (CV). 23 The LLOQ for EtG and EtS was defined as the lowest concentration with a within-batch CV < 10%.
Interassay precision was assessed by measuring the four QC samples twice in batches on five different days (n = 10). The imprecision was deemed acceptable if the CV was < 15%.
Linearity was determined by double dilutions of a participant urine sample with high EtG (205.45 mg/L) and EtS (81.71 mg/L). The expected result was compared with the measured result.
Four experiments were performed to determine the recovery of the EtG and EtS method. A urine sample with undetectable EtG and EtS was spiked with a urine sample with high EtG and EtS (R1), 1000 mg/L EtG and EtS in methanol (R2), 1 mg/L EtG and EtS in methanol (R3) and the highest calibrator (R4: 100 mg/L EtG and 50 mg/L EtS). The samples were analysed three times. The following calculation was used to determine the recovery: Recovery = (spiked result − base result)/spike added × 100.
To assess carry over, PBS, QC Level 1 and two participant urine samples (no alcohol for two weeks) were analysed prior to and immediately after the analysis of a participant sample with high EtG (192.64 mg/L) and EtS (79.72 mg/L).
To determine the accuracy of the new method, samples from two rounds of the LGC drugs of abuse in urine proficiency scheme (Bury, UK) were prepared and then analysed for EtG and EtS. Participant urine samples were referred for analysis at a UK clinical laboratory (Viapath, Clinical Biochemistry, King's College Hospital, London) that routinely offers analysis of urine EtG and EtS by LC-MS/MS. Urine samples are prepared by dilution with internal standard. The LC-MS/MS method uses electrospray ionization in the negative mode followed by detection using multiple reaction monitoring. The LLOQ is 0.05 mg/L for both EtG and EtS (unpublished). Twenty-four samples were analysed using this method and our method. This included 10 samples from participants recruited at the Blood Test Clinic and 14 samples from 12 clients attending community alcohol treatment programmes.
Urine creatinine was measured using the Roche enzymatic method on the Cobas 8000 (Roche, Burgess Hill, UK).
EtG and EtS cut-off determination
The participant urine samples were analysed for EtG and EtS using the LC-MS/MS method described. The 99th percentiles for EtG, EtS and EtS/creatinine ratio were calculated using Microsoft Excel and Analyse-It (Version 2.26). The measurement uncertainty for EtG and EtS was defined using the standard deviation of the within-batch QC that was closest to the 99th percentile (QC Level 1). Two standard deviations were added onto the 99th percentiles to define cut-offs for EtG and EtS incorporating measurement uncertainty (95% confidence interval at the cut-off) as described by White. 24
Results
Optimal transitions and collision energies for EtG, EtS, EtG-d5 and EtS-d5.
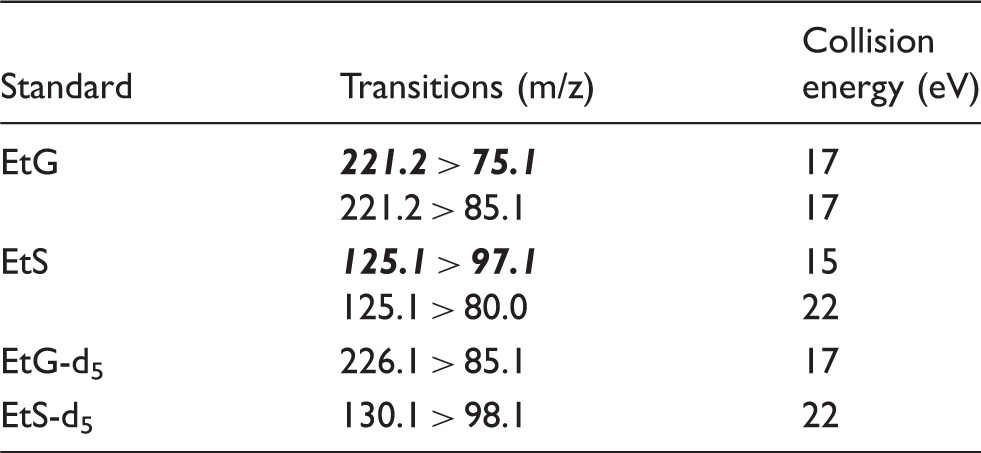
EtG: ethyl glucuronide; EtS: ethyl sulphate.
Note: The cone voltage was 30 V. The quantifier ion transition for EtG and EtS is displayed in bold italic.
Figure 1 displays the chromatograms for the lowest calibrator, QC Level 1 and a client in alcohol treatment. The chromatography retention times were 2.03 min for EtG/EtG-d5 and 1.27 min for EtS/EtS-d5. The chromatography retention times were consistent across batches with a between-batch CV of <1.5% for both EtG and EtS. The total run time was 4.75 min.
Chromatograms of (a) the lowest calibrator (EtG 0.10 mg/L and EtS 0.05 mg/L), (b) quality control Level 1 (EtG 0.23 mg/L and EtS 0.08 mg/L) and (c) a client in alcohol treatment (EtG 95.50 mg/L and EtS 25.30 mg/L).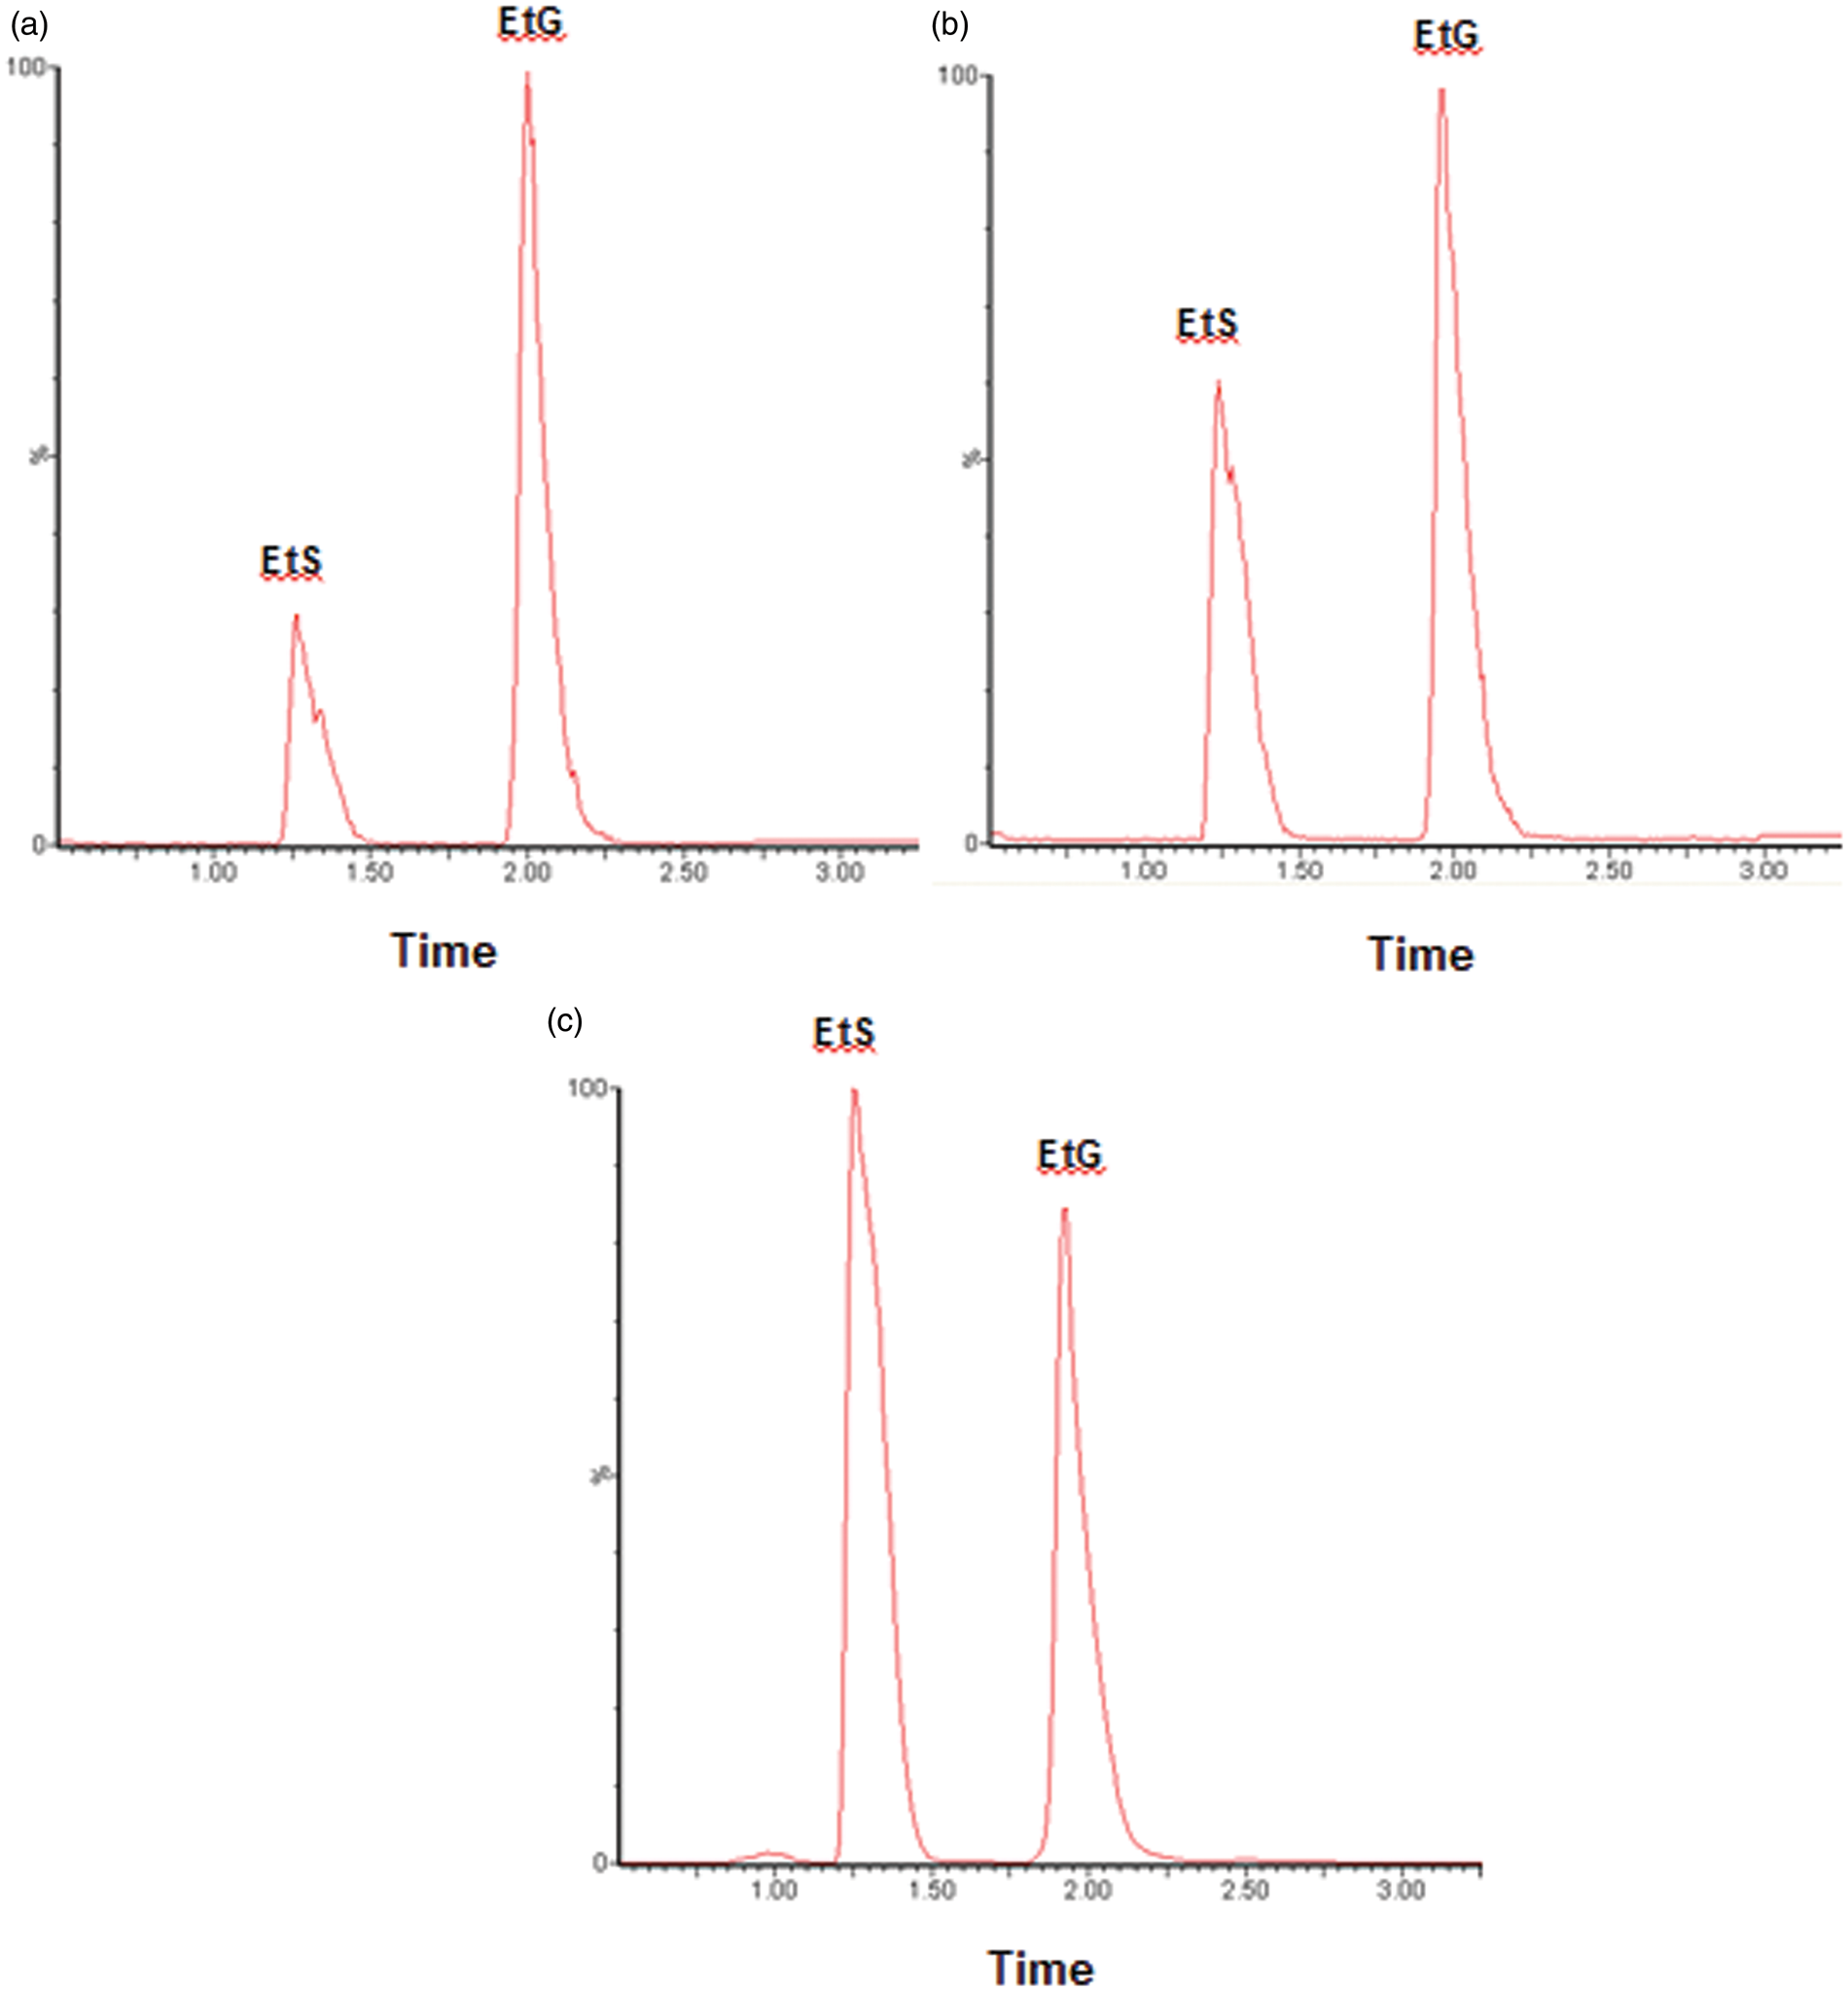
Matrix effects
No ion suppression or enhancement was observed at or near the retention times for EtG and EtS (n = 3).
Analytical performance
Comparison of the lower limit of detection (LOD) and the lower limit of quantitation (LLOQ) between this method and other published LC-MS/MS methods for EtG and EtS.
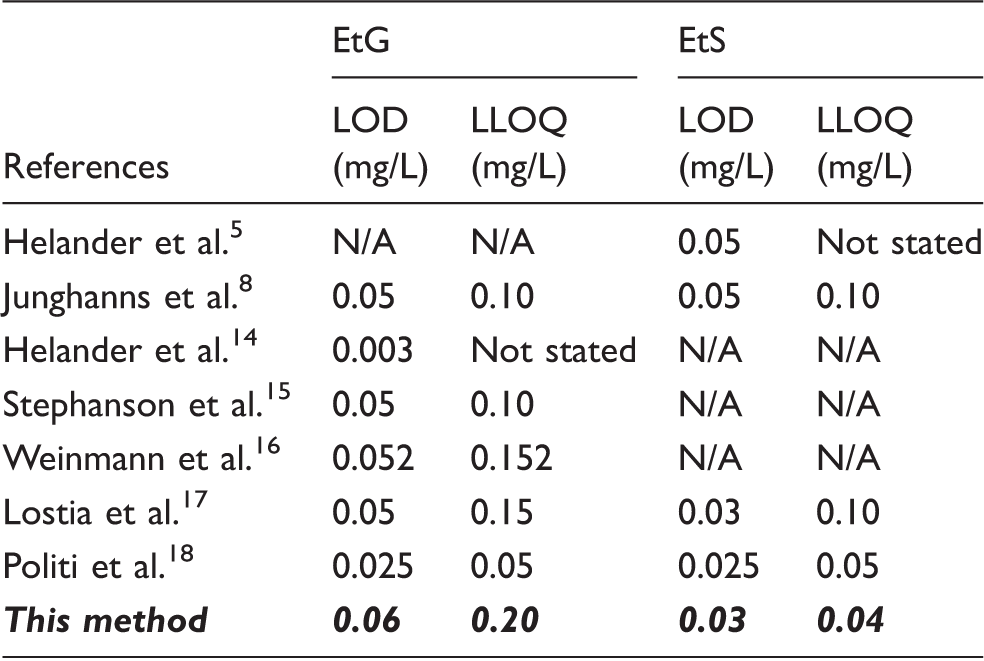
EtG: ethyl glucuronide; EtS: ethyl sulphate; LOD: limit of detection; LLOQ: lower limit of quantitation.
Note: N/A means that the analyte was not measured using this method.
Mean, standard deviation (SD) and inter-assay CV of the four quality controls for urine EtG and EtS.
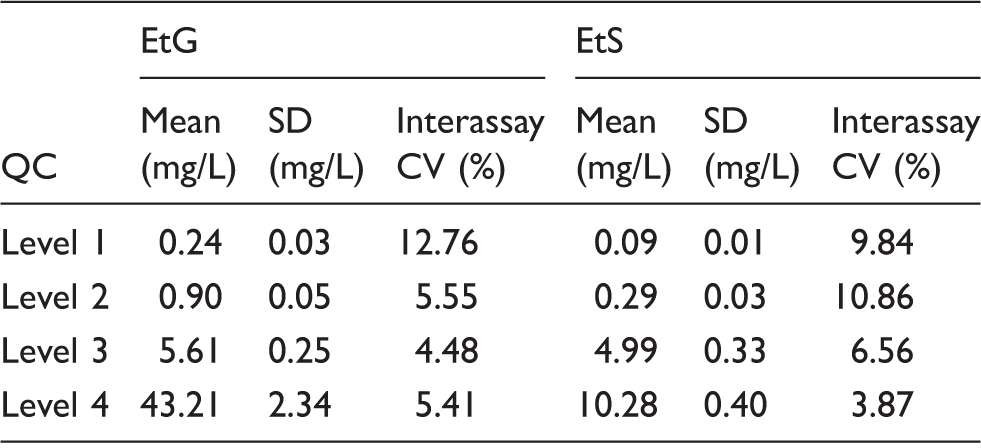
CV: coefficient of variation.
The method was linear up to 205 mg/L for EtG (R2 = 0.9996) and up to 82 mg/L for EtS (R2 = 0.9999). No carry-over of EtG or EtS was observed when a participant sample with high results was analysed prior to PBS, QC Level 1 or two urine samples from participants who had not consumed alcohol for at least two weeks.
The recovery experiments demonstrated an average total recovery of 108% (104–111%) for EtG and 109% (100–125%) for EtS. All recoveries were acceptable except the result of 125% for EtS. However, this was at a very low EtS concentration, and a result of 0.13 mg/L was given when 0.10 mg/L was expected. Due to the very low concentrations, this very small difference in result has given a very high recovery.
Method comparison
For EtG, all six proficiency scheme samples were defined as detected (5/6) or not detected (1/6) using the new LC-MS/MS method and the literature cut-off (EtG 0.50 mg/L). All results agreed with the scheme consensus. For EtS, all four samples were defined as detected by the proficiency scheme consensus, and this was in agreement with all four results from the new LC-MS/MS method when using the literature cut-off of 0.10 mg/L.
The comparison of the new method to the referral laboratory method for EtG and EtS in 24 participant urine samples was excellent (EtG range: <0.20–2762.28 mg/L and EtS range: <0.04–300.46 mg/L) and is shown in Figure 2. Fifteen EtG and 7 EtS results were below the LLOQ for both methods. Using the literature cut-offs (0.50 mg/L for EtG and 0.10 g/L for EtS), all results were consistently classified as either positive or negative using both the new method and the referral laboratory method.
Passing-Bablok regression analysis for EtG (n = 9) and EtS (n = 15). Participant urine samples were analysed using the new LC-MS/MS method and using an LC-MS/MS method in routine use at a UK clinical laboratory.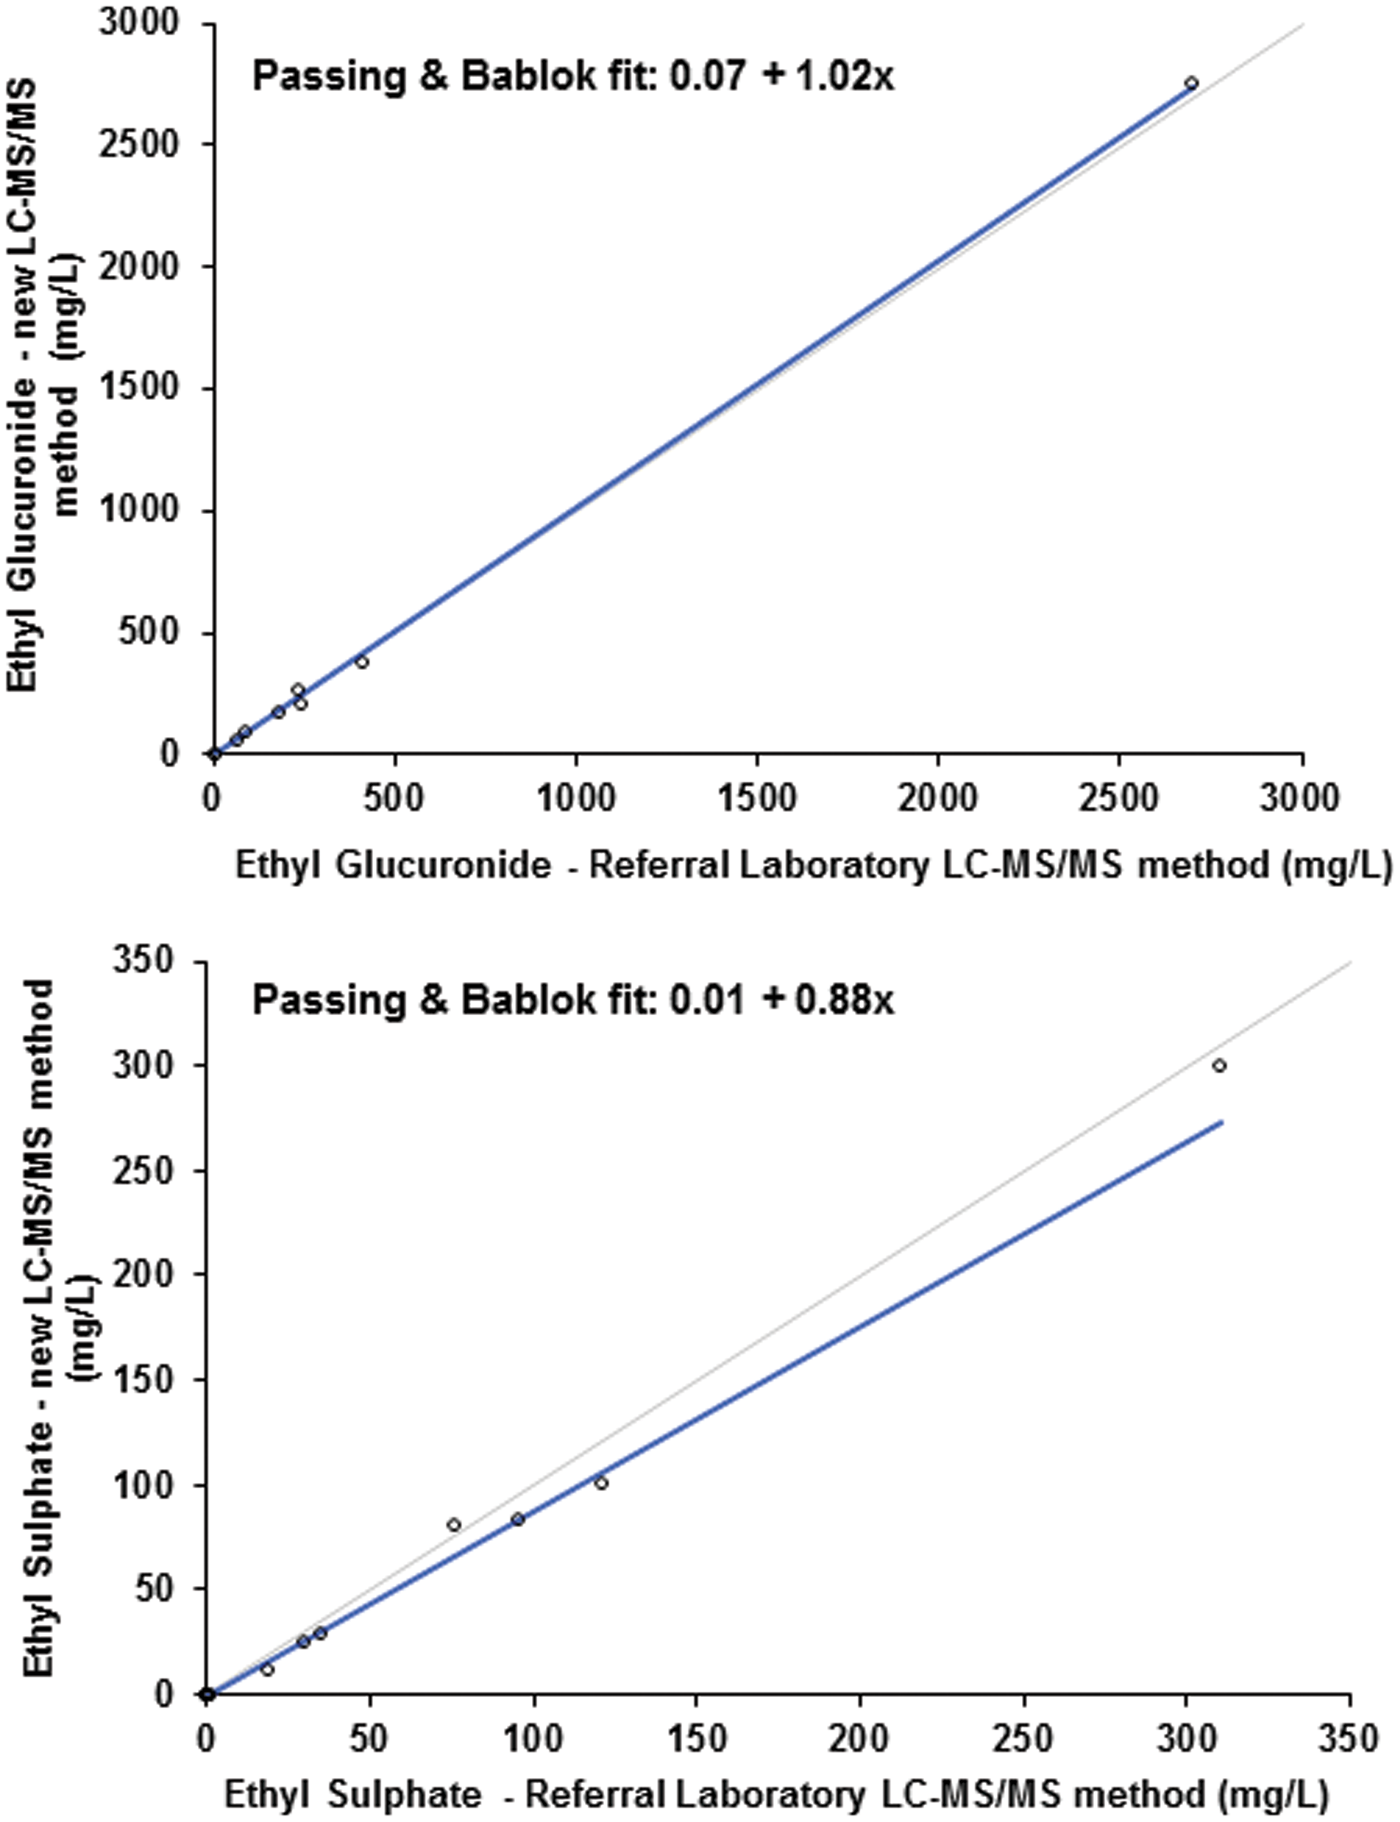
EtG and EtS cut-off determination
EtG, EtS and creatinine were measured in 81 participants (42 females, mean age 53 years) who stated that they had not consumed alcohol in the previous two weeks. For EtG, all results except one were below the LLOQ (0.20 mg/L). The only detectable result was 0.80 mg/L which is much higher than the LLOQ and higher than the literature clinical cut-off of 0.50 mg/L. 20 This result was excluded from the cut-off determination. Therefore, for EtG the clinical cut-off is based on the LLOQ but also takes into account the measurement uncertainty at this concentration (0.06 mg/L (using SD of QC Level 1, Table 3). The clinical cut-off for EtG was defined as 0.26 mg/L. This is lower than the suggested literature clinical cut-off of 0.50 mg/L. As all 80 urine EtG results were below the LLOQ, EtG/creatinine ratios could not be calculated and an EtG/creatinine ratio cut-off could not be defined.
For EtS, 32/81 results (40%) were below the LLOQ (0.04 mg/L). The participant who had the only EtG result above the LLOQ also had the highest EtS result at 0.60 mg/L. Consistent with the calculation of the EtG cut-off, the result from this participant was excluded from the EtS and EtS/creatinine ratio cut-off determination. The 99th percentile for urine EtS was 0.20 mg/L (n = 80). The measurement uncertainty at this level is 0.02 mg/L (using SD of QC Level 1, Table 3). Therefore, to take into account the measurement uncertainty, the cut-off for EtS is 0.22 mg/L.
The EtS/creatinine ratio could be calculated for 48/80 urine samples which had detectable EtS (above the LLOQ). The 99th percentile was 0.033 mg/mmol.
The clinical cut-offs for EtG, EtS and EtS/creatinine ratio were calculated using the results from participants who had not consumed alcohol for at least two weeks.
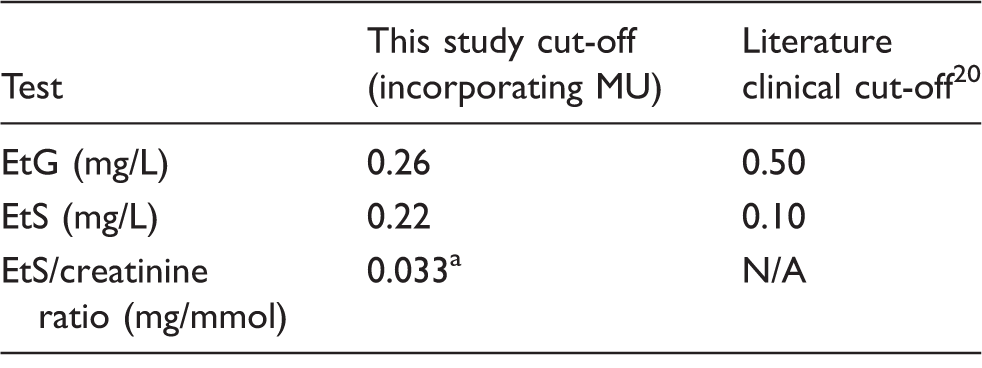
EtG: ethyl glucuronide; EtS: ethyl sulphate.
MU: measurement uncertainty
99th percentile only. The EtS/creatinine ratio cut-off does not incorporate MU.
The calculated cut-offs were then used to compare the results using this method to the proficiency scheme consensus and the referral laboratory results. Using the calculated cut-offs, all results agreed with the proficiency scheme consensus (6/6 for EtG and 4/4 for EtS). In addition, all samples were consistently positive (9/24) or negative (15/24) using both the new LC-MS/MS method and the referral laboratory method. All urine EtG and EtS results from clients in community alcohol treatment who stated that they were continuing to drink alcohol were positive using the new cut-offs.
Discussion
A new LC-MS/MS method to measure urine EtG and EtS has been developed and clinical cut-offs have been defined in a non-drinking population. The LLOQ was comparable to other published methods for EtS but slightly higher for EtG. The advantages of this method over other published methods are that in addition to simple sample preparation, it is accompanied by validated clinical cut-offs defined using samples collected from a non-drinking population (0.26 mg/L, 0.22 mg/L and 0.033 mg/mmol for EtG, EtS and EtS/creatinine, respectively). This is the first study where clinical cut-offs incorporating measurement uncertainty have been defined using such a large number of participants with no recent alcohol intake and the first to define a clinical cut-off for EtS/creatinine ratio. Other methods have used the LLOQ as the clinical cut-off or used the proposed clinical cut-offs in the literature (0.50 mg/L for EtG and 0.10 mg/ L for EtS). 20 The EtG cut-off was proposed to avoid false-positive results due to unintentional ethanol exposure and is not based on analysis in a non-drinking population. Measuring EtG and EtS in a large number of non-drinking participants makes our cut-offs more clinically relevant.
The accuracy of this method was confirmed by comparison to the proficiency scheme consensus and to a referral laboratory using a LC-MS/MS method. There was concordance in the results whether using the literature clinical cut-offs or the cut-offs defined in this study. In clients in alcohol treatment, the urine EtG and EtS results were in agreement with the self-reported alcohol intake. No carry over was observed. The method was linear up to 205 mg/L for EtG and up to 82 mg/L for EtS. This is suitable to cover the majority of results expected in clients continuing to drink heavily. However, further work using patient samples with higher results may provide a wider linear range.
The potential disadvantage of using a simple dilution step to prepare the samples is the possibility of matrix effects. However, we observed no ion suppression or enhancement and the recovery experiments indicated good recovery of both analytes in urine.
Eighty-one participants provided a urine sample for analysis after confirming that they had not consumed any alcohol for at least 2 weeks. One participant’s results were excluded from the calculation of the EtG, EtS and EtS/creatinine ratio cut-offs as their results were markedly higher than for all other participants (EtG = 0.80 mg/L and EtS = 0.60 mg/L). There are three possible explanations for these results: the participant had consumed alcohol recently, had used alcohol hand gel or mouthwash or had an infection with glycosuria.11–13 The high EtS in the same sample excludes an infection as the cause of the detectable EtG. The highest EtG and EtS results in a study where all participants used ethanol-containing mouthwash four times/day were 0.17 mg/L and 0.10 mg/L, respectively. In another study where subjects applied ethanol-containing hand sanitizer every 5 min for 10 h, the highest recorded EtG and EtS results were 2.00 mg/L and 0.08 mg/L, respectively. The fact that EtG and EtS are both so high in this study participant makes the use of hand gel or mouthwash an unlikely explanation. The most likely explanation is recent alcohol intake that was not reported, particularly as this participant would also have been classified as positive for both tests using the literature cut-offs. It is possible that other participants had consumed alcohol in the previous two weeks. However, participation was optional and full information was provided to any potential participants. It is unlikely that those who had consumed alcohol would choose to participate.
This is the only study also to calculate a cut-off for EtS/creatinine ratio. Further work is required to determine if there is any benefit in reporting EtS results as creatinine ratios. It was not possible to calculate a cut-off for EtG/creatinine ratio as all results except one were below the LLOQ. Improving the sensitivity of the method may prove beneficial to calculate EtG/creatinine ratios. When providing urine EtG and EtS analysis routinely in our laboratory, the creatinine is measured on all urine samples as a check for dilute samples (urine creatinine < 2 mmol/L) 24 and reported with a suitable comment if adulteration is suspected. Further work investigating the benefit of reporting EtG and EtS as creatinine ratios is required in clients in alcohol treatment where attempts to adulterate samples are more likely than in our study population.
Many laboratories continue to provide EtG results only. However, due to the risk of low-positive EtG results due to unintentional alcohol exposure, we propose that both EtG and EtS are reported together. Positive EtG and EtS results are consistent with alcohol ingestion.
Conclusion
An LC-MS/MS method for the simultaneous measurement of EtG and EtS has been validated and clinical cut-offs defined using 80 recruited participants who had not consumed any alcohol for at least two weeks. EtG and EtS are not yet routinely used in the UK, with community alcohol treatment teams continuing to rely on self-reporting of alcohol intake and breath ethanol testing. This method with EtG, EtS and EtS/creatinine ratio cut-offs defined in a large non-drinking population will be a useful additional tool for the community alcohol teams, increasing the time window of alcohol ingestion detection in their clients.
Footnotes
Declaration of conflicting interests
The author(s) declared no potential conflicts of interest with respect to the research, authorship, and/or publication of this article.
Funding
An ACB Scientific Scholarship was awarded to JA in 2013 to complete this work.
Ethical approval
This study was approved by the NRES Committee North West-Preston (REC number: 13/NW/0551).
Guarantor
JA.
Contributorship
JA and RA designed the study and obtained ethical approval. JA validated the assay with assistance from RA. JA wrote the first draft of the paper. Both authors reviewed and edited the manuscript. Both authors approved the final version.
Acknowledgements
The authors would like to thank the Association for Clinical Biochemistry & Laboratory Medicine for the award of a Scientific Scholarship to JA in 2013 to complete this study.