
Abstract
Background
Plasma amino acid concentrations vary with various diseases. Although reference intervals are useful in daily clinical practice, no reference intervals have been reported for plasma amino acids in a large Japanese population.
Methods
Reference individuals were selected from 7685 subjects examined with the Japanese Ningen Dock in 2008. A total of 1890 individuals were selected based on exclusion criteria, and the reference samples were selected after the outlier samples for each amino acid concentration were excluded. The lower limit of the reference intervals for the plasma amino acid concentrations was set at the 2.5th percentile and the upper limit at the 97.5th percentile.
Results
By use of the nested analysis of variance, we analysed a large dataset of plasma samples and the effects of background factors (sex, age and body mass index [BMI]) on the plasma amino acid concentrations. Most amino acid concentrations were related to sex, especially those of branched-chained amino acid. The citrulline, glutamine, ornithine and lysine concentrations were related to age. The glutamate concentration was related to body mass index.
Conclusions
The concentrations of most amino acids are more strongly related to sex than to age or body mass index. Our results indicate that the reference intervals for plasma amino acid concentrations should be stratified by sex when the background factors of age and body mass index are considered.
Keywords
Introduction
The reference intervals (RIs) for various biochemical parameters are routinely used in the field of clinical laboratory testing, and the RIs for amino acids in biological fluid have been reported for different species and ages.1,2 Moon et al. reported the RI for serum homocysteine concentrations in a Korean population. 3 Tan and Gajra reported the RI for amino acids in the plasma and urine of Singaporean populations, and the results suggested that amino acid concentrations differed between Singaporean and Caucasian populations. 4 The amino acid concentrations in biological fluids vary across different species, and the RIs for each population must be established.
Plasma amino acids are routinely measured in newborn babies to detect inborn errors of amino acid metabolism. 5 In adults, the relationships between plasma amino acid concentrations and various diseases, including cancer, 6 diabetes mellitus 7 and malnutrition, 8 have been reported. Cascino et al. reported that glycogenic amino acids are reduced and tryptophan is significantly increased in lung cancer patients. 9 It has been reported that plasma amino acid concentrations vary according to visceral adiposity in diseases associated with adult lifestyle habits, 10 and could predict the risk of future diabetes in the Framingham Heart Study. 11 Many studies on plasma amino acid concentrations have reported that they are useful for the diagnosis of disease. However, no RIs for the Japanese population have been reported in a large-scale study.
In this study, we estimated the RIs in individuals selected from subjects who presented for the Ningen Dock, a comprehensive medical check-up system that is unique to Japan.12,13 It is estimated that about three million people per year undergo this examination at about 1500 medical institutions throughout the country. 12 These individuals rarely have acute or serious conditions, so it is appropriate to collect biological fluid samples from this large population of healthy individuals for the analysis of normal parameters. We analysed the relationships between the plasma amino acid concentrations of the reference individuals and background factors, such as sex, age and body mass index (BMI).
Materials and methods
Human participants
From January to November 2008, a total of 7685 individuals attended Mitsui Memorial Hospital in Tokyo for the Ningen Dock examination and gave their informed consent for participation in this study. The protocol was approved by the Ethical Committee of Mitsui Memorial Hospital. Three exclusion criteria were used to screen the reference individuals. The first exclusion criterion was the use of a regular drug therapy for a chronic disease, such as diabetes, hypertension, hyperlipidemia, gout and depression. The second criterion was any abnormality on ordinary clinical laboratory tests: albumin (ALB) < 41 g/L, ALB > 51 g/L, triglycerides (TG) in male <0.47 mmol/L, TG in male > 2.51 mmol/L, TG in female <0.34 mmol/L, TG in female > 1.4 mmol/L, uric acid (UA) in male <224 mmol/L, UA in male >474 mmol/L, UA in female <154 mmol/L, UA in male >334 mmol/L, glucose (GLU) < 4.2 mmol/L, GLU > 5.9 mmol/L, γ-glutamyltransferase > 100 U/L, alanine aminotransferase (ALT) < 8 U/L, ALT > 32 U/L, γ-glutamyltransferase (GT) < 9 U/L, GT > 55 U/L, creatine kinase (CK) < 61 U/L, CK > 257 U/L, C-reactive protein (CRP) > 1.4 mg/L, haemoglobin (Hb) in male <135 g/L, Hb in male >169 g/L, Hb in female <110 g/L, Hb in female >148 g/L, mean corpuscular volume (MCV) < 82 fl, MCV > 98 fl, in accordance with a previous report of RIs in Japanese population. 14
The remaining exclusion criteria were that more than 20 cigarettes were smoked per day, BMI ≤ 14 kg/m2, BMI ≥ 30 kg/m2,15,16,17 or the average blood pressure was ≥160 mmHg in the systolic phase and ≥100 mmHg in the diastolic phase, in accordance with the criteria of the Japan Society of Ningen Dock.18,19 Outliers that exceeded the mean by more than four standard deviations were excluded for each amino acid concentration after their Box–Cox transformation. 20 The individuals remaining after these exclusion criteria were applied constituted the set of reference individuals.
Plasma samples and amino acid measurements
Blood samples (5 mL) were drawn into EDTA-2Na tubes (Terumo, Tokyo, Japan) in the morning after a fasting period of at least 8 h. After they had been inverted gently, the collected samples were cooled in iced water for 1 min and allowed to stand for more than 15 min. To prepare the plasma samples, the blood samples were centrifuged at 2010 g at 4℃ for 15 min and the supernatant was collected. These samples were frozen at −80℃ within 4 h of collection. The amino acids in the plasma samples were derivatized with 3-aminopyridyl-N-hydroxysuccinimidyl carbamate (Wako Pure Chemical Industries Ltd, Osaka, Japan) 21 and were measured by liquid chromatography–mass spectrometry (LC–MS). The derivatization and LC–MS measurements were made with a Shimadzu UF-Amino Station (Shimadzu Corporation, Kyoto, Japan). The details of the sample preparation, derivatization and amino acid measurement have been described by Yoshida et al. 22
Statistical analysis
The lower limits of the RIs for the plasma amino acid concentrations were set at the 2.5th percentile and the upper limits at the 97.5th percentile with the non-parametric approach. To assess the effect of sex, age BMI and the frequency of alcohol consumption to plasma amino acid concentrations, a nested analysis of variance (ANOVA) was performed. In the nested ANOVA, age, BMI and the frequency of alcohol consumption were coded as categorical variables. Age was coded 1 for age <40 years; 2 for 40 ≤ age <50; 3 for 50 ≤ age < 60 and 5 for age ≥ 60. BMI was coded 1 for BMI < 20.0; 2 for 20.0 ≤ BMI < 22.0; 3 for 22.0 ≤ BMI < 25.0 and 4 for BMI ≥ 25.0. The frequency of alcohol consumption was coded 1 for no consumption, 2 for drinking less than one day per week, 3 for drinking on 2–3 days per week, 4 for drinking on 4–6 per week and 5 for drinking on most days of the week. We computed the standard deviation ratio (SDR), 17 which is the SD attributable to each source of variation divided by the SD attributable to the between-individual variation. All statistical analyses were performed with the R software version 2.15.2 and the ggplot2, car, moments and varcompci packages.
Results
Sample sizes and summary of subject information of the reference individuals.
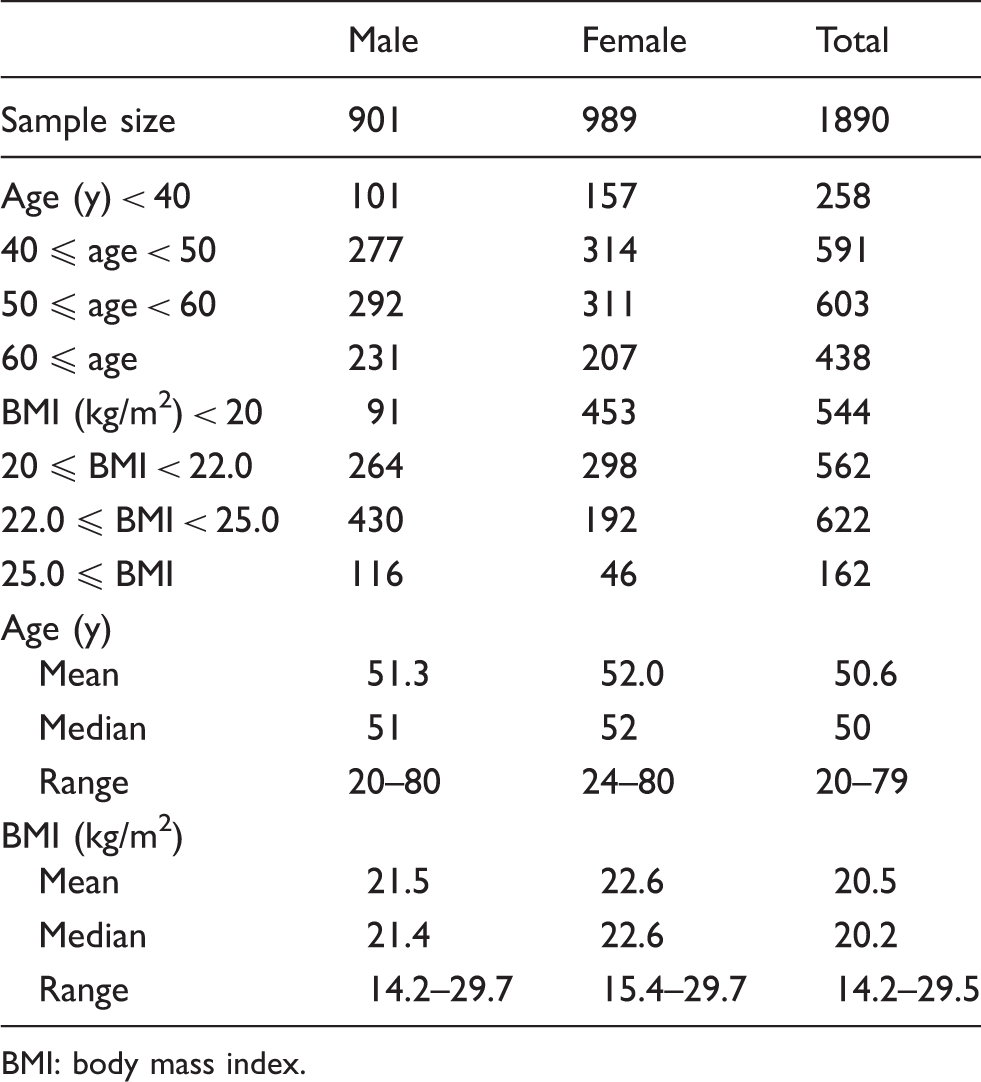
BMI: body mass index.
Reference intervals of plasma amino acid concentrations of males and females by non-parametric approach.
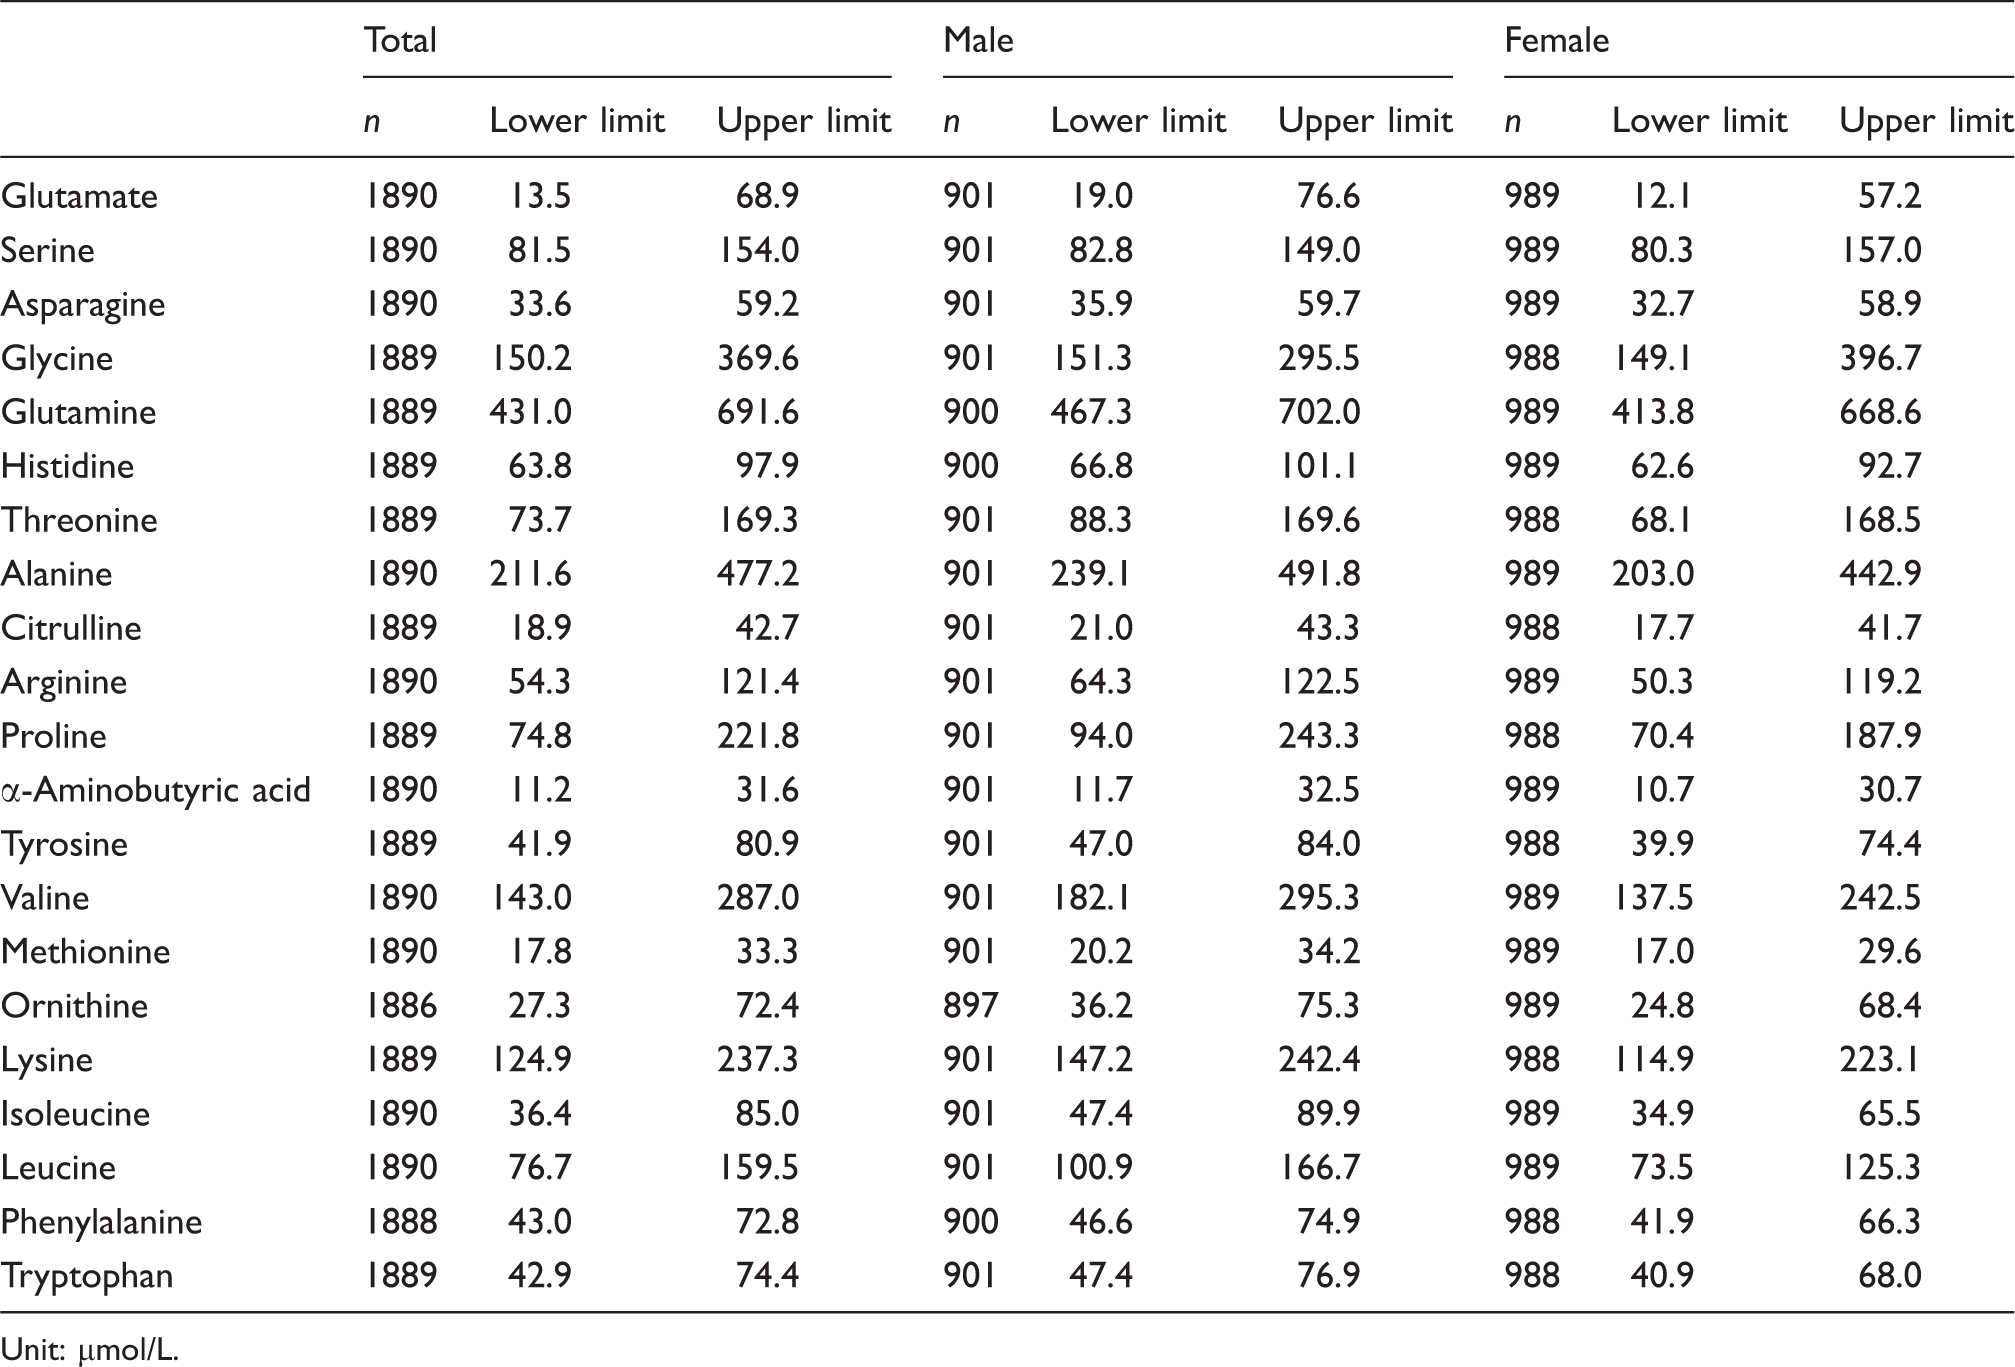
Unit: µmol/L.
Standard deviation ratios (SDRs) for sex, age, BMI and frequency of alcohol consumption.
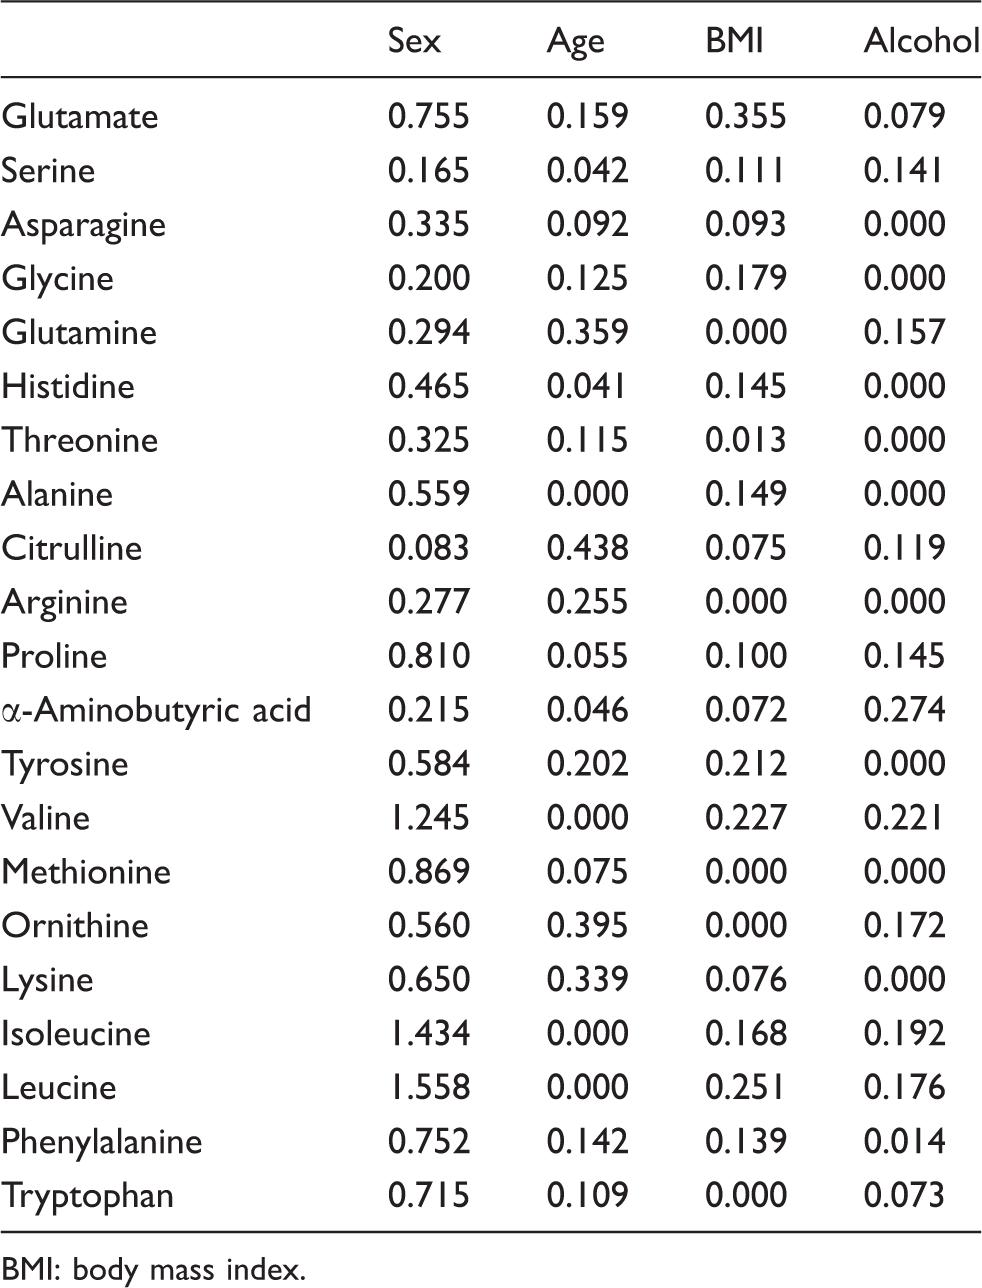
BMI: body mass index.
Discussion
The result of SDRs suggested that most amino acid concentrations were varied with sex. Most amino acid concentrations except the serine and glycine were higher in male individuals than in female individuals (data not shown). The concentrations of the branched-chained amino acids (BCAA), valine, isoleucine and leucine (Figure 1) were especially varied with sex according to the results of nested ANOVA and SDR (SDR = 1.245, 1.558 and 1.434). Kochhar et al. showed that isoleucine and valine concentrations in plasma samples were higher in male than in female individuals.
23
Kubota et al. suggested that plasma amino acid profiles could be used to discriminate between patients with various cancers and healthy controls, and that plasma amino acid concentrations are statistically significantly different in male and female individuals.
24
Sample distributions of valine, leucine and isoleucine concentrations (µmol/L) in male and female individuals: black, male; grey, female. Histogram of (a) valine, (b) leucine and (c) isoleucine concentrations.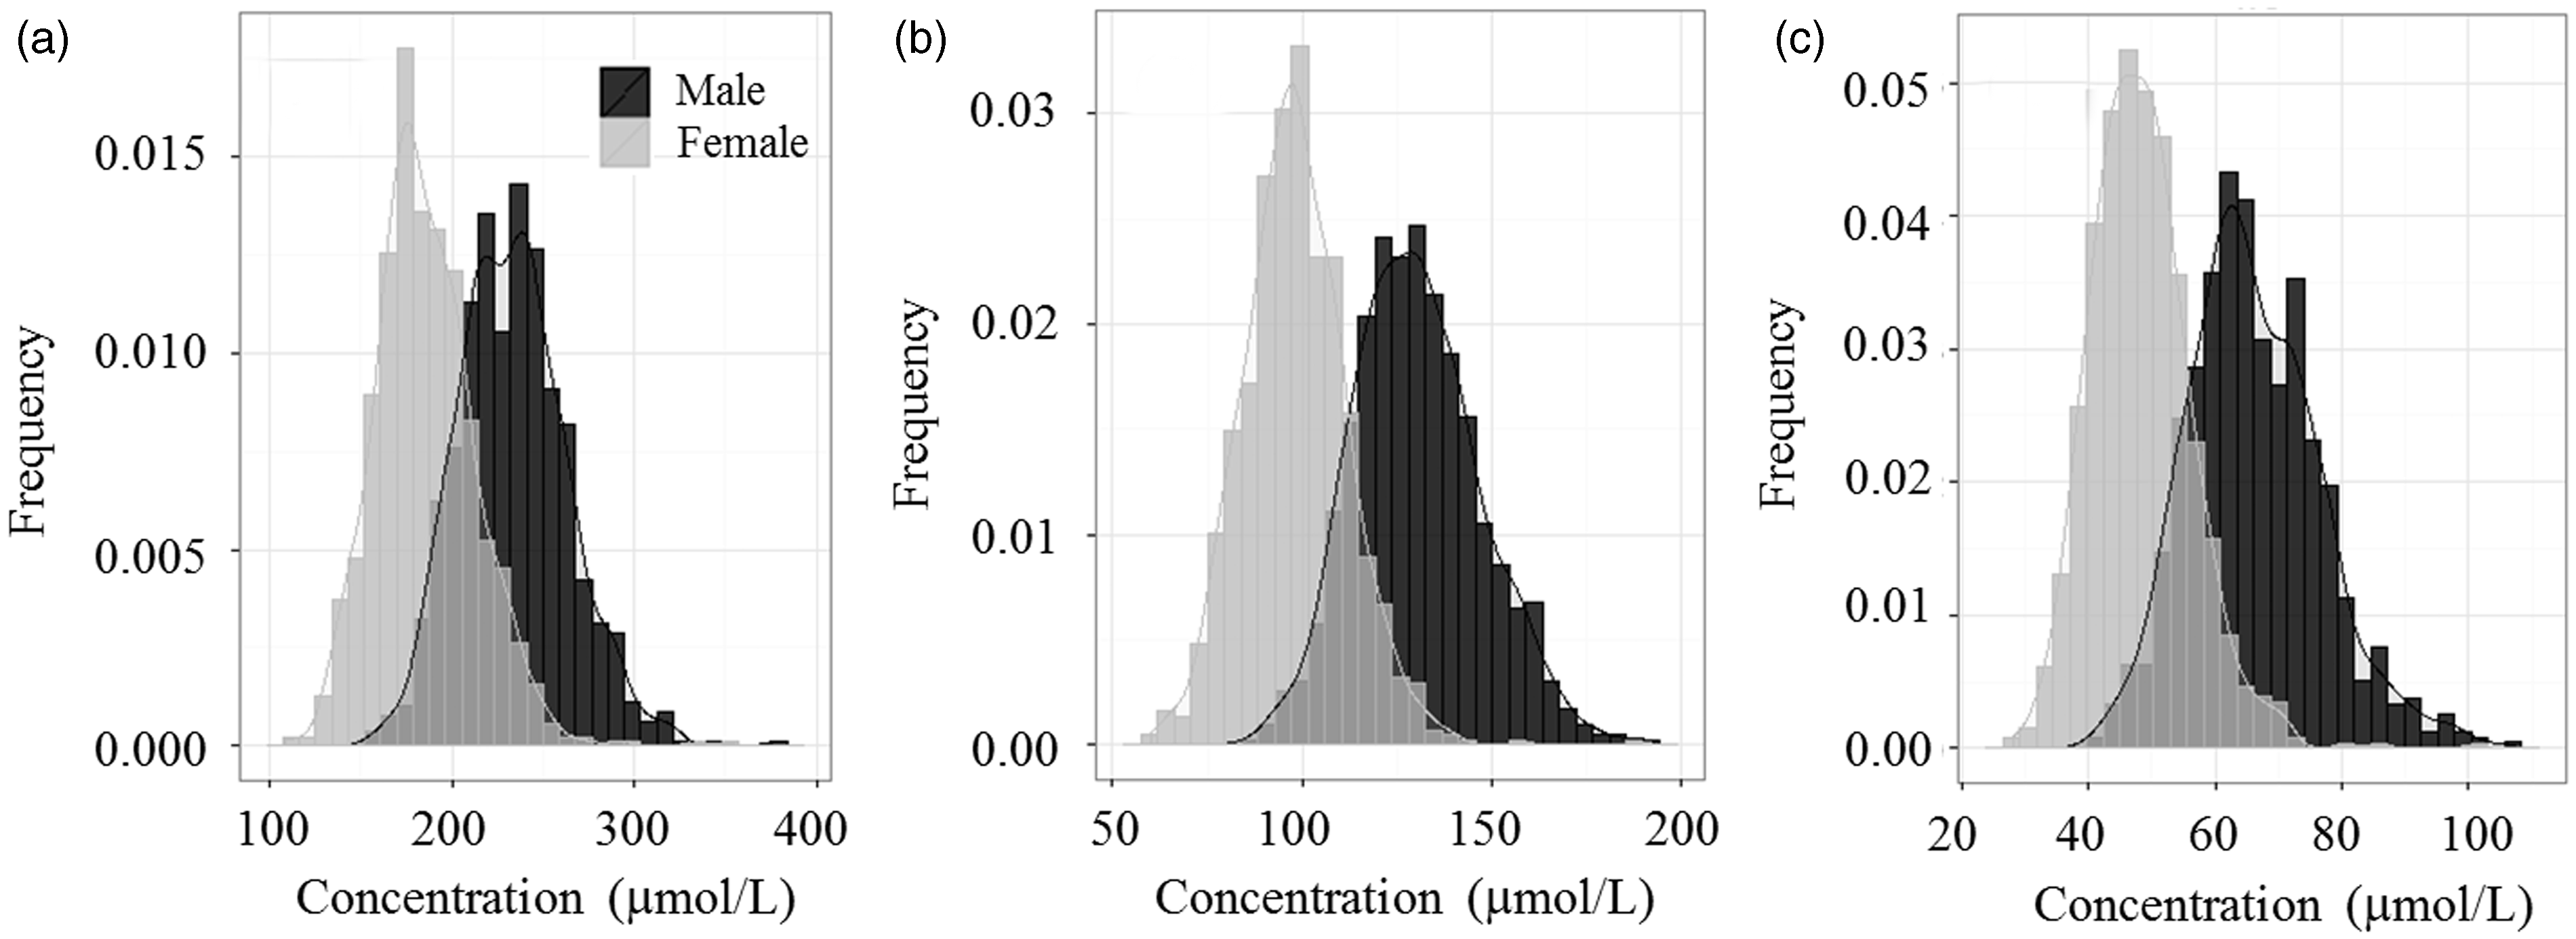
The SDR corresponding to age was highest for citrulline (Figure 2) among all the amino acid concentrations examined (Table 3). Menni et al. identified some metabolites that vary with age in serum and plasma samples, and citrulline was one of those metabolites.
25
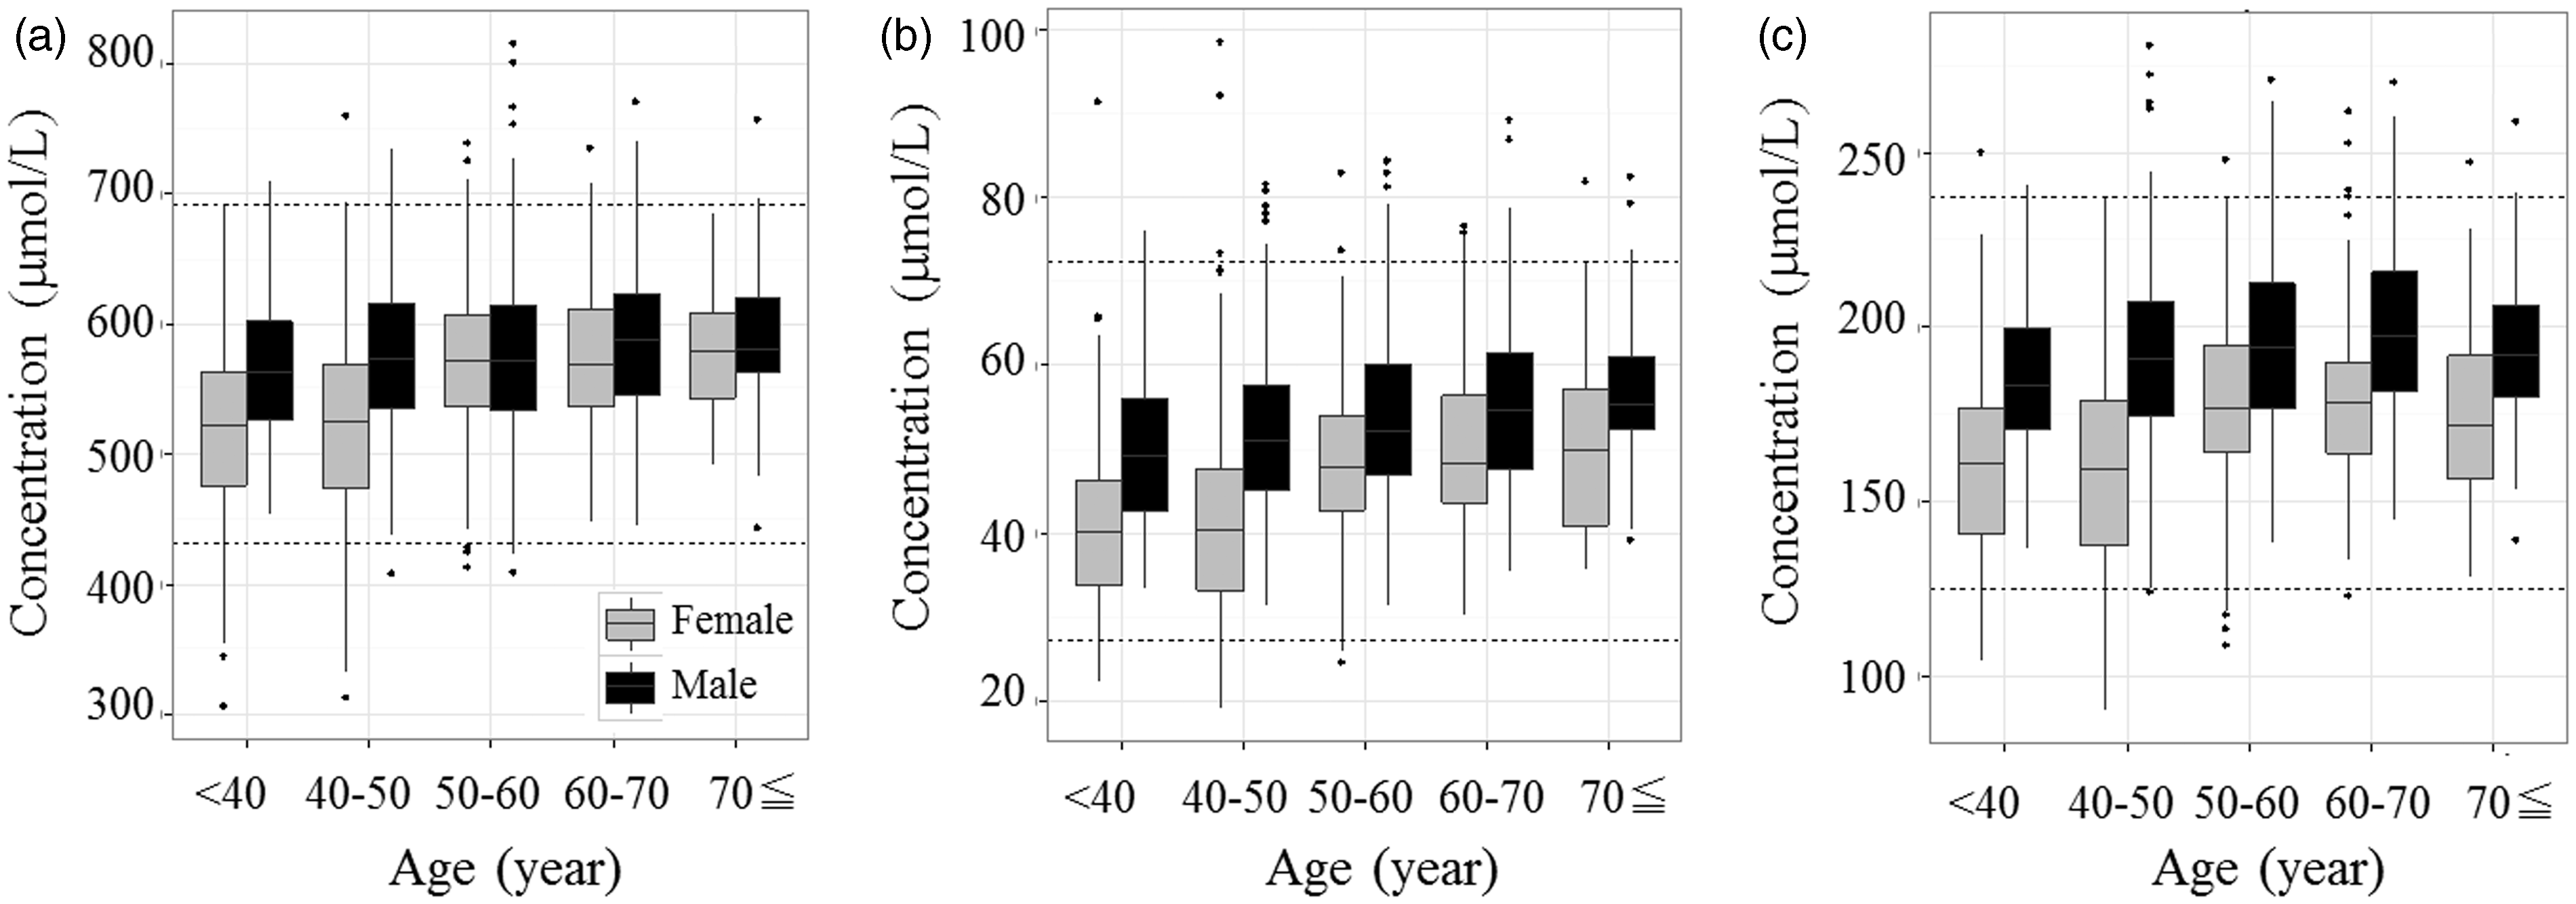
In addition, the SDR corresponding to age exceeds 0.3 for glutamine, ornithine and lysine. Glutamine, ornithine and lysine concentrations tended to change at around 50 years of age in female individuals (Figure 3). Zang et al. reported that some amino acid concentrations in serum samples, including that of lysine, varied in response to oestrogen and testosterone in postmenopausal women.
26
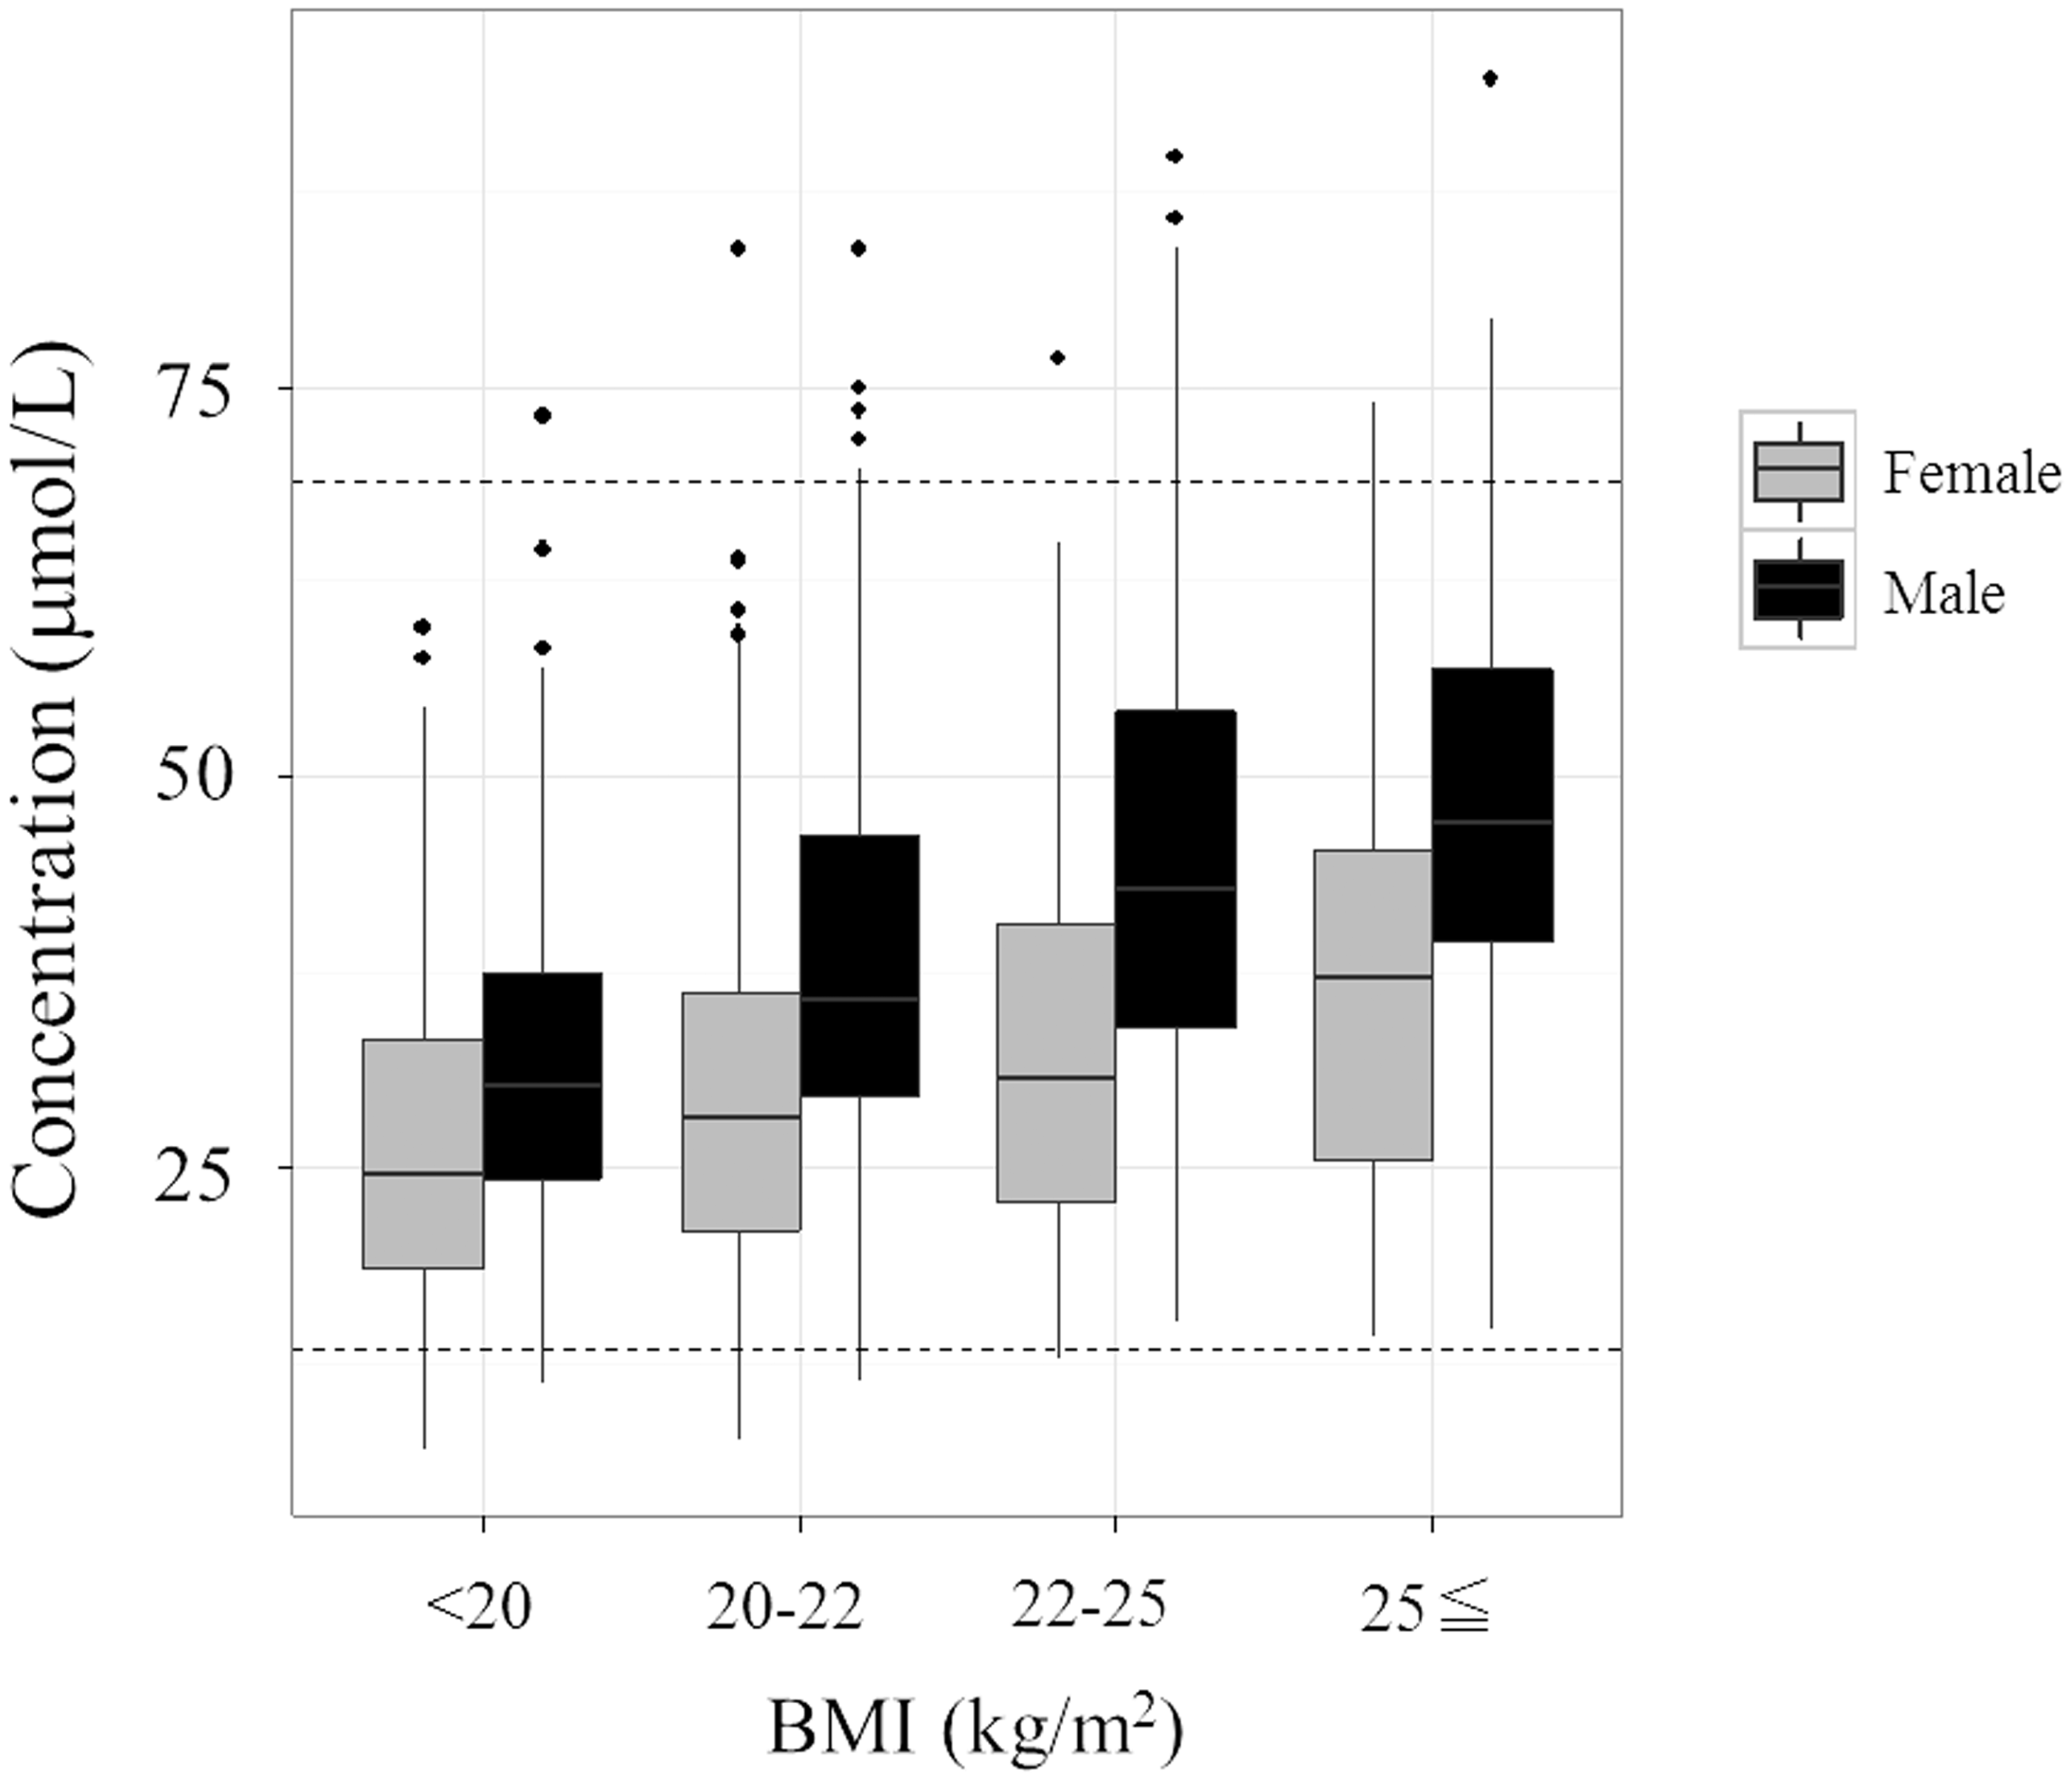
These amino acid concentrations possibly fluctuate in the context of menopause. The SDR corresponding to BMI only exceeds 0.3 for glutamate (Figure 4). In a metabolomic analysis of serum and plasma samples, Moore et al. found that the glutamate concentration was especially related to BMI.
27
Box plot of citrulline concentrations (µmol/L) for each age range (years). The bottom of the box is the 25th percentile and the top is the 75th percentile. The outlying points were excluded if they were 1.5 × interquartile range from the bottom or top of the box. Age ranges were: <40 years, 40–50 years, 50–60 years, 60–70 years and ≥ 70 years. Black, male; grey, female. The dashed lines show the lower and upper limits of the reference intervals. Box plots of glutamine, ornithine and lysine concentrations for each age range (years). Age ranges were as in Figure 2. Box plot of (a) glutamine, (b) ornithine and (c) lysine concentrations. Box plot of the glutamate concentration for each range of BMI (kg/m2). Ranges of BMI were: <20 kg/m2, 20–22 kg/m2 and ≥ 22 kg/m2. Black, male; grey, female.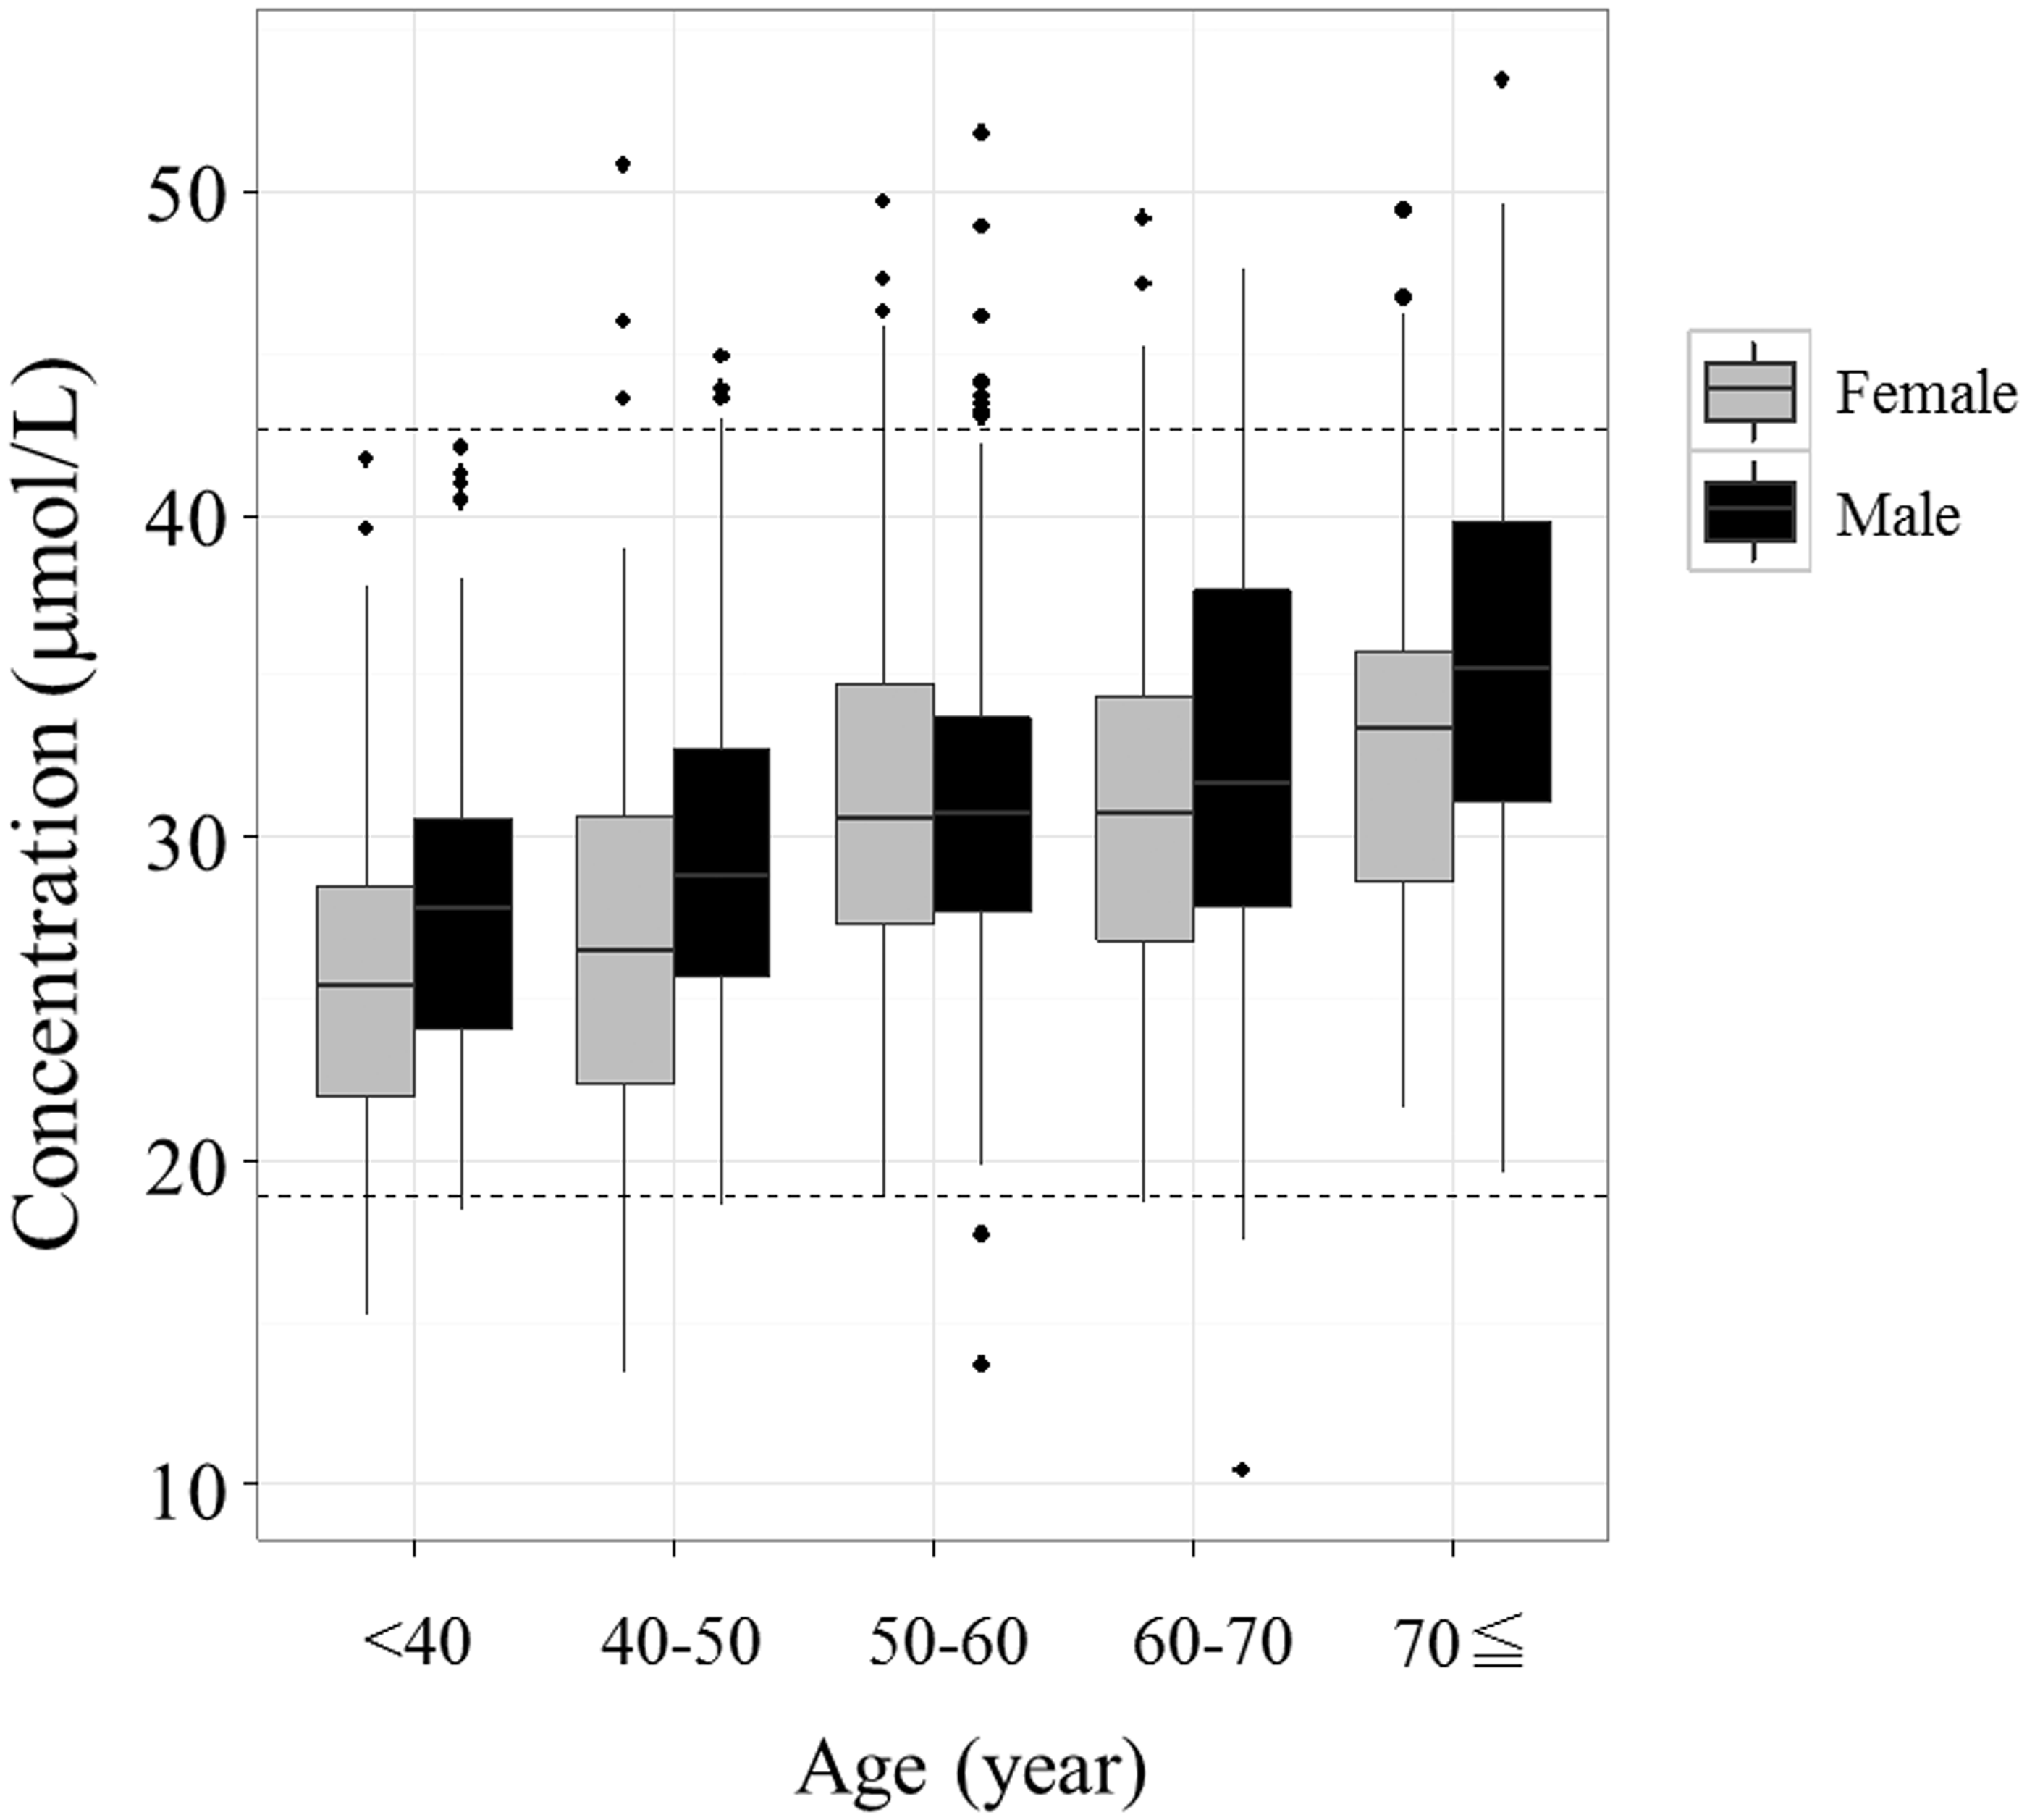
The SDR corresponding to the frequency of alcohol consumption was less than 0.3 for all amino acids (Table 3). These results suggest that drinking alcohol does not greatly relate plasma amino acid concentrations. In this study, we used the frequency of alcohol consumption per week instead of the amount of alcohol consumed because it was not recorded in the medical interview data. Therefore, further analysis of an association between plasma amino acid concentrations and the amount of alcohol consumed might be required.
An association between plasma amino acid concentrations and background factors, such as sex and age has been reported. Lawton et al. insisted that the influence of age on plasma BCAA was greater than that of sex. 28 The reason for the discrepancy between that study and ours may be that their study was based on a smaller sample than ours and analysed a different species. Our results also suggest that the plasma amino acid concentrations vary readily in response to various background factors. In this study, we selected reference individuals who could be assumed to be healthy. This population was considered to be uniform and not susceptible to the influence of various background factors. These are the greatest differences between our study and previous studies that have examined the effects of background factors on plasma metabolite concentrations.
Conclusion
We estimated the RIs for plasma amino acid concentrations, for which the lower limit was set at the 2.5th percentile and the upper limit at the 97.5th percentile. We selected reference individuals who were presumed to be healthy on the basis of various exclusion criteria. We also examined the effects of background factors on the plasma amino acid concentrations. Most amino acid concentrations were more closely related to sex than to age or BMI. This result suggests that RIs stratified by sex are preferable when the background factors of sex, age and BMI are considered.
Footnotes
Acknowledgements
We thank Dr Minoru Yamakado for helpful discussions, Ms Naoko Kageyama for the amino acid analysis, and Ms Atsuko Shinhara and Ms Mai Yamamoto for help with the data acquisition.
Declaration of conflicting interests
All the authors are employees of Ajinomoto Co., Inc.
Funding
None.
Ethical approval
The protocol was approved by the Ethical Committee of Mitsui Memorial Hospital, Ref. MEC2005-13.
Guarantor
AI.
Contributorship
HY1(Hiroyuki Yamamoto) and KK contributed equally to this work. HY1 and AI performed the statistical analysis; KK and HY2 (Hiroo Yoshida) analysed the amino acids; TM and TT determined the exclusion criteria and reference individuals; KN, YN and HM coordinated the study; HY1 and KK wrote the manuscript. All the authors have read and approved the final manuscript.