
Abstract
Background
Neuroendocrine tumours are slow growing tumours known to secrete a variety of vasoactive peptides which give rise to symptoms of the carcinoid syndrome. The diagnosis and monitoring of patients with neuroendocrine tumours is undertaken in many centres using 24 h urinary measurement of 5-hydroxyindoleacetic acid. However, 5-hydroxyindoleacetic acid can also be quantified in plasma and serum.
Methods
We measured 5-hydroxyindoleacetic acid concentration in 134 paired EDTA plasma and urine samples from 108 patients with known neuroendocrine tumours and 26 healthy volunteers. We also compared 5-hydroxyindoleacetic acid concentrations in paired serum and plasma samples (n = 63), then analysed paired urine and serum samples (n = 97). Furthermore, we examined the impact of renal impairment on serum 5-hydroxyindoleacetic acid by analysing 5-hydroxyindoleacetic acid in patients without neuroendocrine tumours in different stages of chronic kidney disease, as indicated by the estimated glomerular filtration rate.
Results
Plasma and urine 5-hydroxyindoleacetic acid had very similar diagnostic sensitivities and specificities, with areas under the curve on ROC analysis of 0.917 and 0.920, respectively. Serum and plasma 5-hydroxyindoleacetic acid values showed good correlation but serum results demonstrated a positive bias, indicating the necessity for different serum and plasma reference intervals. There was an inverse correlation between estimated glomerular filtration rate and serum 5-hydroxyindoleacetic acid concentration, with 5-hydroxyindoleacetic acid increasing once the estimated glomerular filtration rate falls below 60 mL/min/1.73 m2.
Conclusion
The measurement of both serum and plasma 5-hydroxyindoleacetic acid can be used for the diagnosis and monitoring of patients with neuroendocrine tumours. Provided renal function is taken into consideration, either of these tests should be incorporated into standard practice as an alternative assay to urinary 5-hydroxyindoleacetic acid.
Keywords
Introduction
Neuroendocrine tumours (NETs) are neoplasms arising from neuroendocrine cells. They are most commonly found in the GI tract and bronchopulmonary system, 1 and can be classified into foregut, midgut and hindgut. 2 Foregut tumours occur in the stomach, bronchus, duodenum, pancreas or thymus, midgut tumours arise in the jejunum, ileum, appendix or ascending colon, and hindgut tumours are found in the transverse and distal colon and the rectum. NETs may be non-functioning, when they present with symptoms of tumour mass, or functioning, when they secrete a variety of physiologically active substances, including serotonin (5HT) and its metabolite 5-hydroxyindole acetic acid (5-HIAA), as well as bradykinins, prostaglandins and tachykinins.3,4 The pattern of peptide secretion varies with tumour location; the majority of tumours secreting 5-HT and 5-HIAA arise from the midgut; this secretion pattern is rarely seen with hindgut tumours. Urine 5-HIAA measurement is commonly used in the diagnosis of midgut and foregut NETs, with good diagnostic sensitivity and specificity,5,6 particularly in patients with metastatic disease 7 and its measurement is recommended by the UK and Ireland Neuroendocrine Tumour Society, 8 the European Neuroendocrine Tumour Society 9 and the North American Neuroendocrine Tumour Society 10 for the diagnosis and management of NET. Plasma11–13 and serum 14 5-HIAA measurement has been shown to correlate well with urine 5-HIAA, and blood sampling is often preferred by patients to 24 h urine collections. There are health and safety issues with 24 h urine collections for 5-HIAA, as many laboratories state that samples must be collected into acid-containing bottles, and incomplete collections can give misleading results. We assessed the suitability of plasma 5-HIAA for the diagnosis and monitoring of NET in our patient population by analysing paired plasma and urine samples. We also compared serum with plasma by measuring 5-HIAA in paired serum and plasma samples, and in paired serum and urine samples.
5-HIAA is eliminated in the urine, with almost complete extraction of the molecule during a single passage of blood through the kidney. 15 Loss of renal function will therefore decrease the urinary excretion of 5-HIAA, causing an increase in plasma concentrations. This could potentially decrease the specificity of the plasma test in patients with decreased renal function, a phenomenon also seen with chromogranin A, another useful marker of NETs.16,17 We assessed the extent of this issue by measuring serum 5-HIAA concentrations in samples from patients without NETs with a range of estimated glomerular filtration rate (eGFRs).
Methods
Comparison of plasma and urine 5-HIAA
Plasma and urine 5-HIAA were both analysed by liquid chromatography-tandem mass spectrometry (LC-MS/MS) as previously described.13,18 Urine samples were collected into plastic bottles containing 50 mL of 2 mol/L hydrochloric acid. Plasma samples were collected into potassium EDTA tubes (BD Vacutainer K2E 7.2 mg, BD, Oxford UK) and centrifuged within 6 h of collection for 10 min at 2876 g. The CVs of the urine assay were 8.7%, 4.3% and 3.2% at mean concentrations of 28.4 µmol/L, 172.4 µmol/L and 321.5 µmol/L, respectively. The plasma assay had CVs of 7.7%, 6.3% and 6.2% at mean concentrations of 128.8, 255.7 and 513 nmol/L respectively. Sample analysis was performed by HCPC-registered Clinical Scientists and Biomedical Scientists, without prior knowledge of any other results or patient details. Paired plasma and urine samples were obtained from two different sources. Samples from 26 healthy controls and 26 patients with known active midgut carcinoid disease were analysed as part of a bone density study, 19 with approval given by the South Yorkshire Research Ethics Committee (REC number 10/H1310/86). The controls were matched to each case by gender, age (±5 years) height (±5 cm) and body mass index (±3 kg/m2). The median age of the volunteers was 65.5 years (IQR 10) and the median age of the carcinoid patients was 64 years (IQR 11). There were 17 males and 9 females within each group. Volunteers were excluded if they had any disease or were taking any medication known to affect bone metabolism e.g. CKD, if they did not have at least 2 evaluable vertebrae visible following DXA scanning, had previously fractured both radii or tibiae, if they were pregnant or trying to conceive, or if they were unable to give informed consent.
A further 82 plasma samples were obtained from a prospective cross-sectional study of biomarkers and carcinoid heart disease, 20 with approval from the Liverpool Research Ethics Committee (REC number 09/H1005/40). All patients with non-pancreatic NETs who visited the outpatient department of University Hospital Aintree NHS Trust, Royal Liverpool and Broadgreen University Hospitals NHS Trust, The Christie NHS Foundation Trust, St James’s University Hospital and Huddersfield Royal Infirmary NHS Foundation Trust between April 2009 and October 2012 were eligible for this study. The inclusion criteria were a diagnosis of a NET with liver metastases and/or carcinoid syndrome and clear visualization of all four valves at echocardiography, exclusion criteria were prosthetic heart valves or inadequate visualization of valves at echocardiography. Samples were only included if a paired 24 h urine sample was taken for 5-HIAA as part of routine patient care. They were collected from 41 male and 41 female patients, with a median age of 69 years (IQR 10.6). The diagnosis of NET was based on histological evidence where available, otherwise diagnosis was made by characteristic appearances on cross-sectional imaging (computed tomography and/or magnetic resonance) and functional (111In-Octreotide scan) imaging. Renal function was not assessed as part of this study.
Comparison of serum and plasma 5-HIAA concentrations
Paired serum and plasma samples (n = 63), collected during the same phlebotomy episode, were taken from the routine samples received in the Biochemistry Department at the University Hospital of South Manchester post routine analysis (as part of standard of care) and anonymized as per Royal College of Pathologists, UK Guidelines. 21 Plasma was collected into potassium EDTA tubes (BD Vacutainer K2E 7.2 mg), serum into serum separator tubes with clot activator (BD Vacutainer SST II Advance), and samples were centrifuged for 10 min at 2876 g. Samples were collected between 16 May 2012 and 05 July 2012 and were included if the plasma and serum samples were collected within the sample phlebotomy episode and there was a minimum of 100 µL of serum and plasma remaining after all other required analyses had been performed. The samples were from 39 male patients and 24 female patients, with a median age of 56 years (IQR 15.7). Samples were analysed by LC-MS/MS 13 after storage at −20℃ for a maximum of three months. Samples have been shown to be stable for at least 18-months under these conditions. 22
Comparison of serum and urine 5-HIAA
Paired serum and 24 h urine samples (n = 97) were obtained from patients attending the NET Clinic at The Christie NHS Foundation Trust between 18 June 2010 and 22 February 2013, and 5-HIAA was quantified in the samples as above.13,18 Patients were included if they had serum and urine 5-HIAA samples taken within three days of each other. Serum samples were collected into serum separator tubes with clot activator, and serum was stored at −20℃ for a maximum of three-months prior to analysis. 24 h urine samples were collected into plastic bottles containing 50 mL 2 mol/L hydrochloric acid and analysed within one-week of collection. Twenty-nine patients with eGFR below 60 mL/min/1.73 m2 were excluded, leaving 68 patients, 43 male and 25 female with a median age of 61.5 years (IQR 22.6).
Serum 5-HIAA and eGFR
A total of 350 serum samples were selected from routine samples sent to the Clinical Biochemistry Laboratory of University Hospital of South Manchester NHS Foundation Trust, between 16 May 2012 and 05 July 2012. They were selected according to the eGFR result that was part of the routine requesting protocol, with 50 samples in each of the eGFR categories (<20 mL/min, 20–29 mL/min, 30–39 mL/min, 40–49 mL/min, 50–59 mL/min, 60–89 mL/min and >90 mL/min). The first 50 samples within each eGFR group were included. Samples were anonymized as per Royal College of Pathologists, UK, Guidelines. 21 Serum 5-HIAA was quantified by LC-MS/MS. 13 Creatinine was measured using the kinetic alkaline picrate method on the Abbott Architect Plus (Abbott Laboratories Ltd, Maidenhead, Berkshire UK). The eGFR was calculated from the creatinine result using the MDRD equation (175 × serum creatinine × 0.011312)−1.154 × age−0.203 (×1.212 if African American) (×0.742 if female).23,24
Statistical analysis
All statistical analyses were carried out using Analyse-it software (Analyse-it Software Ltd, Leeds, UK).
Results
Comparison of plasma and urine 5-HIAA
Plasma and urine 5-HIAA results were compared as percentages of the upper limit of the reference interval (ULRI) for each test, using 118 nmol/L as the ULRI for plasma13,25 and 45 µmol/h as the ULRI for urine (adapted from literature
26
). Calculated sensitivity of urine was 74.1% (80 true positive, 28 false negative) compared to 79.6% for plasma (86 true positive, 26 false negative). In this population with liver metastases and/or carcinoid syndrome ROC curve analysis gave an area under the curve (AUC) of 0.920 (95% CI 0.873–0.967) for urine and 0.917 (95% CI 0.871–0.964) for plasma (Figure 1).
Receiver Operating Characteristic (ROC) curves for urine (a) and plasma (b) 5-HIAA. The sensitivity and specificity for each sample type are plotted at different cutoffs. The area under the curve for urine was 0.920 (95% CI 0.873–0.967), and for plasma was 0.917 (95% CI 0.871–0.964). For a cutoff of 45 µmol/L, the calculated sensitivity of the urine assay was 74.1% with a specificity of 96.2%. For the plasma assay, with a cutoff of 118 nmol/L, the calculated sensitivity was 79.6% with a specificity of 100%.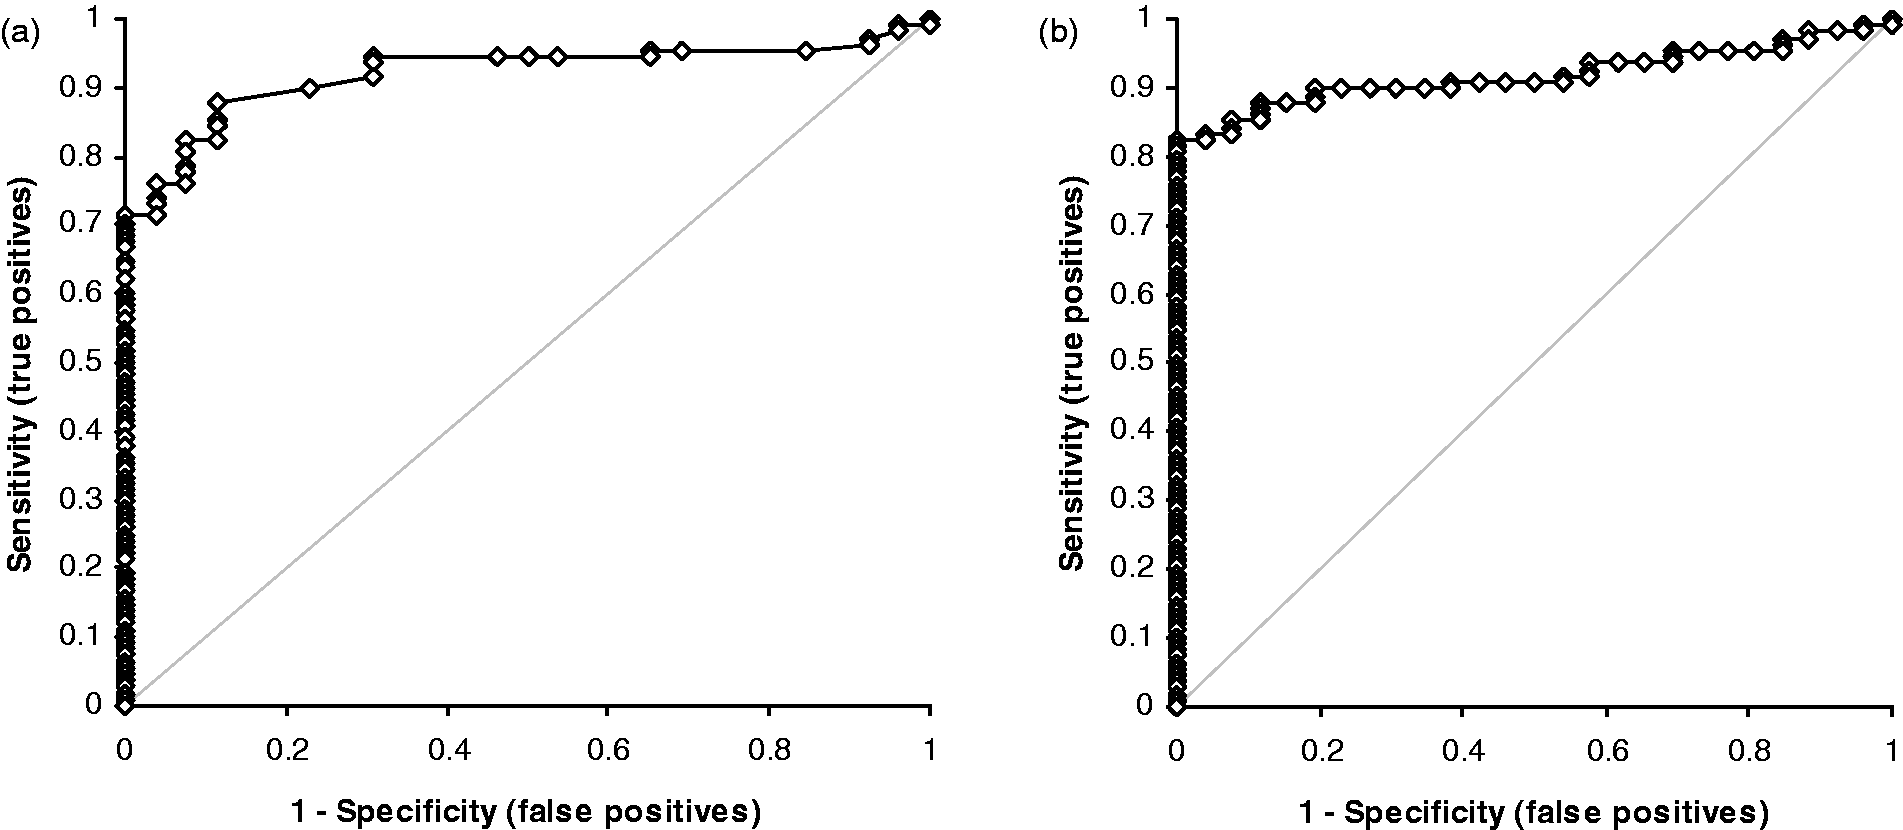
Comparison of serum and plasma 5-HIAA
The concentration of 5-HIAA was significantly higher in serum samples compared to plasma (P < 0.0001, Wilcoxon signed ranks test). Bland-Altman analysis showed a positive bias of 21.1 nmol/L in serum compared to plasma, with a Passing-Bablok regression equation of serum = 1.1182 × plasma + 1.1452 nmol/L (Figure 2). The mean percentage difference between plasma and serum was 11.7%. To take this into account, the Bland-Altman data was used to set the ULRI 140 nmol/L for serum, compared to 118 nmol/L for plasma 5-HIAA.
Comparison between plasma and serum 5-HIAA concentrations. Bland-Altman analysis gave a mean positive bias of 21.1 nmol/L for serum compared to plasma (95% CI 13.8–28.4). Passing-Bablok analysis gave a regression equation of serum = 1.1182 × plasma + 1.1452 nmol/L.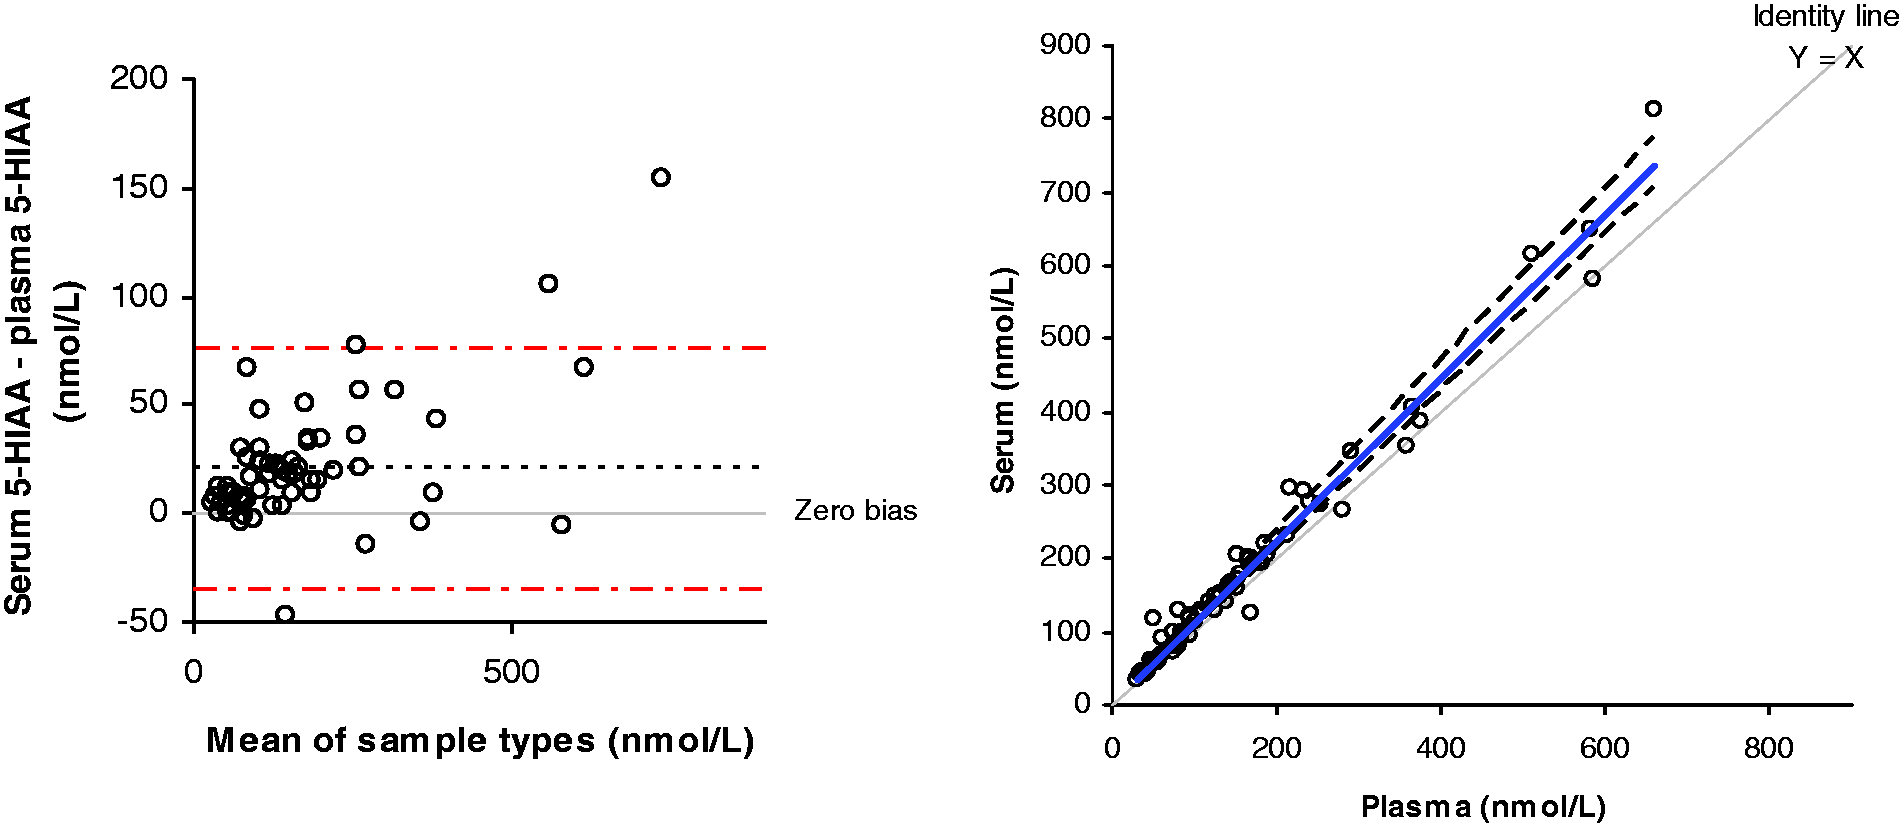
Comparison of serum and urine 5-HIAA
The concentration of 5-HIAA was found to be above the ULRI in both serum and urine for 39 pairs of samples (57.3%), and within the reference interval for 26 pairs of samples (38.2%). Three patients (4.4%) had a normal urine 5-HIAA result but a raised serum 5-HIAA value. In total, there was concordance between the urine and serum results for 95.5% of patients. Log10 urine and serum 5-HIAA are plotted in Figure 3.
Comparison of serum and urine 5-HIAA. Log10 urine 5-HIAA is plotted against log10 serum 5-HIAA. The top of the reference interval for urine is shown by dashed line A; the top of the reference interval for serum is shown by dotted line B.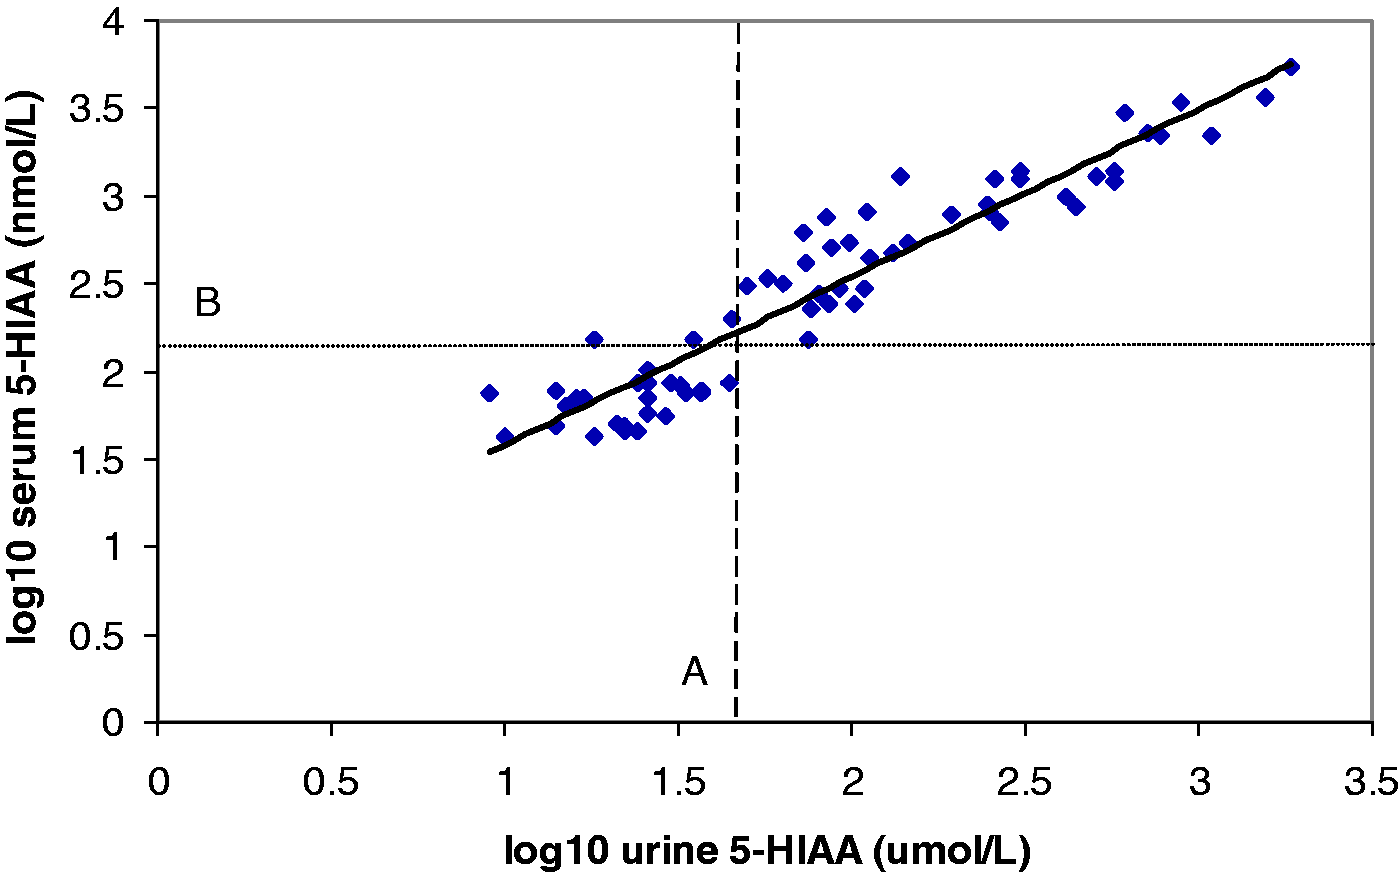
Serum 5-HIAA and eGFR
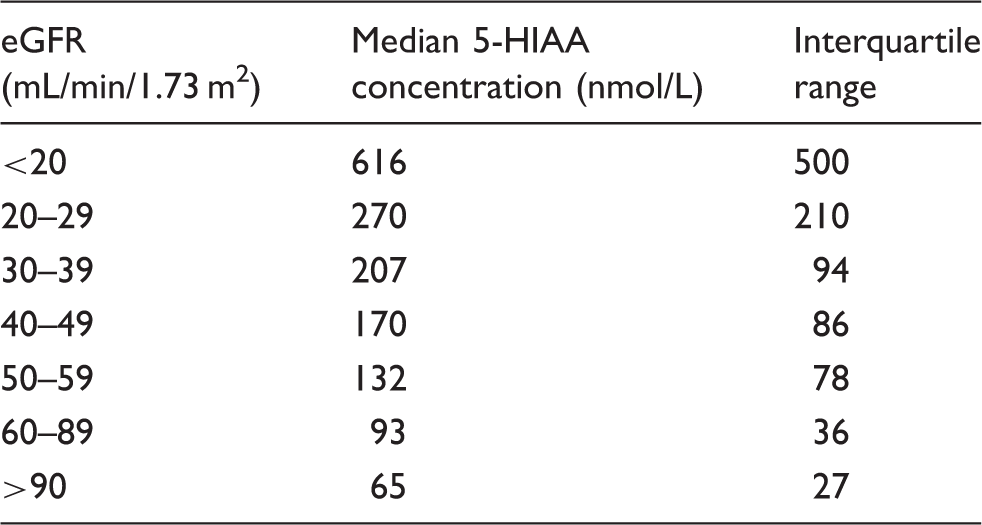
Linear regression analysis of log10 transformed data showed a negative correlation between 5-HIAA and eGFR, with an equation of log10 serum 5-HIAA = −1.017(log10 eGFR) + 3.877, with a coefficient of determination R2 value of 0.66. The mean 5-HIAA concentration in patients with an eGFR of greater than 90 mL/min is 68 nmol/L, increasing to 712 nmol/L in patients with eGFR below 20 mL/min/m2 (Figure 4, Table 1).
Linear regression analysis of serum 5-HIAA and eGFR. The solid line is the line of linear fit, with an equation of log10 5-HIAA = 3.877−1.017 × eGFR. The dotted line shows the 95% confidence interval, whilst the dashed line indicates the 95% prediction interval. The median 5-HIAA concentration in each eGFR grouping is shown along with the inter-quartile range.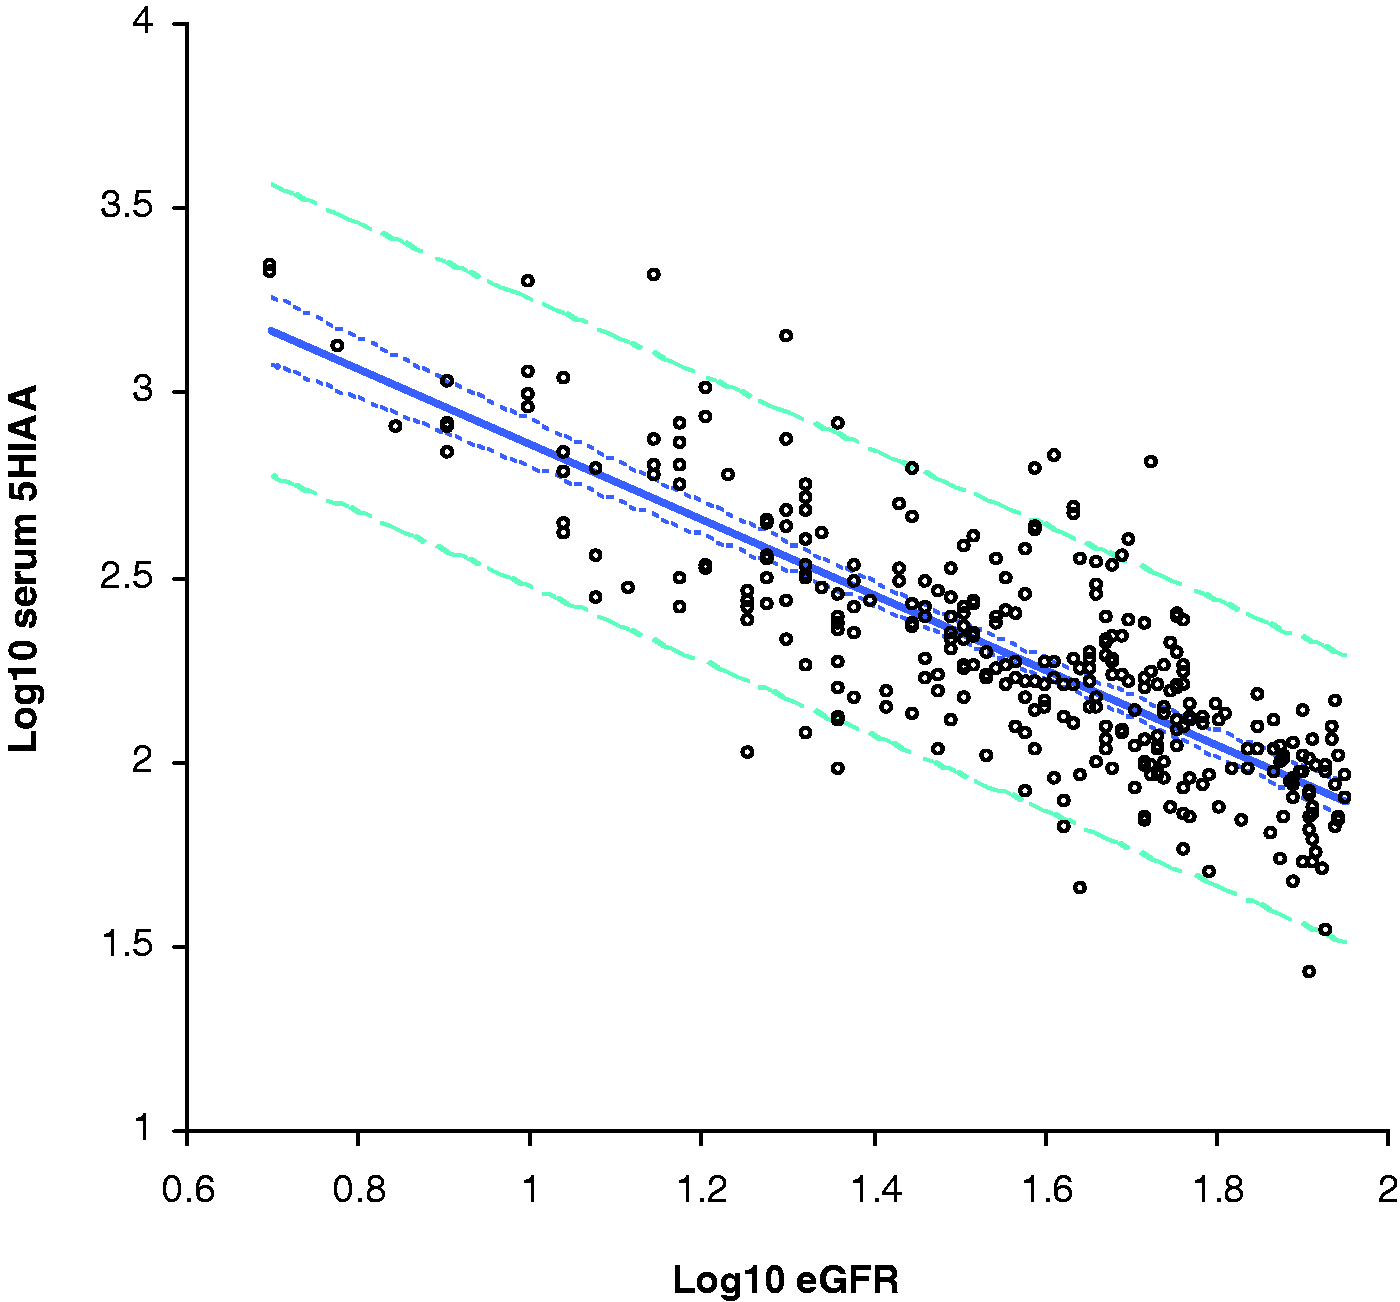
Discussion
Quantification of 5-HIAA in urine is currently recommended by UK, European and American Neuroendocrine Tumour Societies for the diagnosis and monitoring of NETs. However, the collection of 24 h urine samples is time-consuming and prone to errors during collection, with both over-collection and under-collection of urine a problem. In addition, it can be confounded by dietary influences. There is also inconvenience with respect to collection and impact on daily life during the period of collection, as well as difficulties for patients attending specialist units from afar. Using serum or plasma samples for 5-HIAA quantification avoids the need for a 24 h urine collection, and it has been shown that patients only need to avoid serotonin-containing foods for 24 h prior to blood sampling, 27 rather than the three-day dietary restriction that is currently recommended for 24 h urine collections. 8 We compared plasma 5-HIAA to urine 5-HIAA in 134 paired samples. Using the current reference intervals, of <118 nmol/L for plasma and <45 µmol/24 h for urine, the diagnostic sensitivities and specificities were similar for plasma and urine. Despite the low number of controls used in this study, the diagnostic sensitivities and specificities were similar to those found by Carling et al. 12 ROC curve analysis showed similar AUC for both sample types, confirming the findings of Tohmola et al., 14 indicating that EDTA plasma is a suitable sample type for measurement of 5-HIAA.
The majority of samples received in our routine service laboratory are serum samples rather than plasma. It was therefore decided to investigate the suitability of serum as a sample type for 5-HIAA analysis, in order to minimize the number of different blood samples required from patients. The concentration of 5-HIAA was higher in serum than in EDTA plasma in our assay; this may be due to leakage for 5-HIAA from cells during the clotting process. Due to this we adjusted the ULRI for serum 5-HIAA to 140 nmol/L compared to 118 nmol/L in EDTA plasma. This is similar to the serum reference interval of Tellez et al., 11 which has an upper limit of 123 nmol/L. We then compared 5-HIAA in routine urine and serum samples from patients in a specialist NET clinic. As there was no definitive diagnosis for these patients, we were unable to calculate the diagnostic sensitivity and specificity for serum 5-HIAA. However, we calculated the diagnostic concordance between urine and serum, and found that the two sample types gave identical results (above or below the ULRI) in 95.5% of patients. A positive serum result was seen in 4.4% of patients who also had a negative urine result. As 5-HIAA is used as a first line diagnostic test, with further confirmation by imaging and histological tests, it is important to maximize the sensitivity of the test; therefore, these results indicate that serum is an appropriate sample type for 5-HIAA analysis in the diagnosis of NETs and can be used as an alternative to urinary 5-HIAA measurement.
Our institution has used the serum 5-HIAA assay in our routine service laboratory since October 2012, and the number of requests has increased over time, from 713 in 2013 to 1210 in 2014, and we now analyse on average 23 samples per week. The performance of the assay is good, with CVs of 7.6% and below for concentrations of 125, 250, 500 and 5000 nmol/L over a two-year period. Anecdotally, the patients in the clinic much prefer the blood test to collecting 24 h urine samples.
Because 5-HIAA is eliminated in the urine, we investigated the effect of renal function on serum 5-HIAA concentrations. Linear regression analysis of log10 transformed data showed a strong negative correlation between renal function, as estimated by eGFR, and 5-HIAA concentration, with a coefficient of determination R2 value of 0.66, similar to the findings of Hannedouche et al. 15 The median 5-HIAA concentration was calculated for each group, and this gave a median 5-HIAA concentration of 65 nmol/L for samples with eGFR >90 mL/min/1.73 m2 and 93 nmol/L for samples with eGFR >60 mL/min/1.73 m2, but once the eGFR fell below this level, the median 5-HIAA increased above the reference interval of 140 nmol/L, to 170 nmol/L in samples with eGFR 40–49 mL/min/1.73 m2, rising to 616 nmol/L in patients with eGFR below 20 mL/min/1.73 m2 (Table 1). If these results were interpreted without reference to renal function, the majority of patients with eGFR below 60 mL/min/1.73 m2 (CKD stages 3A to 5) would have a plasma 5-HIAA result consistent with a NET and be subjected to further unnecessary investigations. In addition, patients with a high eGFR may have a falsely low serum 5-HIAA due to increased renal clearance. This population would be very difficult to assess, as the MDRD equation underestimates eGFR in patients with normal renal function, therefore laboratories do not report the value of eGFRs greater than 90 mL/min/1.73 m2. This is also a problem for other NET markers such as Chromogranin A16,17 and cocaine and amphetamine related transcript (CART). 17 Fortunately, the majority of NET patients do not have very low eGFRs, so although this phenomenon is important to characterize, it has little effect in routine practice.
In conclusion, plasma and serum are both suitable sample types for the 5-HIAA measurement in the diagnosis and monitoring of patients with NETs and we believe that their use in this context should be adopted routinely. In a routine service laboratory, the performance of the serum 5-HIAA assay is good. However, because there was a higher concentration of 5-HIAA in serum compared to EDTA plasma samples in our assay, it is therefore important to be aware of the different reference intervals for each sample type. In addition, renal function has a substantial effect on serum 5-HIAA concentrations, and this must be taken into account when interpreting results.
Footnotes
Declaration of conflicting interests
The author(s) declared no potential conflicts of interest with respect to the research, authorship, and/or publication of this article.
Funding
The author(s) disclosed receipt of the following financial support for the research, authorship, and/or publication of this article: JW received a Biomedical Research Unit grant from the National Institute of Health Research.
Ethical approval
Liverpool Research Ethics Committee (REC number 09/H1005/40). South Yorkshire Research Ethics Committee (REC number 10/H1310/86).
Guarantor
JEA.
Contributorship
BGK, PJT, DJC, JWV conceived the study. RD, JW, PJM provided patient samples and demographic information and carried out some statistical analysis. JEA carried out analytical work and wrote the first draft of the paper, all authors reviewed and edited the manuscript and approved the final version.
Acknowledgments
None.