
Abstract
Background
The primary hyperoxalurias are inherited disorders of glyoxylate metabolism, which cause over-production of oxalate leading to urolithiasis and subsequent renal failure. Other metabolites may be produced in excess in the different forms of PH: glycolate in PH1, glycerate in PH2 and 4-hydroxy-2-oxoglutarate and 2,4-dihydroxyglutarate in PH3. The aim of this study was to set up and validate a method for the simultaneous analysis of these metabolites in urine and to evaluate its use for preliminary identification of primary hyperoxaluria prior to definitive diagnosis by genetic testing.
Methods
Urine samples were derivitized by methoximation and silylation and extracted into organic solvent prior to analysis by gas chromatography mass spectrometry.
Results
Recovery of the analytes spiked into urine ranged from 91 to 103% and total analytical imprecision ranged from 3.0 to 13.6%. 4-Hydroxy-2-oxoglutarate was unstable in urine at room temperature, and preservation by acidification was required. Mean urinary glycolate, glycerate and 4-hydroxy-2-oxoglutarate or 2,4-dihydroxyglutarate (expressed as a ratio to creatinine) were significantly higher in patients with PH1, PH2 and PH3, respectively. Low 4-hydroxy-2-oxoglutarate was observed in some patients with PH3, probably due to the instability of this analyte, but all PH3 patients had elevated 2,4-dihydroxyglutarate. During five months of routine service, seven cases of PH were identified by this method and subsequently confirmed by gene sequencing including two with novel mutations in HOGA1.
Conclusions
This study confirms that the method is useful in aiding the diagnosis of primary hyperoxaluria and can direct genetic testing.
Introduction
The primary hyperoxalurias (PH) are rare inherited metabolic diseases of glyoxylate metabolism, which cause excess production of oxalate and thus lead to increased oxalate excretion in the urine. 1 Hyperoxaluria is a well-recognized risk factor for calculus formation 2 because of the very low solubility of calcium oxalate, leading to urine supersaturation and crystallization. Patients with PH suffer renal damage directly via oxalate toxicity to renal tubular cells and indirectly as a result of the urolithiasis. 3 The disease is progressive and can lead to end-stage renal failure (ESRF), after which the excess oxalate starts to be deposited around the body (systemic oxalosis). The first-line test for PH is urine oxalate, but this test is not diagnostic because hyperoxaluria is more commonly secondary to exogenous oxalate, either from increased intake (oxalate is found in many foodstuffs) or due to fat malabsorption. 4 Even when secondary causes have been excluded, definitive diagnosis of PH requires gene sequencing (for all three types) or enzyme activity analysis in a liver biopsy (for PH1 and PH2). Genetic testing employing Sanger sequencing methodology has a relatively high cost per test, and liver biopsy is an invasive procedure with an associated, albeit low, burden of morbidity. Therefore, a ‘diagnostic testing gap’ exists between the initial screening test and the definitive tests. Other urine metabolites have been shown to be present in excess in these diseases including glycolate in PH1, 5 glycerate in PH2, 6 and 4-hydroxy-2-oxoglutarate (HOG) and 2,4-dihydroxyglutarate (DHG) in PH3. 7
PH type 1 (Online Mendelian Inheritance in Man [OMIM] #259900) is caused by a deficiency of the peroxisomal enzyme alanine glyoxylate aminotransferase (AGT), encoded by AGXT, which catalyses the conversion of glyoxylate to glycine. Deficiency of AGT leads to a build-up of glyoxylate, which is converted to oxalate by lactate dehydrogenase (LDH) and to glycolate by glyoxylate reductase (GR). Elevated urine glycolate has been described in approximately three-quarters of cases of PH1, 5 but it can also be derived from dietary sources. 8 It has been quantified colourimetrically 9 and enzymatically using glycolate oxidase (GO). 10 Glycolate can also be detected by organic acid analysis using gas chromatography (GC); 11 however, it is poorly extracted into the solvent systems normally used. 12
PH type 2 (OMIM 260000) is caused by mutations in GRHPR, which encodes GR. GR has both glyoxylate and hydroxypyruvate reductase activities and deficiency thus leads to accumulation of both substrates. LDH converts the excess substrates to oxalate and
PH type 3 (OMIM 613616) is caused by mutations in HOGA1, encoding the mitochondrial enzyme 4-hydroxy-2-oxoglutarate aldolase (HOGA). This enzyme catalyses the cleavage of HOG, a metabolite of collagen degradation, into pyruvate and glyoxylate. It has been demonstrated that the PH3 phenotype is associated with loss-of-function mutations in HOGA1. 15 The mechanism by which oxalate over-production occurs in PH3 is not definitively known. The accumulation of HOG may be involved in the pathogenesis; hypotheses include extra-mitochondrial degradation of HOG to oxalate 7 and inhibition of GR by HOG, which would cause a PH2-like state. 16 Outcomes in PH3 are thought to be more favourable, 17 and only one case of PH3 has been reported to have ESRF. 18 However, the level of hyperoxaluria in PH3 overlaps with PH1 and PH2, 19 so the natural history may not yet be clearly defined for this relatively newly described disease. Prevalence estimates from public whole exome sequencing in the USA give a figure of ∼7 per million for PH3, 18 which is much higher than the reported prevalence of PH1 (∼1 per million in Europe 20 ) or PH2. It is possible that there are a significant number of undiagnosed cases of PH3 amongst renal stone patients, who perhaps have not been worked up for PH because of a lack of renal damage. Measurement of HOG and its reduced metabolite DHG in urine is possible using GCMS. 7 An alternative method for HOG by ion-exchange chromatography coupled to mass spectrometry that does not require derivitization has been published. 16 At present these investigations are not in routine use in the UK, and gene sequencing is the only available test for diagnosing PH3.
The aims of this study were to set up a method for the measurement of the urinary PH metabolites (PHM) glycolate, glycerate, HOG and DHG for use in the preliminary investigation of patients with hyperoxaluria of unknown cause, to evaluate its ability to differentiate between the three forms of PH and to demonstrate that it can be used for case detection.
Methods
Calibrator preparation
Stock solutions of glycolate (glycolic acid >99%, Sigma-Aldrich), glycerate (
Sample analysis
Where samples had been preserved by acidification, they were adjusted to pH 7–9 prior to analysis using 1 mol/L NaOH, added drop wise. The analysis method was adapted from Belostotsky et al. 7 To 200 µL of sample or calibrator was added 20 µL of methoximation reagent (a 1 mol/L solution of methoxyamine hydrochloride, Aldrich, adjusted to pH 9 with 25% ammonia, VWR) and 10 µL of internal standard solution. Tubes were incubated at 60℃ for 1 h and then allowed to cool to room temperature. To each tube was added 10 µL of 6 mol/L HCl, enough sodium chloride (≥99.0% Sigma Aldrich) to saturate and 1 mL of a 5:1 mixture of ethyl acetate and propan-2-ol (both AnalaR Normapur, VWR). After vortex mixing for 1 min to extract the compounds and centrifugation at 3000 rpm for 5 min to aid phase separation, the organic fraction was removed to another glass tube and evaporated to dryness. To the dried extracts were added 75 µL of silylation reagent (BSTFA + TMCS 99:1, Supelco) and 20 µL of pyridine (Emsure ACS reagent grade, Merck). Tubes were incubated at 60℃ for 40 min and then allowed to cool to room temperature. Each tube was diluted with 100 µL of cyclohexane (AnalaR Normapur, VWR), centrifuged to remove any precipitate and the supernatant transferred to a glass GC vial. A Shimadzu GCMS-QP2010S instrument with an HP-5 ms capillary column was used with helium carrier gas at a total flow rate of 5.4 mL/min (76.5 kPa). The sample (1 µL) was injected in splitless mode. The column temperature was held at 66℃ for 1 min, and then ramped at 4℃/min to 100℃, followed by 12℃/min to 220℃ and 20℃/min to 300℃. Total run time was 30 min per injection including equilibration between samples. The detector was operated in single-ion monitoring mode. Urine creatinine was measured on a Cobas 8000 autoanalyser (Roche diagnostics GmbH, Mannheim, Germany) using a kinetic Jaffé reaction according to the manufacturer’s instructions.
Data analysis
Chromatograms (an example is shown in Figure 1) were analysed by the Shimadzu post run analysis software and peak integration carried out automatically with a minimum slope of 50 min−1 and minimum width of 1 s. The analytes of interest were identified by the parameters in Table 1. DHG appears as two peaks: one for the mesoisomer (2S,4R-DHG) and one for the mixture of stereoisomers (2R,4R- and 2S,4S-DHG). The latter peak was chosen for quantitation because it was found to consistently have much larger peak areas in urine from patients with PH3. Results were analysed using Excel (Microsoft Corporation, Redmond, USA). Imprecision was estimated by ANOVA using the method validation statistics templates available from the Association for Clinical Biochemistry and Laboratory Medicine website,
21
and expressed as a coefficient of variation (CV). Means of groups were compared using Student’s t test, and a P value < 0.05 was considered to be statistically significant. Diagnostic sensitivity and specificity were calculated using gene sequencing as the gold standard.
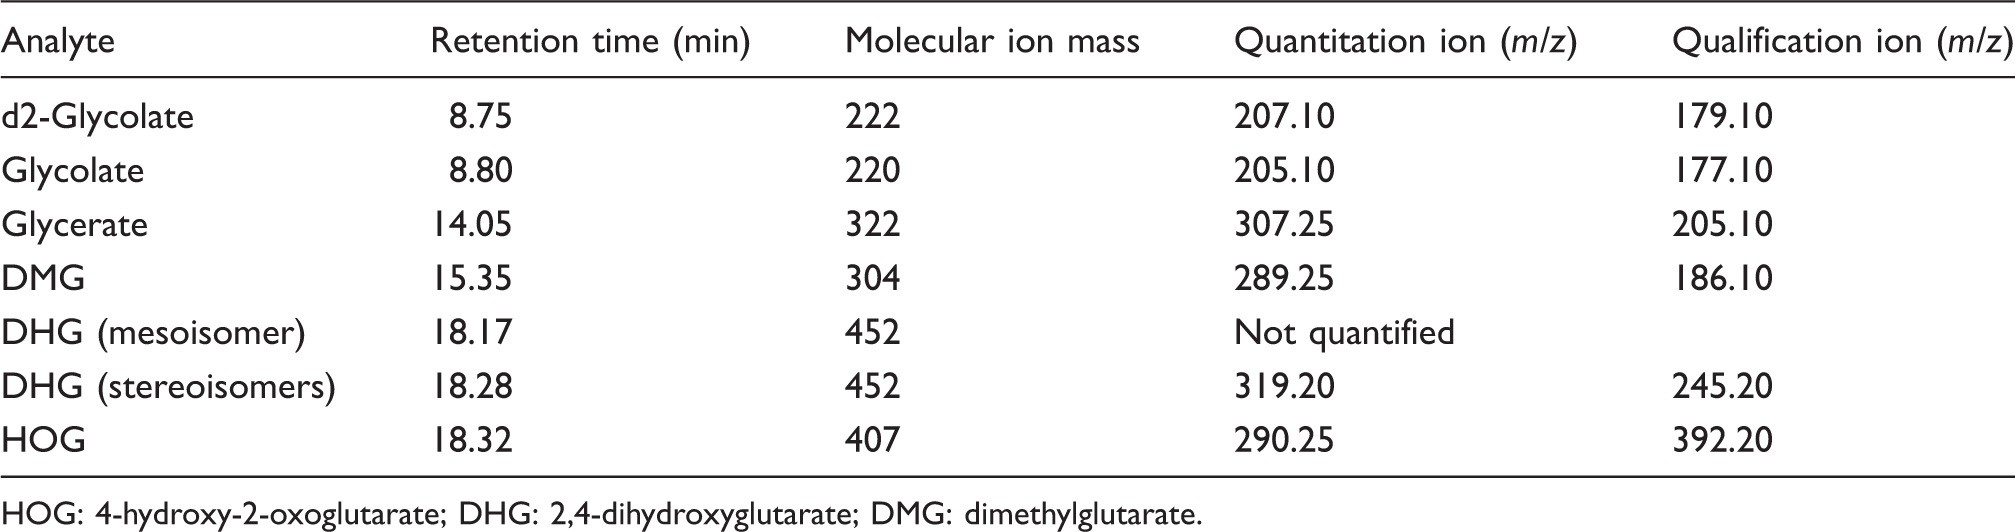
Example chromatogram. Analyte retention times and ions. HOG: 4-hydroxy-2-oxoglutarate; DHG: 2,4-dihydroxyglutarate; DMG: dimethylglutarate.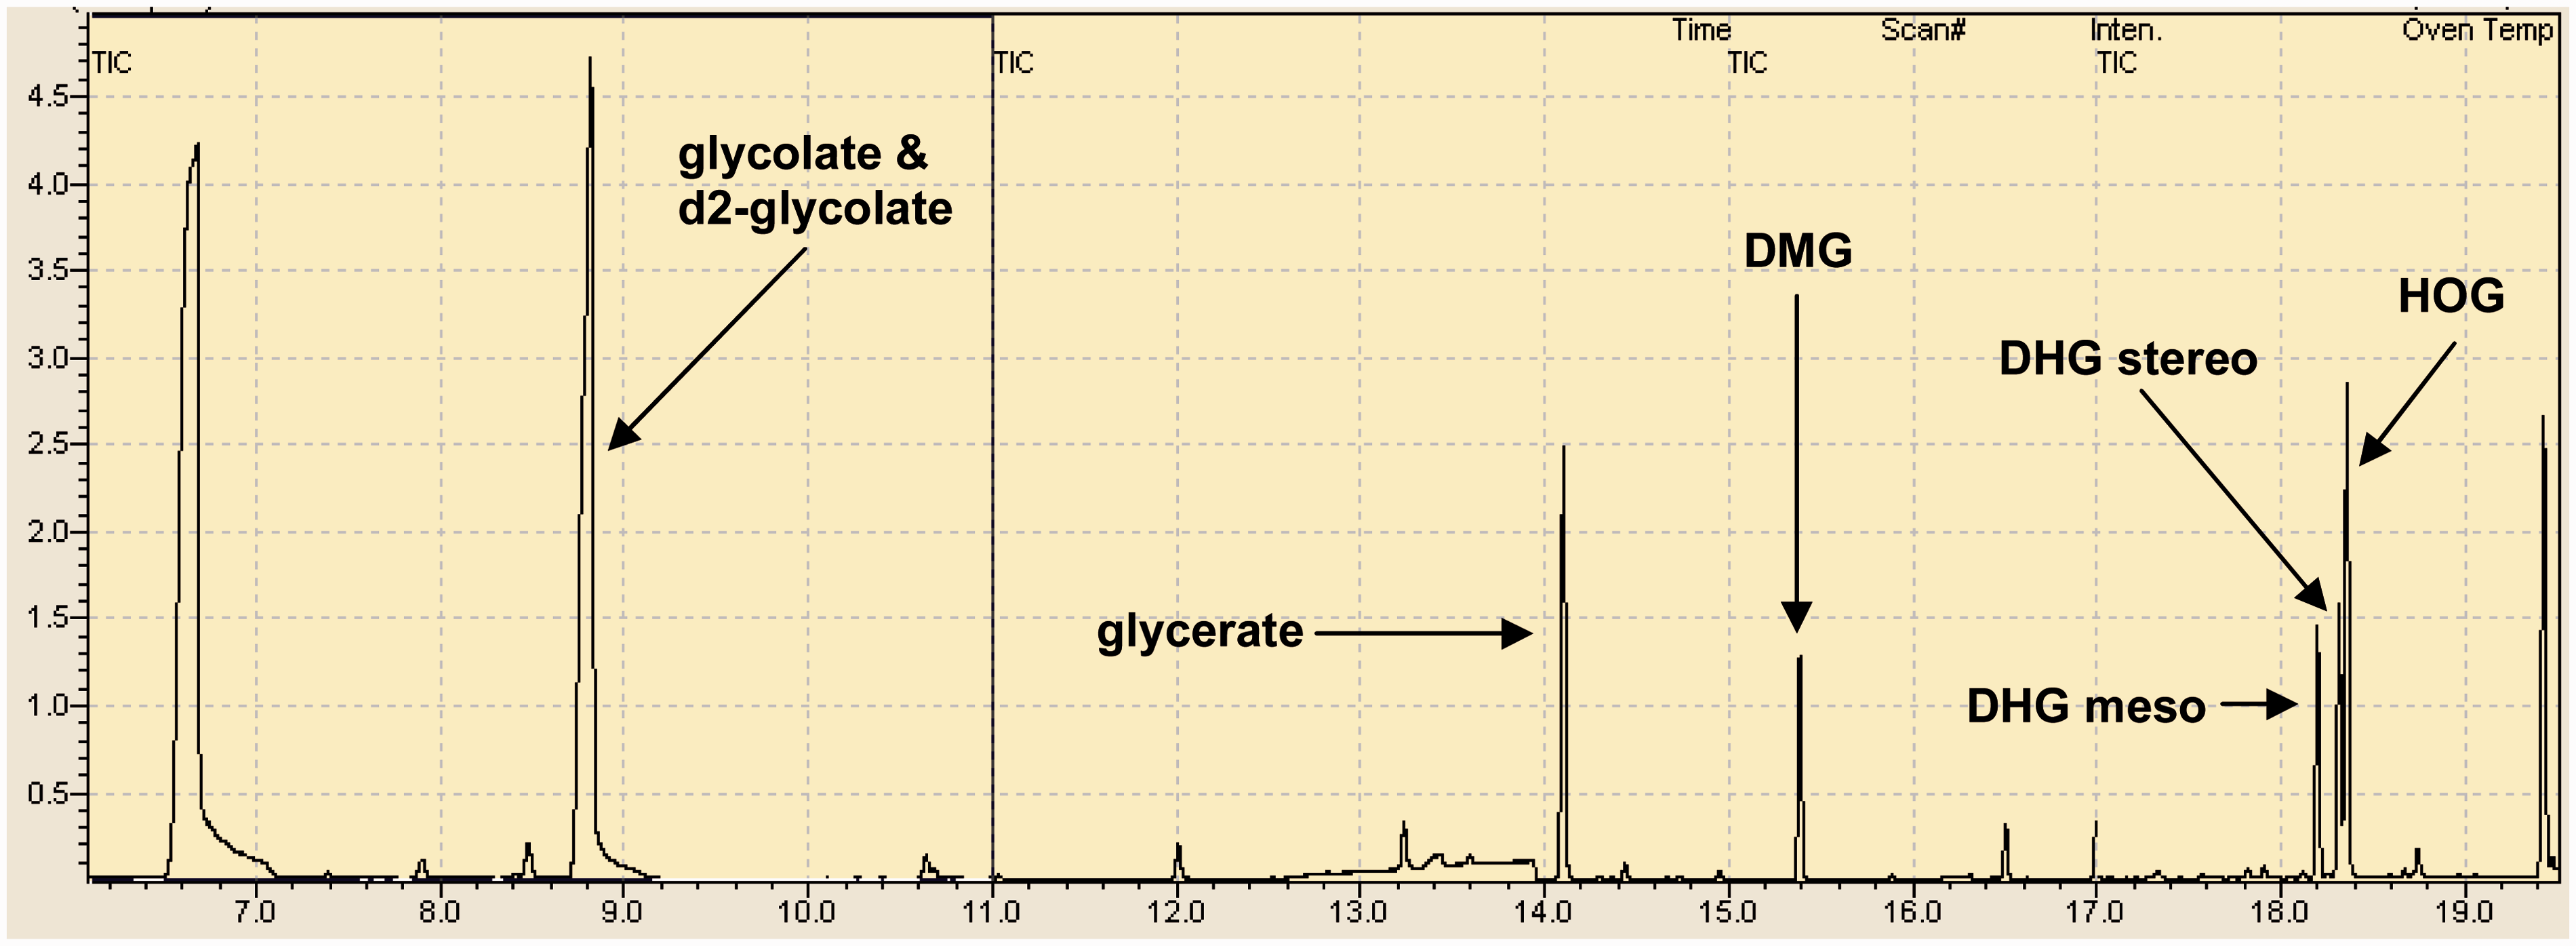
Genetic testing
Gene sequencing of AGXT, GRHPR and HOGA1 was carried out on DNA extracted from leucocytes as previously described.15,22,23 Numbering was based on cDNA sequence NM_000030.2 (AGXT), NM_012203.1 (GRHPR) and NM_138413.3 (HOGA1) with nucleotide #1 denoting the first coding base. Sequence variants were described using Human Genome Variation Society nomenclature (www.hgvs.org/). Novel sequence variants were analysed in silico using Mutation Taster 24 (http://www.mutationtaster.org/), SIFT 25 (http://sift.jcvi.org/www/SIFT_BLink_submit.html) and Polyphen-226 (http://genetics.bwh.harvard.edu/pph2/).
Results
Accuracy and assay linearity
Accuracy was estimated by spiking two urine samples (with low and high concentrations of each analyte) using 10 g/L aqueous standard solutions and calculating the recovery from quadruplicate analysis. Recovery was: 103 ± 2.6% (368 and 597 µmol/L) for glycolate, 101 ± 7.4% (215 and 370 µmol/L) for glycerate, 93 ± 3.2% (85 and 144 µmol/L) for HOG and 91 ± 4.6% (1696 and 2519 µmol/L) for DHG. Linearity above the calibration range was estimated by spiking to a final concentration of three times the top calibrator value for each analyte and making doubling dilutions with blank urine. Defining acceptable recovery as 100 ± 10%, glycolate and glycerate were linear to 1000 µmol/L, HOG was linear to 600 µmol/L and DHG was linear to 3000 µmol/L.
Imprecision and lower limit of quantitation
Imprecision data.
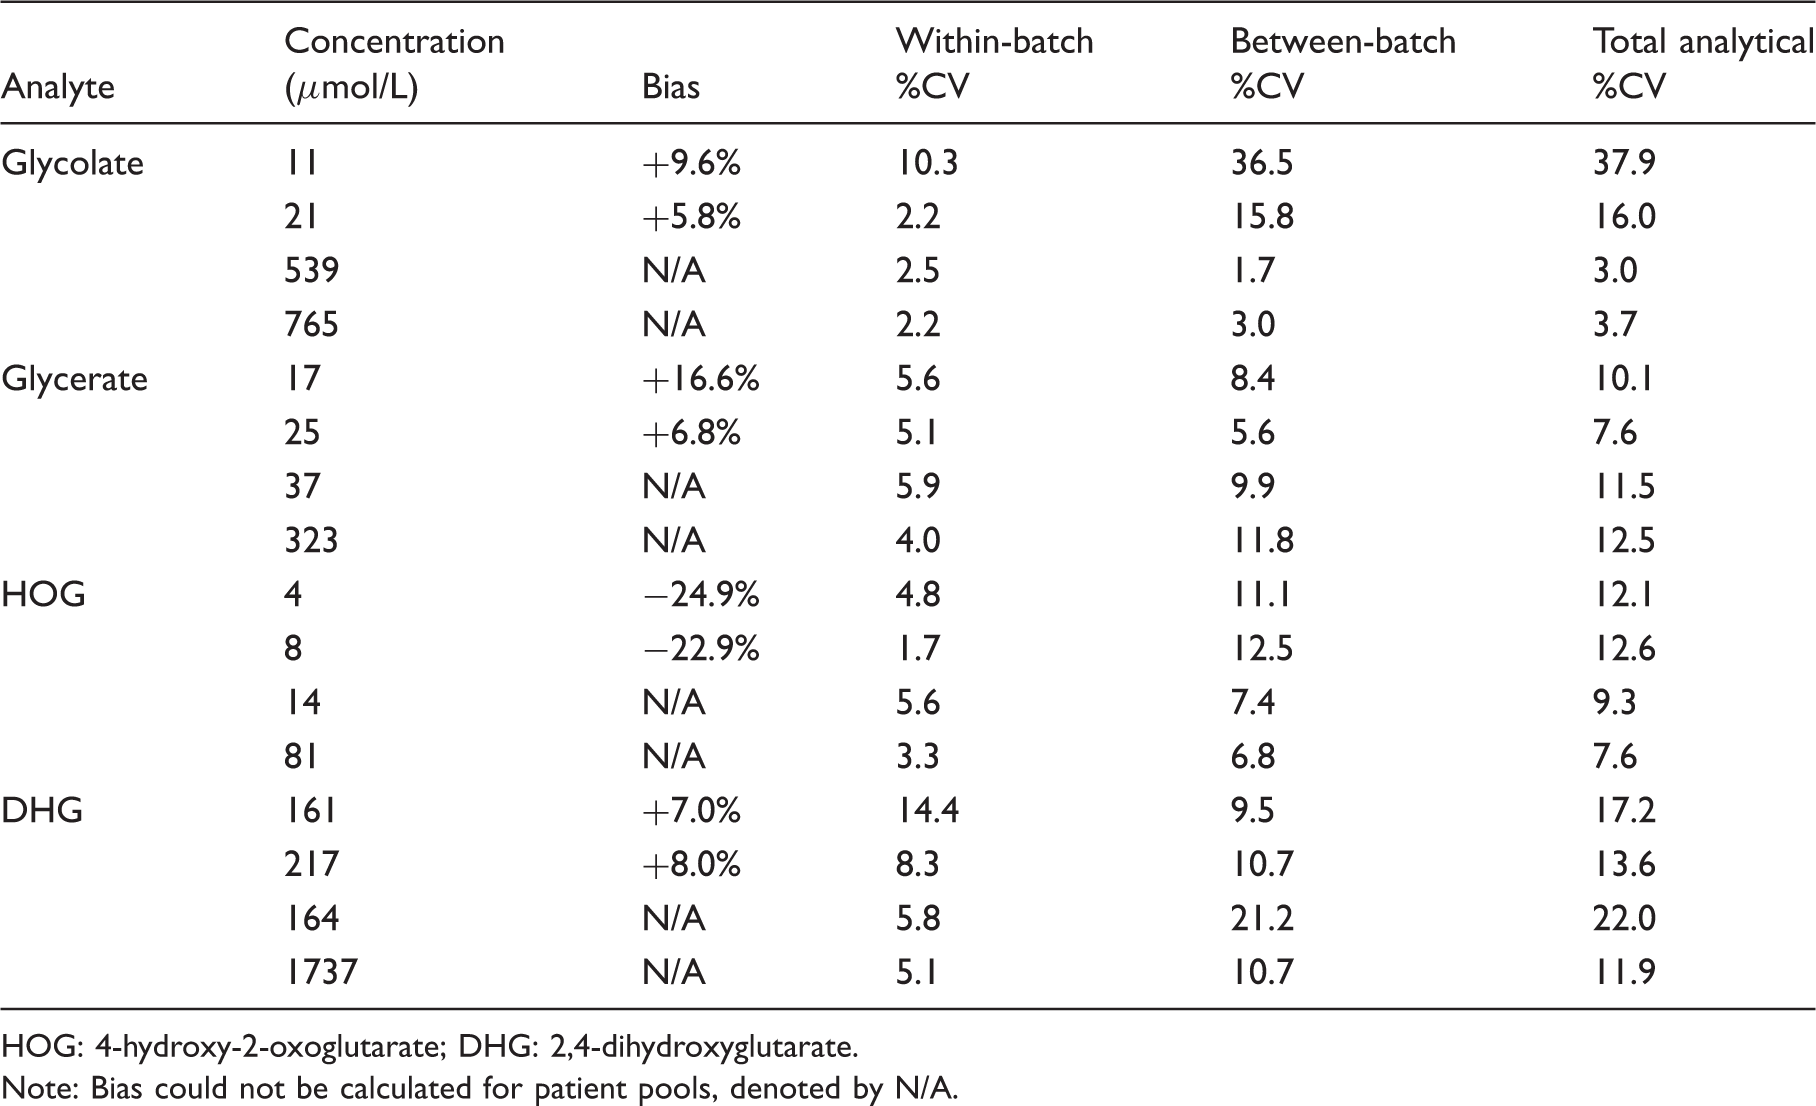
HOG: 4-hydroxy-2-oxoglutarate; DHG: 2,4-dihydroxyglutarate.
Note: Bias could not be calculated for patient pools, denoted by N/A.
Comparison of glycolate results with an enzymatic method
Twenty-nine urine samples previously analysed by the GO method 10 were also analysed by the present method. There was a mean bias of +15% compared to the enzymatic method, which was higher at lower concentrations (+18% up to 200 µmol/L, +11.5% from 200 to 600 µmol/L and +6.5% above 600 µmol/L).
Stability of HOG and DHG in urine
Urine samples from two patients with known PH3 were each divided into two portions and following acidification of one portion to pH 1, aliquots of these samples were stored at 2–8℃ or room temperature. After 3, 7 and 14 days, an aliquot from both storage conditions was removed and frozen prior to analysis in one batch. Results were expressed as a percentage of the baseline, an average of the two urines taken and the results plotted in Figure 2. Up to 90% of measurable HOG was lost over six days in non-acidified samples. Defining ‘stable’ as levels within ±10% of the baseline, HOG was stable for two weeks when preserved by acidification and refrigeration. DHG was stable in all conditions over two weeks. We initially hypothesized that HOG might be reduced to DHG in vitro. However, this hypothesis was refuted because there was no significant change in DHG seen in these samples over time (Figure 2) nor in blank urine artificially spiked with HOG (data not shown).
Stability of (a) HOG and (b) DHG in urine. Solid line: acid urine at 2–8℃, dotted line: acid urine at room temperature, hollow line: plain urine at 2–8℃, dashed line: plain urine at room temperature. Results expressed as a % of the baseline.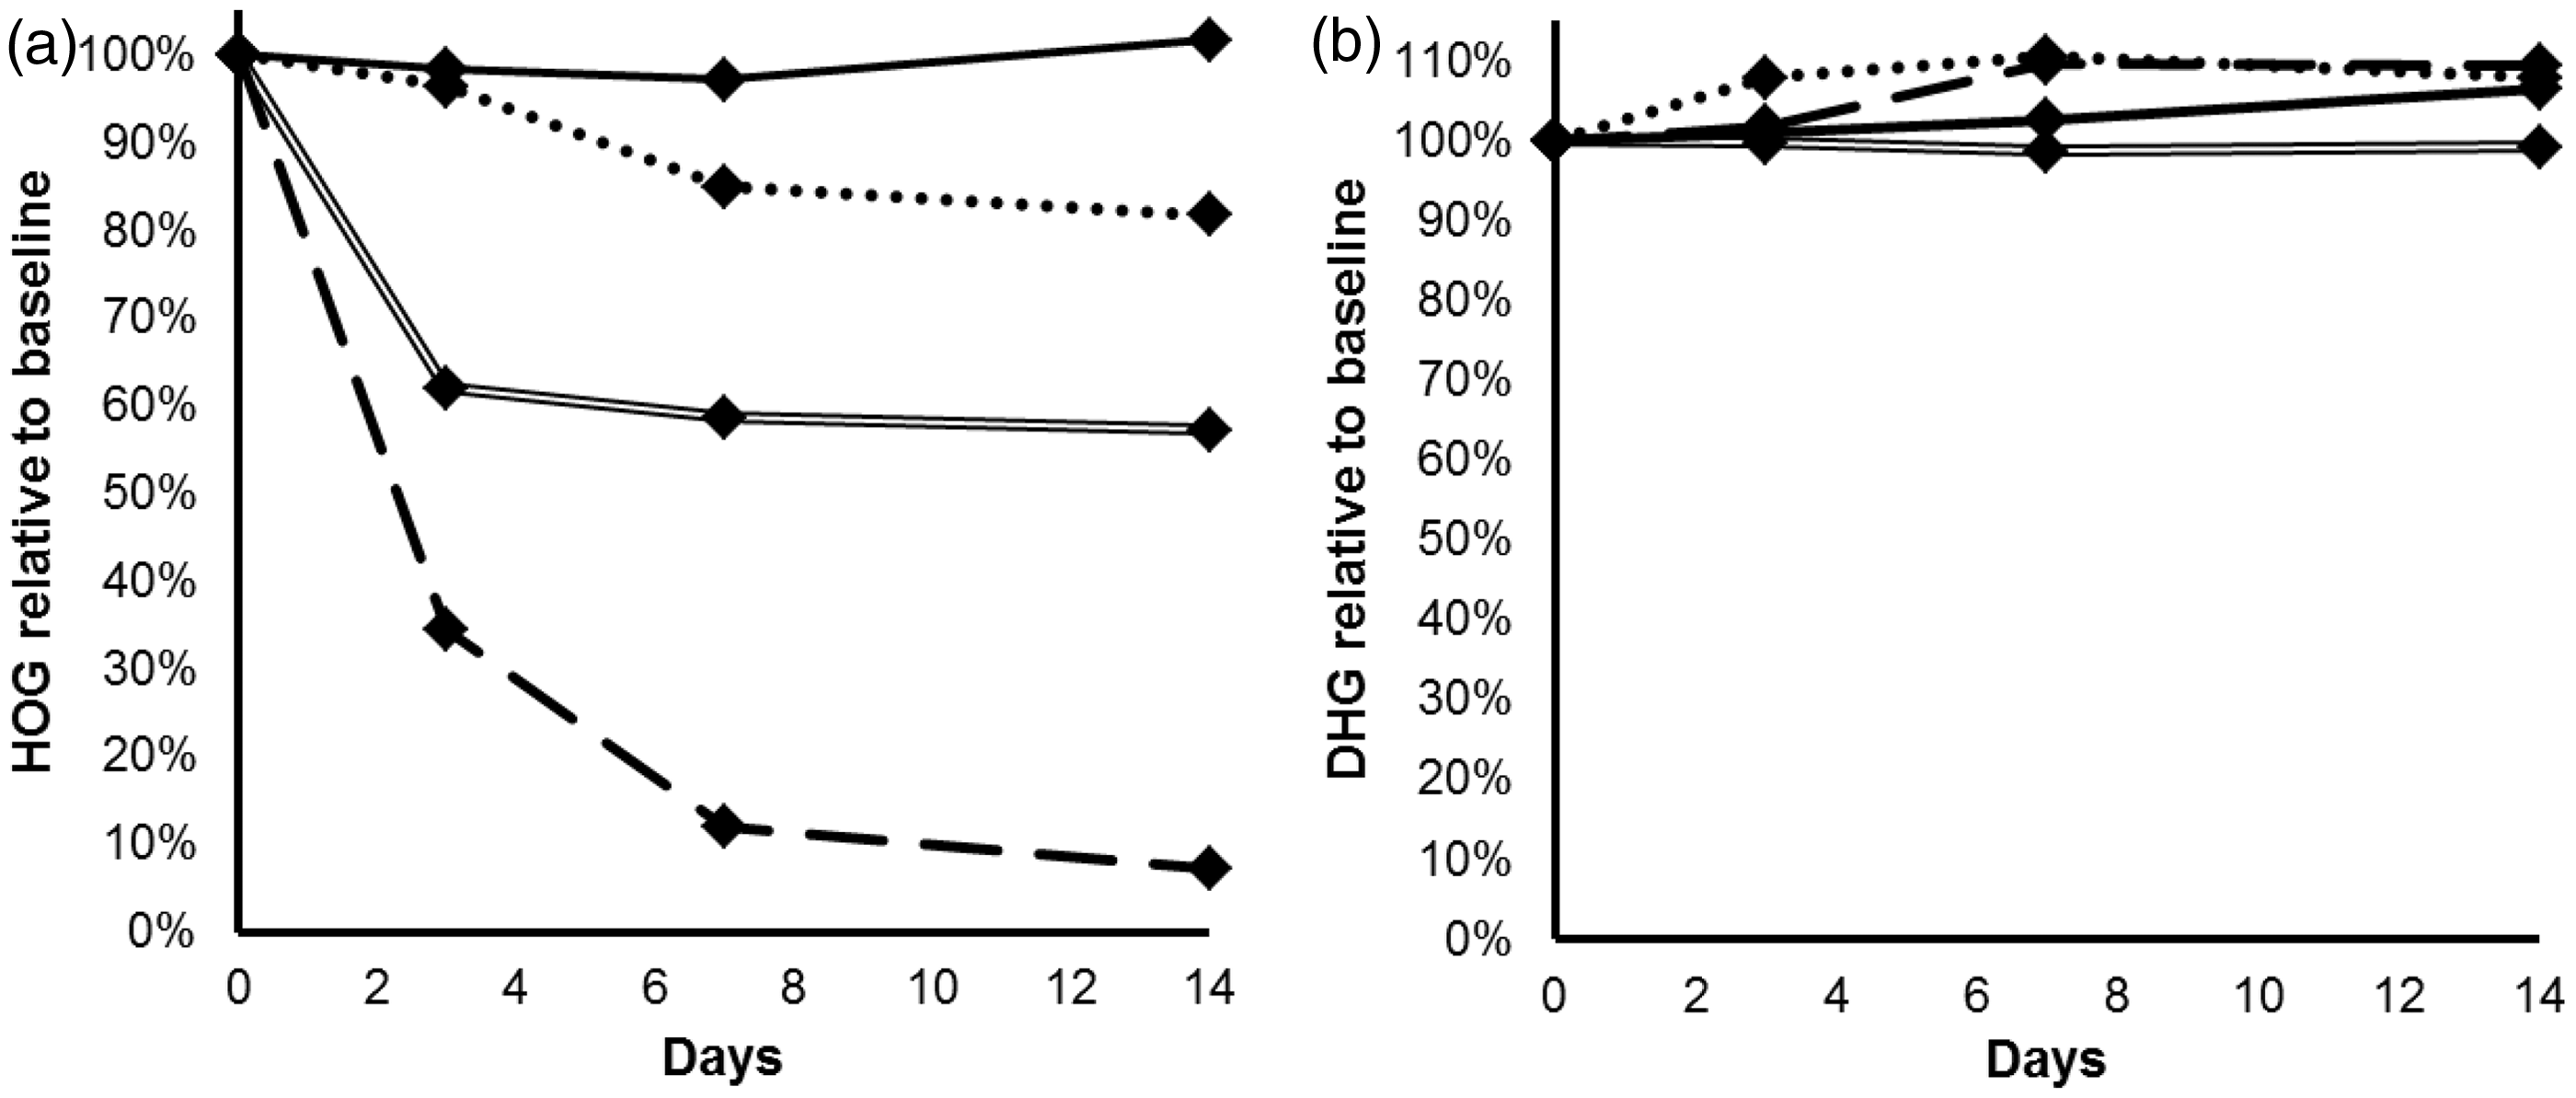
Biological variation
Four healthy adults (two male, two female) with no renal disease or history of stone formation provided an early morning urine sample on four consecutive days. The samples were analysed in duplicate in one batch and the intra-individual variation (CVI) estimated. The average CVI was 18.9% for glycolate; for glycerate, HOG and DHG the results were below the LLOQ so the biological variation could not be calculated.
Urine samples from PH cases and controls
Urine samples from patients with confirmed PH (16 PH1, 15 PH2 and 19 PH3) and from 14 healthy control individuals (six male, eight female) were analysed by the present method. Where results were below the LLOQ, an arbitrary value of half the LLOQ was assigned to them to allow inclusion in the analysis. Where peaks were not detected, a value of 0 was given. Results were then expressed as a ratio to creatinine to correct for urine concentration (Figure 3).
Concentration of PH metabolites expressed as µmol/mmol creatinine in patients with PH1 (n = 16), PH2 (n = 15), PH3 (n = 19) and controls (n = 14). Boxes are 25th–95th percentiles and whiskers range. Median is denoted by line and mean by dot.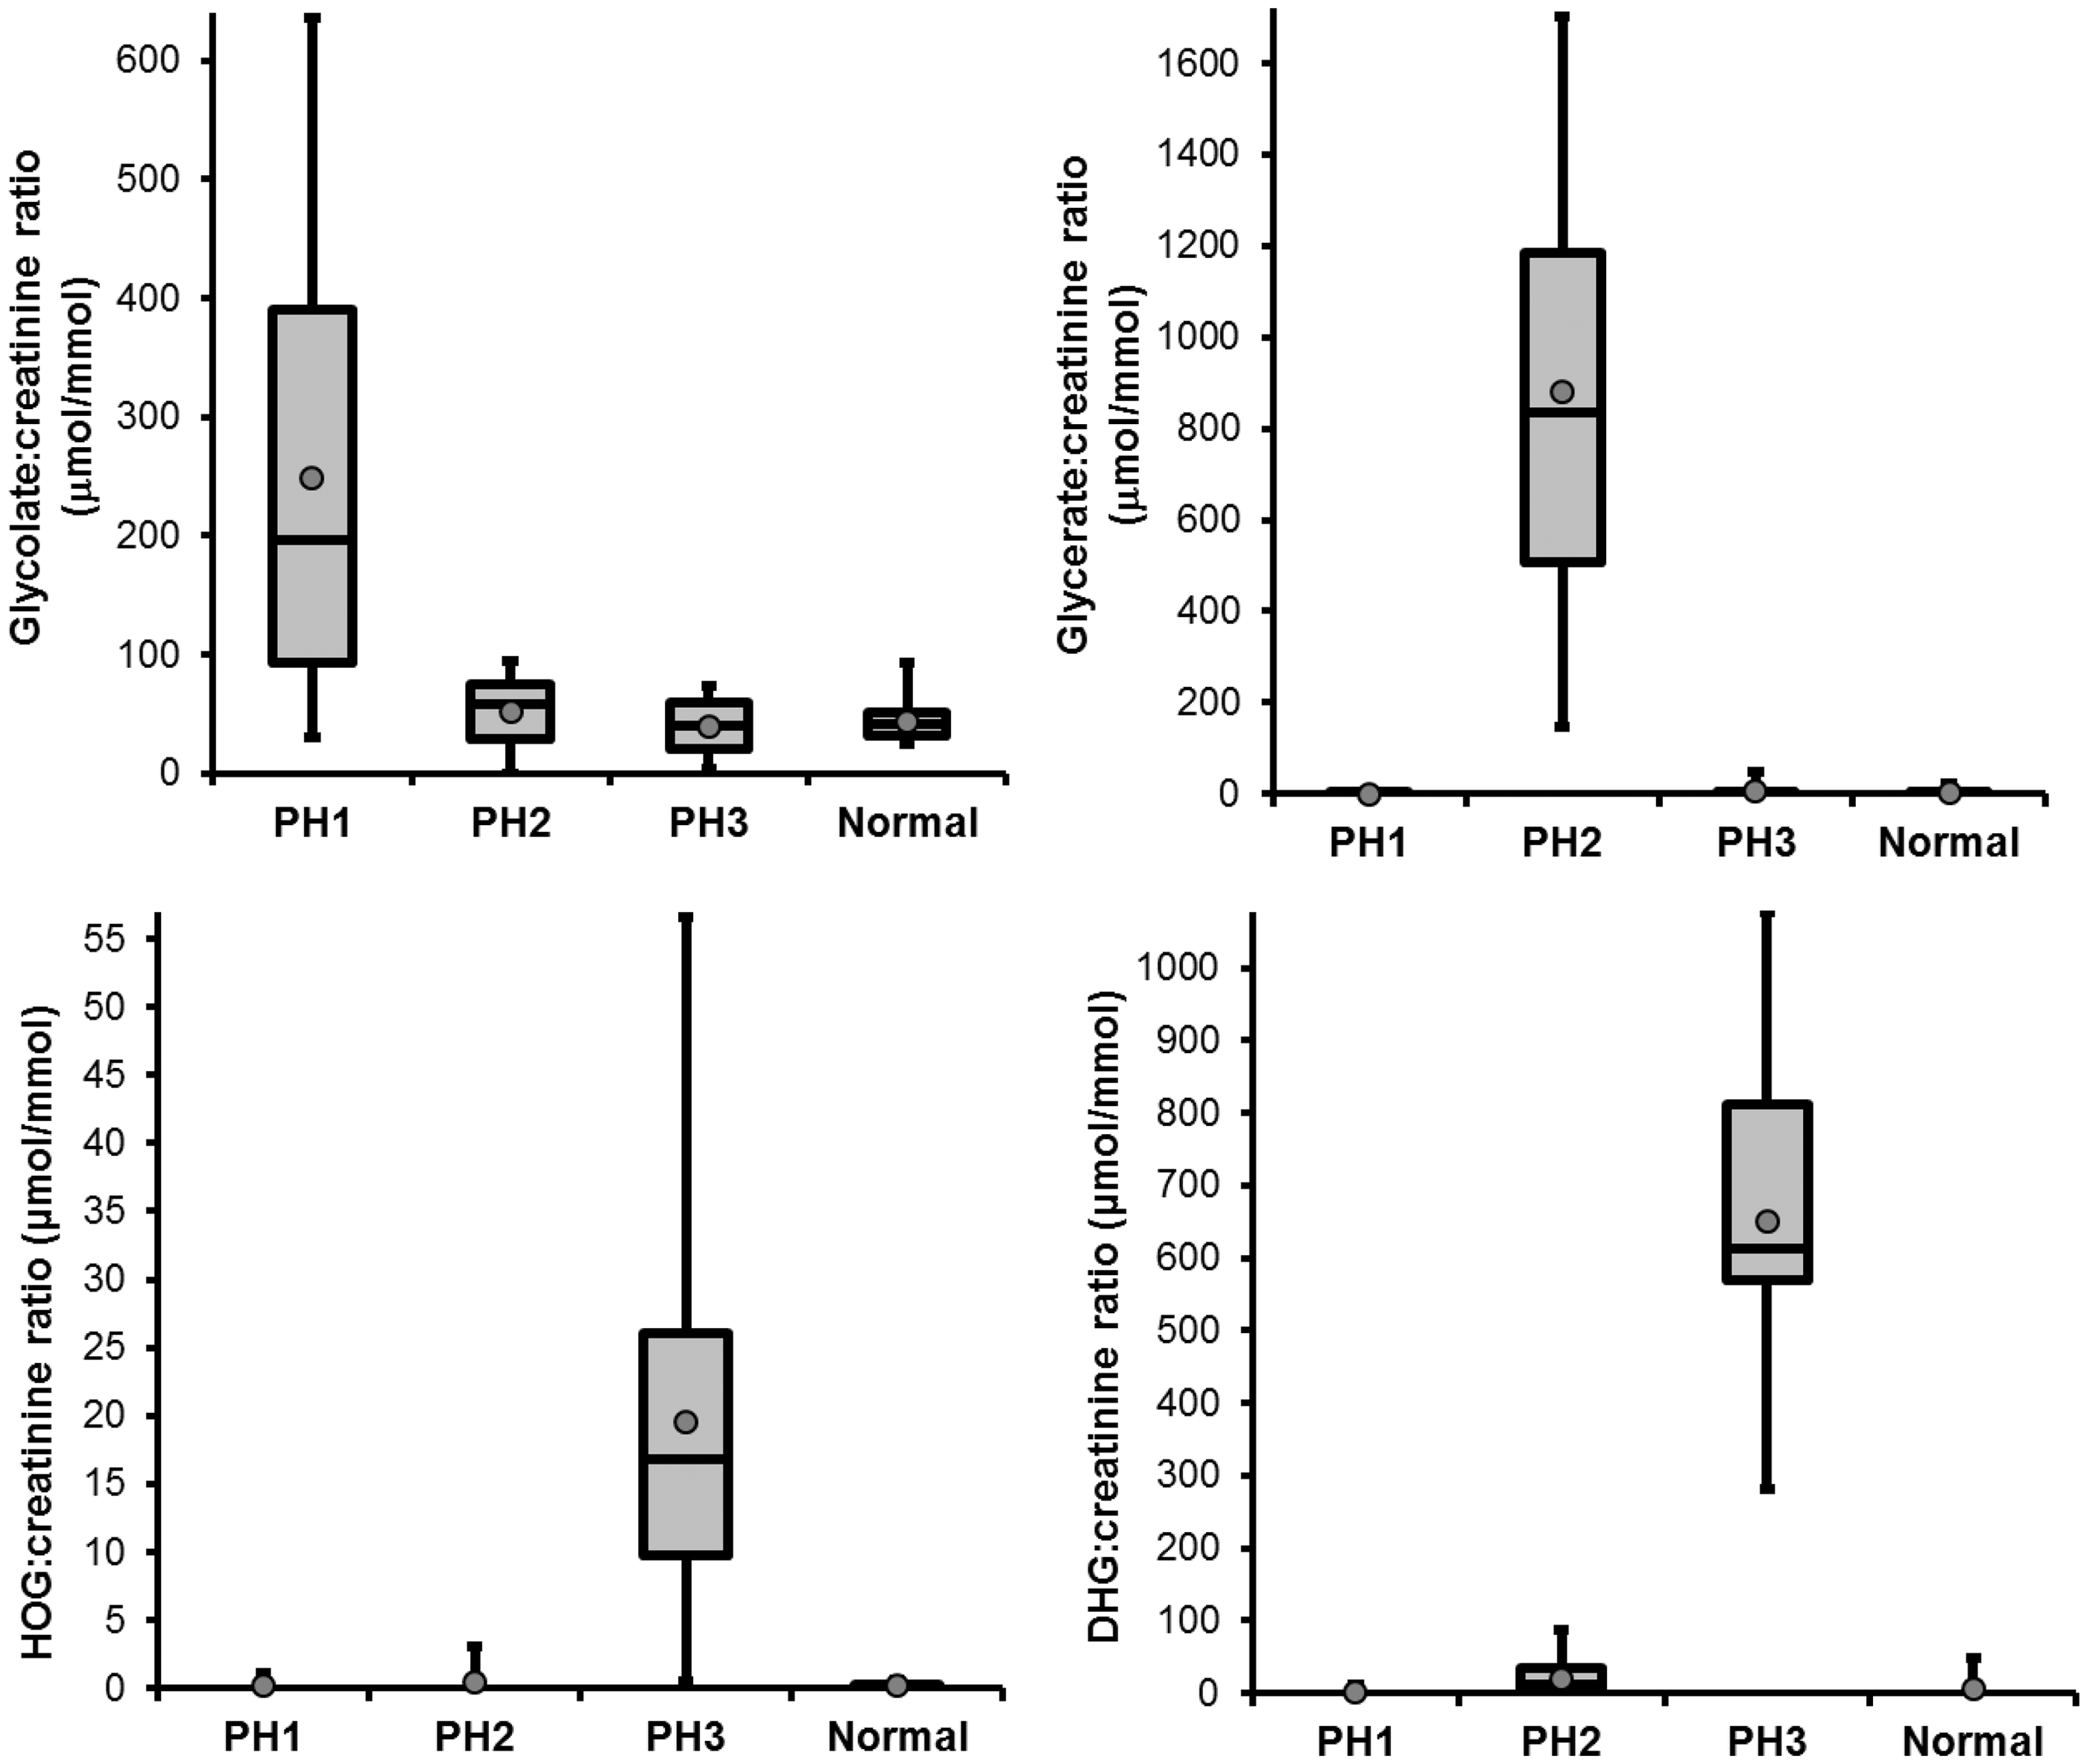
Glycolate
Mean glycolate:creatinine ratio was higher in urine from patients with PH1 (248 µmol/mmol) than PH2, PH3 or controls (52, 39 and 43 µmol/mmol respectively, P < 0.005). Glycolate:creatinine ratios ranged from normal to grossly elevated (30–637 µmol/mmol) in the PH1 group and there was a clear overlap between the groups visible on the box and whisker plot (Figure 3). The highest values were only seen in urine from patients with PH1, which suggested that a higher cut-off can be used to diagnose PH1; a cut-off of 100 µmol/mmol gave 100% specificity for PH1 at a sensitivity of 71%. The range of glycolate:creatinine ratios in the control group was 24–93 µmol/mmol.
Glycerate
Mean glycerate:creatinine ratio was higher in urine from patients with PH2 (879 µmol/mmol) than PH1, PH3 or controls (1, 8, and 3 µmol/mmol, respectively, P < 0.005). The lowest level in the PH2 group (146 µmol/mmol) was almost three times higher than the highest level in the PH1, PH3 or control groups (49 µmol/mmol). Therefore, 100% specificity and sensitivity for diagnosis of PH2 was possible using a cut-off of between 50 and 145 µmol/mmol. The range of glycerate:creatinine ratios in the control group was 0–23 µmol/mmol.
HOG
Mean HOG:creatinine ratio was higher in urine from patients with PH3 (20 µmol/mmol) than PH1, PH2 or controls (all 0 µmol/mmol, P < 0.005). Two PH3 urines had HOG concentration below the LLOQ, and the range of HOG:creatinine ratios in PH3 (1–57 µmol/mmol) overlapped with the other groups. A cut-off of 4 µmol/mmol gave 100% specificity for PH3 at a sensitivity of 84%.
DHG
Mean DHG:creatinine ratio was higher in urine from patients with PH3 (651 µmol/mmol) than PH1, PH2 or controls (2, 20 and 7 µmol/mmol, respectively, P < 0.001). The lowest level in the PH3 group (282 µmol/mmol) was more than five times higher than the highest level in the PH1, PH2 or control groups (88 µmol/mmol). Therefore, 100% specificity and sensitivity for diagnosis of PH3 was possible using a cut-off of between 89 and 281 µmol/mmol.
Identification of new cases of PH
Confirmed new cases of PH diagnosed by this method.
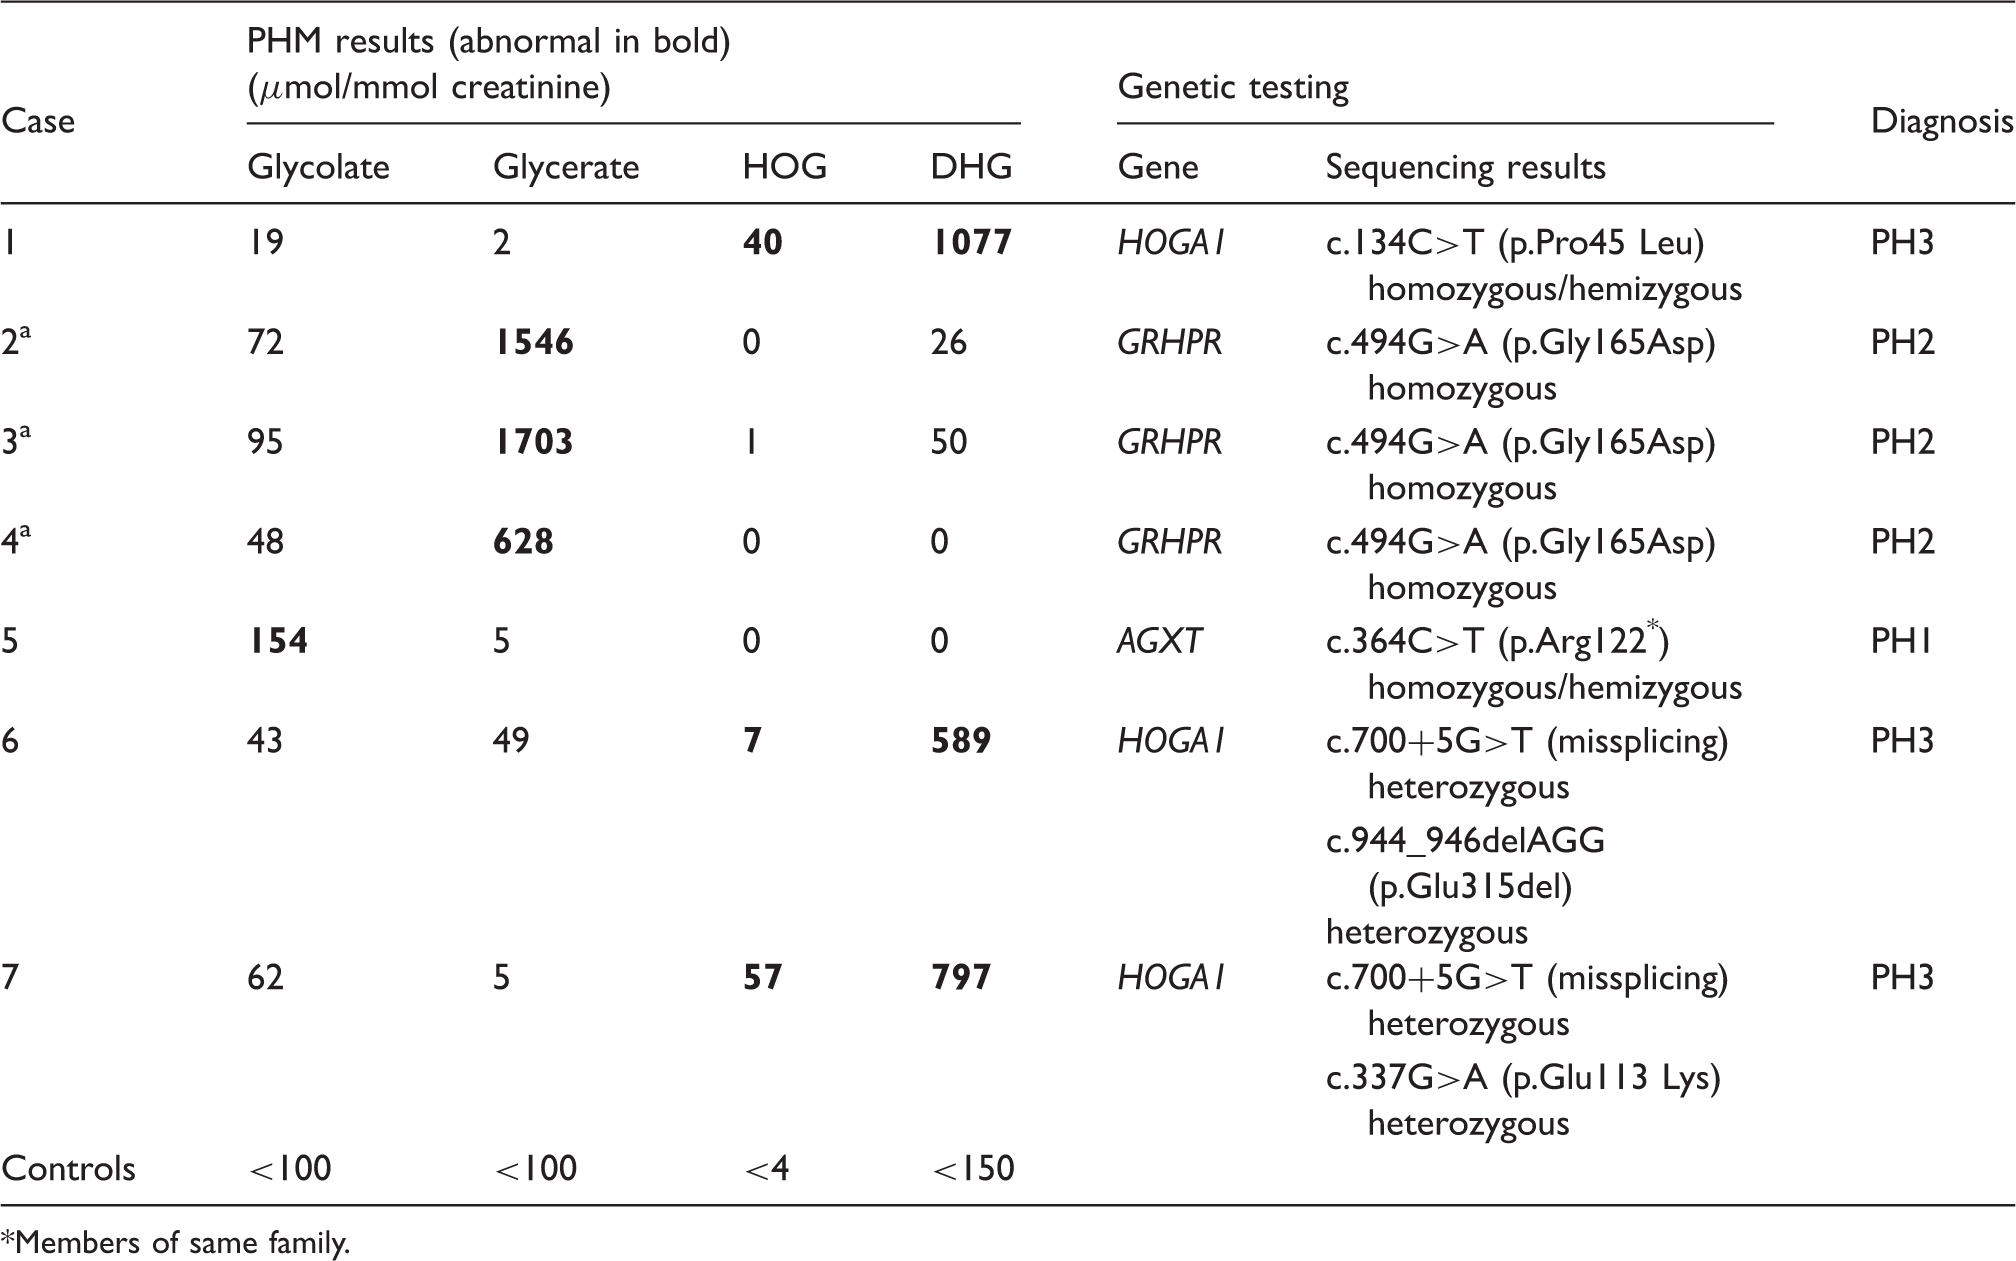
Members of same family.
Discussion
We have described a method for the quantitation of glycolate, glycerate, HOG and DHG in urine, which successfully provides an intermediary step in the investigation of PH. In the absence of certified reference materials or an external quality assurance scheme, accuracy was assessed by recovery, which was between 91 and 103%. The accuracy of glycolate measurement was further investigated by data comparison with the GO enzymatic method. 10 There was a positive bias, but because the comparator assay is not a gold standard we cannot state that the results from it are any more accurate than the results from the present method. The data presented here meet the accepted criteria for within-batch imprecision for a mass spectrometry assay, i.e. <10% CV and <20% at the LLOQ. 28 Between-batch imprecision of <10% was not met for glycerate and DHG. However, because of the large difference in expected values between patients with and without PH2 and PH3, respectively, this magnitude of imprecision is unlikely to have an adverse clinical impact.
We investigated the use of this method to distinguish between patients with the three known forms of PH and controls. Glycolate:creatinine ratios in PH1 were similar to previously reported levels. A review of data from the Rare Kidney Stone Consortium (RKSC) PH registry in the USA gave a median level of 152 µmol/mmol from 96 PH1 cases (analysis method not stated). 18 Another published GCMS method gave a mean of 239 µmol/mmol (range 79–418) in seven PH1 cases, 12 and an ion-chromatographic method gave a mean of 318 µmol/mmol (range 112–555) in six PH1 cases. 29 However, glycolate was not a completely sensitive marker for PH1 because not all patients had elevated levels; this corroborates earlier findings that up to a quarter of patients with proven PH1 have normal urine glycolate excretion. 5 The differential excretion in oxalate and glycolate may reflect inter-individual variation in the relative activities of LDH and GR for glyoxylate metabolism. Nor was glycolate a specific marker for PH1, as mildly elevated levels were found in the other forms of PH and in the control group (Figure 3). Factors other than hepatic AGT activity influence glycolate production in vivo. Diet can have an impact and some fruit and vegetables have high glycolate concentrations 8 to the extent that appreciable glycolic aciduria has been shown to occur in healthy individuals. In addition, there has been a recent report of elevated urine glycolate as the result of GO deficiency, although this disorder appears to be an incidental finding without a clinical phenotype. 30 The range of glycolate:creatinine ratios in the control group in this dataset was similar to previously reported ranges by a variety of methods: 20–107 µmol/mmol by GCMS, 12 13–80 and 13–90 µmol/mmol by ion-chromatography,29,31 22–125 µmol/mmol by chromotropic acid 32 but was somewhat higher than the levels reported using GO (4–41 µmol/mmol). 33 This suggests that the positive bias we found with respect to the GO method may be attributed to under-recovery of glycolate by GO. The biological variation data show that the intra-individual contribution to glycolate imprecision is larger than the analytical contribution. This has an important consequence for use of the assay in a diagnostic setting, because a single measurement cannot therefore be relied upon to reflect the true baseline glycolate excretion. The cause of the high intra-individual variation is likely to be diet, which was uncontrolled in our studies.
Unambiguous identification of all PH2 cases was possible based on the glycerate results because there was no overlap in glycerate:creatinine ratios between PH2 and other groups. The RKSC PH registry also shows no overlap in glycerate levels between PH2 and other groups and has comparable results (median 837, IQR 289–1564 µmol/mmol).
18
Urinary
HOG:creatinine ratios were highest in patients with PH3, and the data compare well with a previously reported range of 1.7–118 µmol/mmol. 7 HOG levels in PH3 overlapped with the PH1, PH2 and control groups in this dataset, and levels in healthy controls have also been reported to overlap with levels seen in PH3. 7 It is reasonable to state that HOG is neither a sensitive nor specific marker for PH3. Results from the stability study offer an insight into why this may be. HOG was only stable in urine when acidified and refrigerated. Therefore, the apparent poor sensitivity of HOG to detect PH3 may be due to in vitro loss of the metabolite, rather than genuinely normal urinary excretion. We have also demonstrated that the loss of HOG in urine samples is not due to in vitro reduction to DHG. The metabolic route taken by HOG in PH3 is not known for certain. It has been suggested that some must be catabolized to glyoxylate by an extra-mitochondrial aldolase, and thus lead to hyperoxaluria. 7 Another destination for HOG may be in vivo reduction by cytosolic enzymes to DHG. We hypothesize that metabolism by LDH may be one possibility given its broad substrate specificity and this is a subject for further study. In contrast to HOG, DHG was elevated in all PH3 urines and by a considerable margin over the PH1, PH2 and control groups. The results of this study suggest that DHG is the better marker and can identify PH3 with 100% diagnostic efficiency, in agreement with published data. 7 Furthermore, DHG was essentially stable under all the conditions trialled, so the measured levels are likely to reflect physiological excretion. Glycerate levels were not elevated in the PH3 group. This finding provides evidence against the hypothesis that hyperoxaluria in PH3 is caused by inhibition of GRHPR by HOG; 16 if this were the case, one might expect elevated glycerate in the urine similar to PH2.
Results from use of this method in routine clinical practice identified seven cases of PH which have been confirmed by gene sequencing in this laboratory. This represents a pick-up rate of 12%, which is high for such rare diseases, though there is likely to be a high index of suspicion in all cases referred for this service. In the seven cases confirmed by gene sequencing, the elevated PHM directed testing to the gene of interest, rather than stepwise analysis of all three genes known to cause PH based on the prevalence of the disorders. It should be noted that a normal glycolate does not rule out PH1, so in these cases, if glycerate, HOG and DHG are also low, then sequencing should be directed to AGXT. Even anticipating the introduction of next-generation sequencing methods to facilitate genetic testing for these diseases, 35 establishing the biochemical phenotype is important, particularly to support the finding of novel variants. We identified two novel changes in HOGA1, which were predicted to be disease causing in silico. Confirmation of the effect of both these changes ideally requires in vitro expression of the mutant protein but in the absence of these studies, the PHM profile and in silico analysis make a strong case for pathogenicity.
Patients with PH can undergo a diagnostic odyssey prior to receiving the correct treatment, and delays in this can be costly in terms of preserving renal function. 36 This study demonstrates that measurement of PHM by this method allows focussing of genetic testing to those in whom PH is likely and also to the gene responsible.
Footnotes
Declaration of conflicting interests
The author(s) declared no potential conflicts of interest with respect to the research, authorship, and/or publication of this article.
Funding
The author(s) received no financial support for the research, authorship, and/or publication of this article.
Ethical approval
Not applicable. The patient samples analysed in this study were referred to our department for investigation of primary hyperoxaluria.
Guarantor
GR.
Contributorship
OCM validated the method and wrote the manuscript. LH did initial method development work. GR conceived the study and contributed to the manuscript.