
Abstract
Background
We studied the impact on reference intervals, classification of patients with hypoalbuminaemia and albumin infusion prescriptions on changing from a bromocresol green (BCG) to a bromocresol purple (BCP) serum albumin assay.
Methods
Passing-Bablok regression analysis and Bland-Altman plot were used to compare Abbott BCP and Roche BCG methods. Linear regression analysis was used to compare in-house and an external laboratory Abbott BCP serum albumin results. Reference intervals for Abbott BCP serum albumin were derived in two different laboratories using pathology data from adult patients in primary care. Prescriptions for 20% albumin infusions were compared one year before and one year after changing the albumin method.
Results
Abbott BCP assay had a negative bias of approximately 6 g/L compared with Roche BCG method.
There was good agreement (y = 1.04 x − 1.03; R2 = 0.9933) between in-house and external laboratory Abbott BCP results. Reference intervals for the serum albumin Abbott BCP assay were 31–45 g/L, different to those recommended by Pathology Harmony and the manufacturers (35–50 g/L). Following the change in method there was a large increase in the number of patients classified as hypoalbuminaemic using Pathology Harmony references intervals (32%) but not when retrospectively compared to locally derived reference intervals (16%) compared with the previous year (12%). The method change was associated with a 44.6% increase in albumin prescriptions. This equated to an annual increase in expenditure of £35,234.
Conclusions
We suggest that serum albumin reference intervals be method specific to prevent misclassification of albumin status in patients. Change in albumin methodology may have significant impact on hospital resources.
Keywords
Introduction
Variations in reference intervals for the same analyte between different laboratories may be a source of confusion for clinicians who manage patients with pathology results from different laboratories or for clinicians working on multiple sites with different laboratories.1–3 To address this, Pathology Harmony, a UK initiative, is working towards harmonization of reference intervals for the most common tests. 4
Albumin is the major circulating protein 5 and although many methods are available for its measurement, dye binding methods are almost exclusively used in clinical laboratories as they are simple, rapid, cheap and relatively specific. Dye binding methods employ the high binding affinity of a dye, either bromocresol green (BCG) or bromocresol purple (BCP), for albumin to form stable complexes, which are quantified spectrophotometrically. The BCP method is more specific for albumin since, unlike BCG, it does not react with globulins 6–8 or overestimate albumin in haemodialysis and chronic kidney disease (CKD) patients, 9 and is in good agreement with immunoassay and capillary zone electrophoresis methods.6,8
In March 2011, the recommended Pathology Harmony reference interval for serum albumin in adults, born out of consensus, was 35–50 g/L. The consensus was based on data from laboratories irrespective of the method used. Pathology Harmony was aware of method differences based on unpublished data but concluded that the proposed reference range was appropriate for all methods. However, it is unknown as to the relative percentage of the laboratories using BCG or BCP methods, which contributed to the Pathology Harmony survey as this may have biased the consensus reference range, particularly since BCG methods are more commonly used than BCP methods.
In 2013, our laboratory changed methods for measuring serum albumin from BCG to BCP owing to its higher specificity for albumin.6,8 Comparison of patient sample results from both methods, led us to question the validity of applying the consensus Pathology Harmony reference range for serum albumin for our method and local population. We subsequently evaluated the impact of using the new BCP serum albumin assay in conjunction with the Pathology Harmony reference range on the prescription of albumin infusions.
Methods
Between-method comparison
A total of 89 patient serum samples were randomly selected and anonymized. Serum samples, stored at 4℃ for less than one week, were analysed in parallel on the Roche Modular® analyser using the Roche Albumin BCG method (Roche diagnostics GmbH, Mannheim; catalogue number, 11929631 216, Calibrator for automated system catalogue number 10759350 190) and the Abbott Architect c16000 using the Abbott BCP method (Abbott diagnostics, Abbott Laboratories, Illinois, USA; catalogue number, 7D54, multi-constituent calibrator, catalogue number 1E65). Data from methods were compared using Passing-Bablok regression analysis and the Bland-Altman method.
A further 20 randomly selected and anonymized serum samples were analysed for Abbott BCP albumin and then referred to an external laboratory for albumin analysis using the same BCP method on an Abbott Architect c16000 platform. Data were compared by simple linear regression analysis.
The coefficients of variations for Abbott BCP method were 0.58% (n = 20) and 0.58% (n = 20) at 26.5 g/L and 55.3 g/L, respectively (intra-batch) and were 0.63% (n = 79) and 0.62% (n = 70) at 26.8 g/L and 55.5 g/L, respectively (between-batch). The between-batch coefficients of variations for the Roche BCG method was 2.5% (n = 27) and 1.2% (n = 29) at 27.1 g/L and 57.3 g/L, respectively and the intra-batch coefficient of variation was 0.4% (n = 21) and 1.0% (n = 20) at 27 g/L and 58.4, respectively.
Reference intervals
Serum albumin results, from primary care patients in the pathology database aged >16 years, analysed over a 3-month period were used untrimmed and with no further exclusion criteria to determine the reference interval for the Abbott BCP method. An external laboratory, also using the Abbott BCP method, was asked to determine the serum albumin reference interval for their local adult primary care population. The data were trimmed of albumins of <30 g/L and no further exclusion criteria were applied.
Albumin prescriptions
The use of 20% albumin infusions across the Trust was compared 12 months before and 12 months after the change in albumin method.
Data analyses
Statistical analyses were performed using Analyse-It for Excel package (version 2.3, Analyse-IT Software Ltd, Leeds, UK). All data were parametric (Kolmogorov-Smirnov test), and were analysed using the unpaired Student’s t-test and results reported as means ± standard deviations. Agreement between the two albumin methods was assessed using Passing-Bablok linear regression and a Bland-Altman plot. Since data were parametric, the reference range was defined as between the 2.5% to 97.5% percentiles.
Results
Between-method comparison
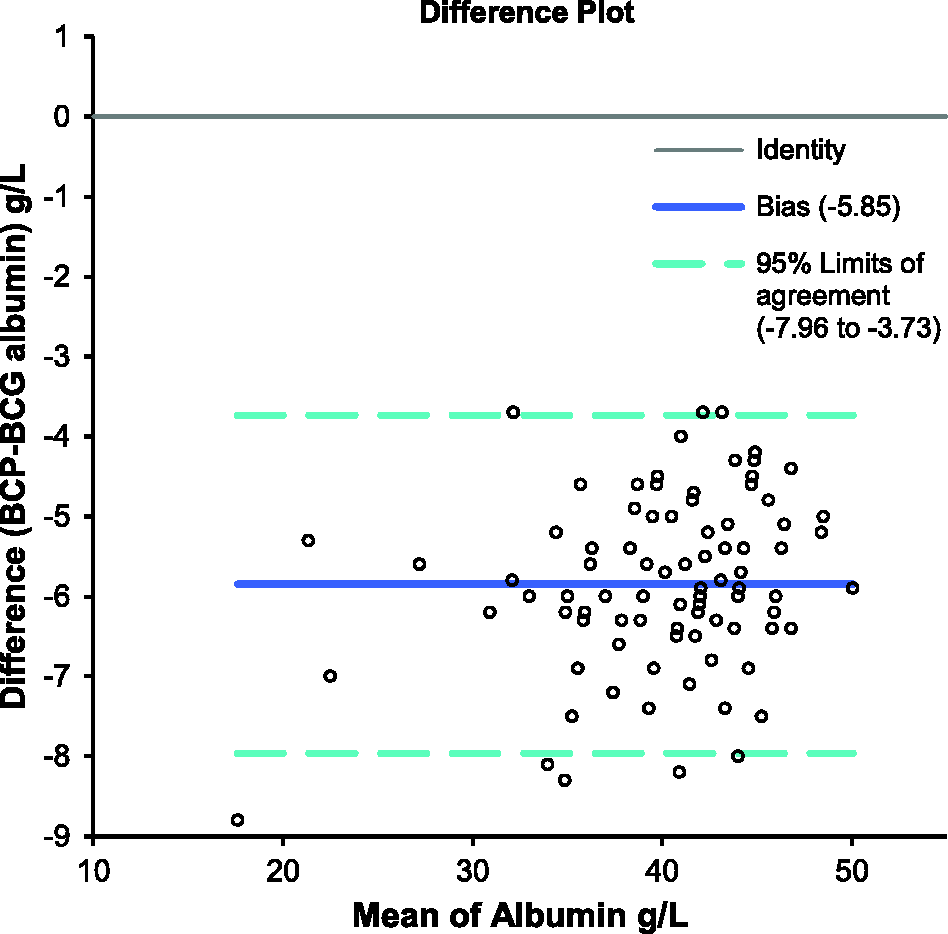
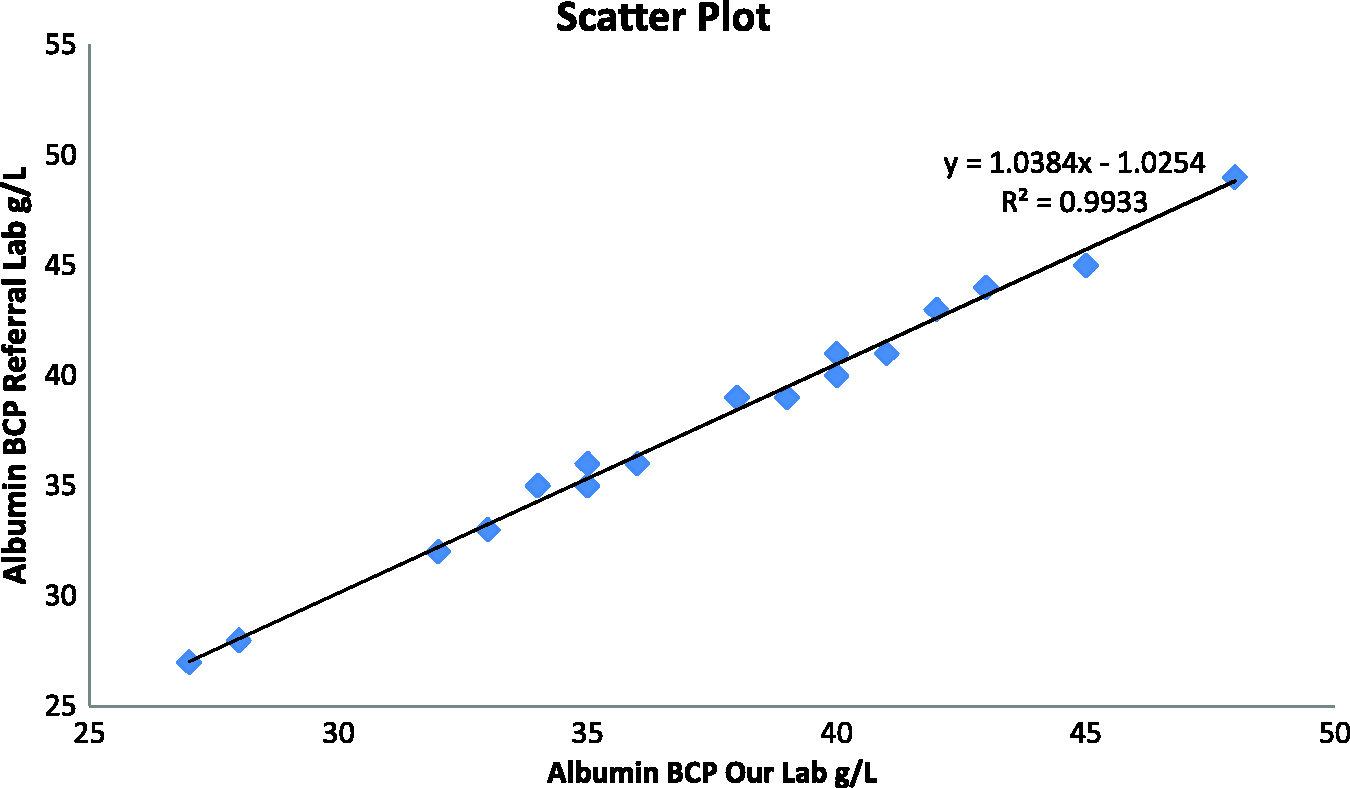
The Passing-Bablok regression analysis (Figure 1) and Bland-Altman plot (Figure 2) indicated that the Abbott BCP assay was negatively biased compared with Roche BCG method; producing results that were approximately 6 g/L lower. Linear regression analysis showed good agreement (y = 1.04 x − 1.03; R2 = 0.9933) between the in-house and external laboratory Abbott BCP results (Figure 3).
Passing-Bablock regression plots of albumin results for the Abbott BCP and Roche BCG methods. Bland-Altman plot comparison of albumin results for the Abbott BCP and Roche BCG methods. Simple linear regression analysis comparing Abbott BCP results in two different laboratories.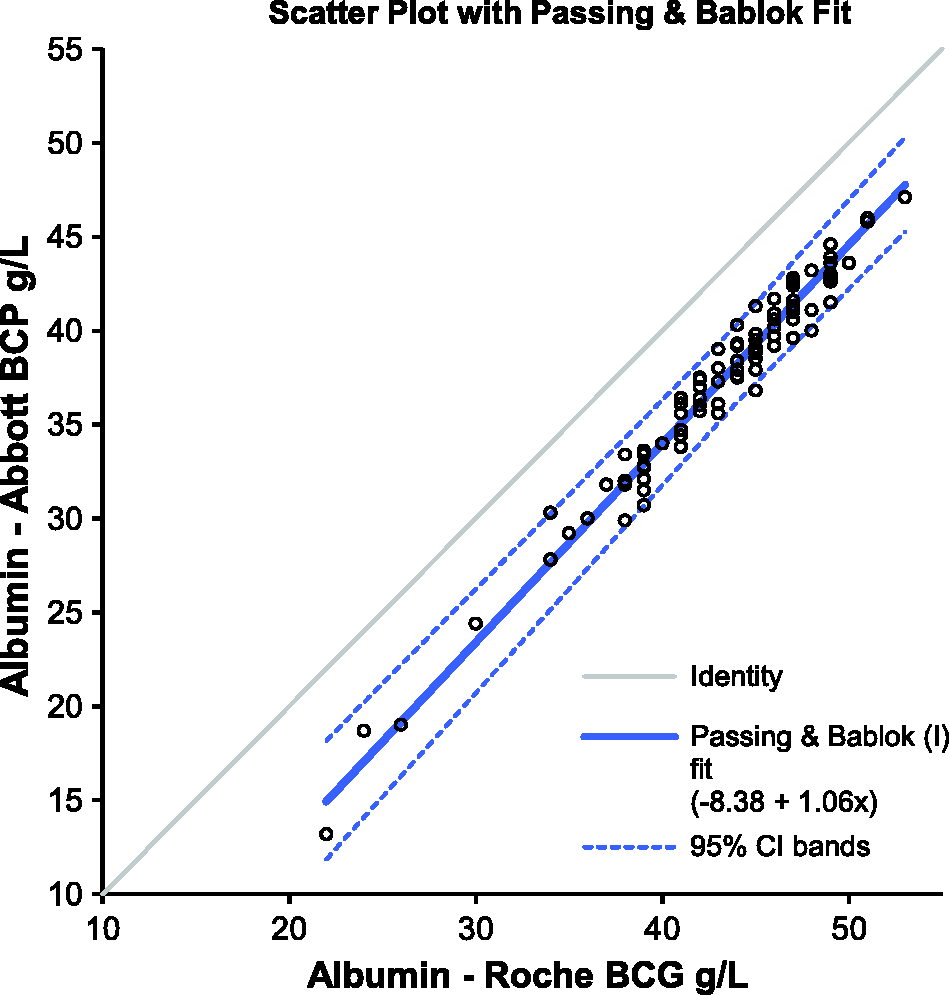
Reference intervals
Serum albumin results from 24,779 adult (≥16 years) primary care patients were used to determine the reference range for the Abbott BCP assay. Serum albumin showed a Gaussian distribution with a mean of 37.9 g/L and the reference range 31–45 g/L.
The reference range for the same assay, established from 10,797 adult primary care patient samples at the external laboratory, was similar; 32–44 g/L; mean of 38 g/L and Gaussian in distribution.
Albumin prescriptions
In the 12 months following the change in albumin method, there was a 44.6% monthly increase in albumin prescriptions compared with the previous 12 months (188.1 ± 25.6 versus 272.2 ± 74.4; P = 0.0012). This equated to an annual increase in expenditure of £35,234.
Misclassification of hypoalbuminaemia
The distribution of all serum albumin results, for the period April 2013 to March 2014, for the Abbott BCP compared with the Roche BCG method, April 2012 to March 2013, is shown in Figure 4. Using Pathology Harmony reference intervals, in the year after the introduction of the new method 32% of patient samples were hypoalbuminaemic (serum albumin < 35 g/L) by the Abbott BCP method compared with 12% in the preceding year by the Roche BCG method. However, if patient samples in which albumin was measured by Abbott BCP were retrospectively classified using the locally derived Abbott BCP reference interval, then 16% would have been hypoalbuminaemic (serum albumin < 31 g/L).
Patients categorized according to serum albumin according to Abbott BCP (April 2013 to March 2014) and Roche BCG (April 2012 to March 2013) methods.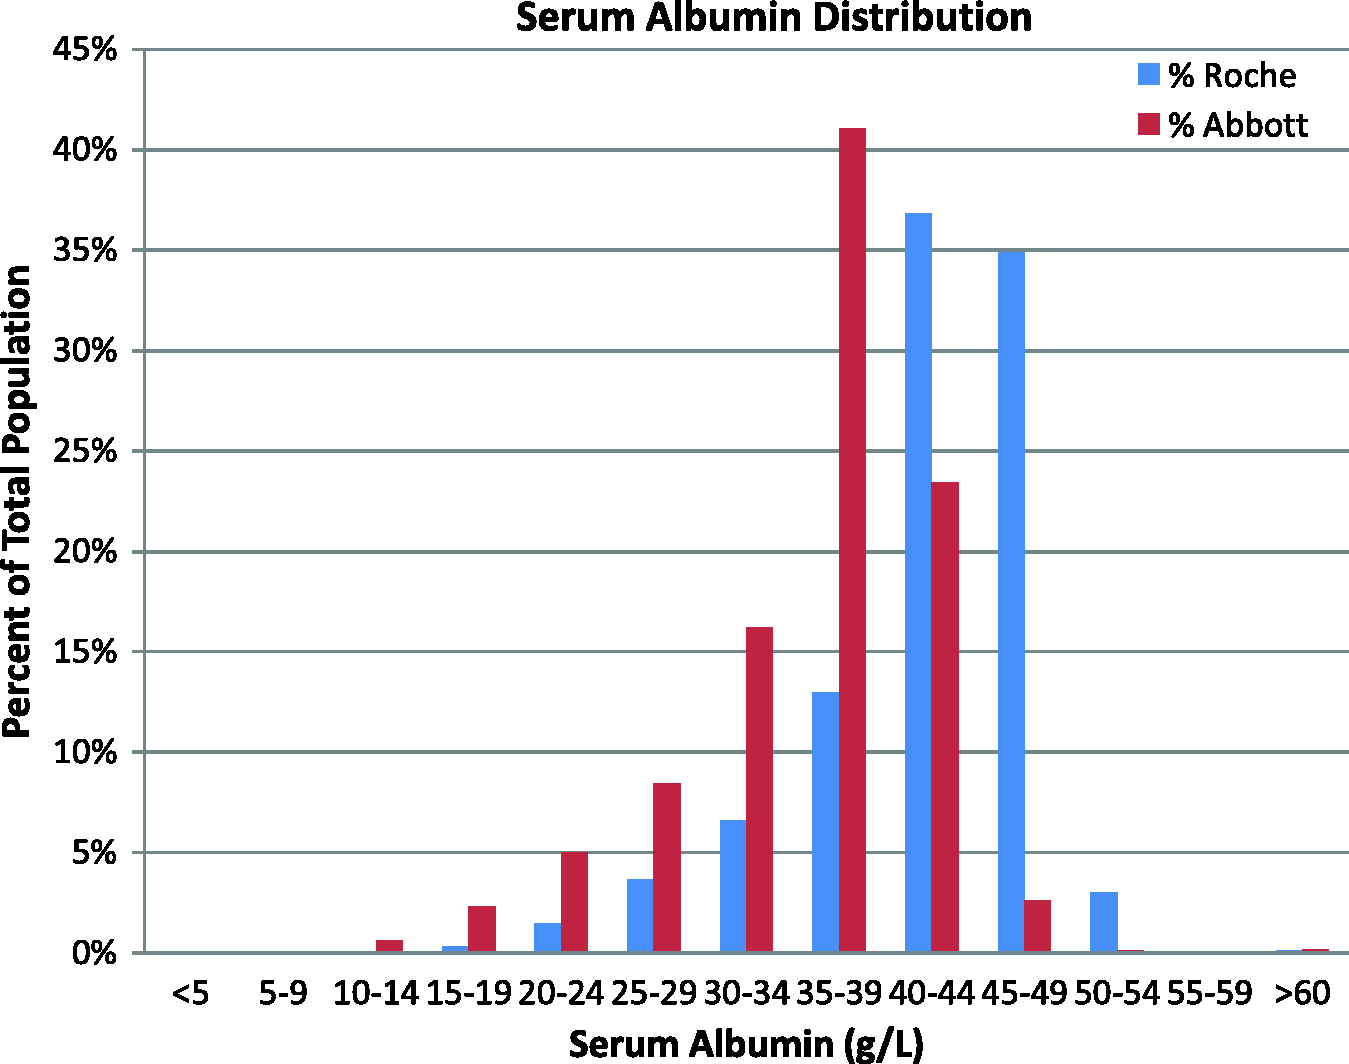
Discussion
We are supportive of the aims of Pathology Harmony in promoting not only uniformity of reference intervals but also harmonization of reporting units, test names, advice on protocols for simple tests, criteria for telephoning out-of-hours urgent results to primary care, and guidelines for the appropriate use of tumour markers. 3
We identified a significant difference between Roche BCG and Abbott BCP albumin results, which are consistent with External Quality Assurance data on BCG and BCP methods. Despite clear methodological differences in albumin results, we still decided to use the Pathology Harmony recommended reference range of 35–50 g/L for Abbott BCP albumin particularly as the kit insert for Abbott Albumin BCP assay also gave a reference range of 35–50 g/L in adults (14–60 years) and 34–48 g/L in those aged more than 60 years. 10 However, we appended a comment on all albumin results stating ‘Please Note- albumin results 6-8 g lower on the new method since 06/06/13’.
We explained to clinical colleagues that we were adopting nationally agreed Pathology Harmony reference ranges for albumin but would seek further consensus and would require prospective data to derive, if appropriate, the new Abbott BCP albumin assay reference intervals for our population. Other Abbott albumin BCP users that we contacted were also using Pathology Harmony reference intervals (one of them has since adopted their locally derived range because of clinical complaints). This report, however, clearly shows that our local Abbott BCP-derived reference range is similar to that derived in a different laboratory with a different patient population, indicating that the derived Abbott BCP reference range is method-specific rather than population-specific.
This report highlights several issues regarding appropriate reference intervals and between-method variability. The impact of inappropriate/harmonized generic rather than method- and population-specific albumin reference ranges is difficult to assess in terms of patient management. Clearly, many more samples were misclassified as hypoalbuminaemic with the Abbott BCP method using a generic rather than a locally derived reference range with potential implications on patient investigation, patient prognosis and patient anxiety.11–13
There was an immediate and sustained increase in prescriptions for human albumin infusions following the change in albumin assay method. This increase was seen across all care teams, but particularly in critical care, gastroenterology and renal medicine. It is possible but very unlikely that the increase in albumin prescriptions was due to a sudden and sustained change over one year in patient case-mix or severity of illness across the hospital. Indeed, following the dramatic increase in albumin prescriptions, our blood transfusion team contacted the clinical teams who confirmed that there were no changes in indications for albumin infusion, which were based on clinical need and albumin concentrations. We suggest that the increase in albumin prescriptions was due to lower albumin values per se rather than inappropriate reference intervals since advice from guidelines on albumin infusions are based on clinical need and absolute cut-off values irrespective of reference intervals, 14 to our knowledge, no organizations cite method-specific cut-offs. However, it is clear that between-method analyte differences may have a significant impact on patient management and hospital costs.
In conclusion, we support the notion that method-specific albumin cut-offs for clinical intervention should be clearly defined in guidelines 15 and calls for albumin assay standardization.9,16 Our reported Abbott albumin BCP reference range derived in two different hospital laboratories was incompatible with those recommended by Pathology Harmony and indeed by the manufacturer. We suggest that the most appropriate approach is to determine method-specific albumin reference ranges and secondly that manufacturers should provide more meaningful information regarding their assays. We therefore advocate that each laboratory carefully considers the transferability of Pathology Harmony and manufacturer’s reference intervals to its patient population and, if necessary, determines its own local reference ranges to optimize patient management.
Footnotes
Acknowledgements
The authors thank laboratory staff in Blood Sciences, New Cross Hospital, Wolverhampton, and in Biochemistry, Scunthorpe General Hospital/Path Links, Scunthorpe, responsible for sample analysis.
Declaration of conflicting interests
The author(s) declared no potential conflicts of interest with respect to the research, authorship, and/or publication of this article.
Funding
This research received no specific grant from any funding agency in the public, commercial, or not-for-profit sectors.
Ethical approval
Not required.
Guarantor
RG.
Contributorship
RG and DCG conceived the study. DCG, MH, MPC, IMB and CF contributed data. DCG reviewed the literature, analysed the data and wrote the first draft. All authors contributed to subsequent drafts and approval of the final version.