
Abstract
Background
The controlling nutritional status (CONUT) score (CS), a simple score for assessing nutritional status, is calculated using laboratory data, including serum albumin concentration. Although dye-binding assays such as the bromocresol green (BCG) and modified bromocresol purple (mBCP) methods are widely used for albumin measurement, acute-phase proteins interfere with the BCG method.
Objective
We aimed to determine whether the choice of albumin assay affects assessment of nutritional status using CONUT scores (CSs).
Design
We measured serum albumin concentrations by the BCG (ALBBCG) and mBCP (ALBmBCP) methods in 44 malnourished inpatients, 27 of whom underwent nutritional intervention, and compared them to 30 age-matched healthy volunteers. In treated patients, CSs were calculated by ALBBCG (CS-BCG) and ALBmBCP (CS-mBCP).
Results
C-reactive protein (CRP) concentrations were positively correlated with the difference between ALBBCG and ALBmBCP in malnourished inpatients (r = 0.59, p < 0.001). CS-BCG was always lower than CS-mBCP (lower CS indicates superior nutritional status) in treated patients with persistently high CRP levels. However, in patients whose CRP decreased gradually, this difference diminished over the clinical course. CS-BCG and CS-mBCP were similar throughout their courses in patients with normal CRP concentrations. Adding haptoglobin to the human albumin solutions increased ALBBCG in a dose-dependent manner.
Conclusions
The choice of albumin assay affected the assessment of nutritional status using CSs in patients with inflammation. We recommend that the modified BCP assay be used to assess nutritional status, particularly in patients with inflammation.
Keywords
Introduction
The associations among malnutrition and malaise, fatigue, poor rehabilitation, increased susceptibility to infection, bed sores, impaired wound healing, and adverse outcomes after surgical operations have been widely recognized. 1 Nutritional intervention for severely malnourished patients should be considered under consultation with a nutrition support team (NST). The NST is an in-hospital organization composed of nutritional specialists, including physicians, nurses, dietitians, pharmacists, and clinical laboratory technicians. The NST helps to improve the nutritional status of these patients, thereby reducing the risk for severe infection and metabolic complications and decreasing associated medical costs.1,2 NST members must assess a patient’s nutritional status as accurately as possible to provide optimal nutritional advice.
A nutritional status assessment is carried out using a patient’s medical history, as well as anthropometric and laboratory parameters. The subjective global assessment (SGA) of nutritional status is a simple, easy-to-use, and relatively inexpensive questionnaire that is widely used for assessing nutritional status.3,4 NST members require only a patient’s medical history and anthropometric parameters to complete the SGA questionnaire. In contrast, the controlling nutritional status (CONUT) score (CS) is a simple and easy-to-use tool to evaluate nutritional status using laboratory test results. 5 Calculating a patient’s CS requires the total peripheral lymphocyte count (TLC) and serum concentrations of total cholesterol (TC) and albumin. The CS is more useful than other prognostic nutritional indices for predicting the distant prognoses of patients with end-stage liver disease. 6 Other indices, such as rapid turnover proteins (RTPs) transthyretin, transferrin, and retinol-binding protein, are useful for a short-term evaluation of nutritional status.7,8 However, RTPs are difficult to measure in typical clinical laboratory settings, and the presence of infectious disease can decrease the serum concentration of these markers due to reduced synthesis in the liver.
Albumin, a classic nutrition index marker that is synthesized in the liver, is the most abundant serum protein and has various physiological functions. 9 Albumin concentration is commonly measured in clinical laboratories using two dye-binding techniques, the bromocresol green (BCG) and bromocresol purple (BCP) methods.10–14 As the BCP method has some drawbacks in terms of specificity, the modified BCP method (mBCP) was developed and is now commercialized in Japan. 15 Although the BCP method is more specific than the BCG method, the latter is still used worldwide due to its lower cost. According to a survey by the College of American Pathologists in 2011, the BCG method was used in 48% of the participating institutions. 16 Because acute-phase proteins interfere with the BCG method, CONUT scores (CSs) obtained from albumin concentrations determined by the BCG method may lead to an inaccurate assessment of nutritional status in the presence of inflammation (INF).
The purpose of this study was to elucidate whether the choice of albumin assay affects the assessment of nutritional status using CSs. We calculated CSs using the BCG and mBCP methods and examined the effects of INF on these scores.
Materials and methods
Subjects
We enrolled malnourished patients who were referred to NSTs at Juntendo University Hospital (Tokyo, Japan). We excluded patients who were completely dependent on parenteral nutrition or who had undergone a surgical operation in the previous three weeks. We recruited 44 malnourished patients for this study; 27 patients (malnourished group: malignancy, n = 8; cardiovascular disease, n = 6; pneumonia or other infectious disease, n = 6; liver disease, n = 4; neurodegenerative disorder, n = 3) underwent nutritional intervention and a periodic evaluation of nutritional status, as described below. Thirty healthy volunteers were also examined as a control group to compare baseline data with those of healthy subjects. Patients with acute INF, diabetes mellitus (glycated hemoglobin [NGSP] > 6.5%) 17 or nephrotic syndrome (serum albumin concentration <30 g/L and proteinuria >3.5 g/day) were excluded from this study. We explained the purpose, design, and possible contribution to medical science of this study with a leaflet and obtained written informed consent from all subjects. The study protocol was approved in advance by the ethics committee of Juntendo University Hospital, and the study was conducted in full accordance with the Declaration of Helsinki, revised in 2008. 18
Blood samples
The first blood sample was collected from the malnourished group on day 0 of nutritional intervention. Thereafter, two samples per week were taken during the intervention period (⩽4 weeks). All blood samples were drawn with the patient in a supine position after an overnight fast. The separated serum was frozen in screw-capped tubes at −80℃ for albumin measurements.
Laboratory measurements
We measured TC and triglyceride (TG) levels using enzymatic methods (Aqua Auto Kainos T-CHO and Aqua Auto Kainos TG-II, Kainos Laboratories, Tokyo, Japan). Low-density lipoprotein cholesterol (LDL-C) and high-density lipoprotein cholesterol (HDL-C) were measured by homogeneous methods (Cholestest LDL, and Cholestest N HDL, Sekisui Medical, Tokyo, Japan). C-reactive protein (CRP) concentrations were measured by latex immunoturbidimetry (Nanopia CRP, Sekisui Medical). Total protein (TP) was measured by the burette method (Aqua Auto Kainos TP-II, Kainos Laboratories). Albumin concentrations were determined by BCG and mBCP assays (ALBBCG and ALBmBCP) using commercial kits (BCG, Kainos Auto Series ALB; mBCP, Aqua Auto Kainos ALB, Kainos Laboratories). All measurements were performed using a Hitachi-7170 automated analyzer (Hitachi High-Technologies, Tokyo, Japan). ΔALB (%) was calculated using the following formula: [(ALBBCG − ALBmBCP)/ALBBCG] × 100. Peripheral blood cell counts, including TLC, were measured with an XE-2100 automated analyzer (Sysmex, Kobe, Japan). Serum proteins of some patients were separated by electrophoresis on a cellulose–acetate membrane.
Interference of haptoglobin with albumin measurements in vitro
We performed in vitro experiments to determine the effects of haptoglobin on ALBBCG and ALBmBCP values. Purified haptoglobin was purchased from Sigma-Aldrich (St. Louis, MO, USA). According to the certificate of analysis, the purity of the haptoglobin was 98–100%. Human albumin solutions were mixed with purified haptoglobin solutions. The final concentrations of haptoglobin were 1.0, 2.5, 5.0, and 10.0 g/L. The albumin concentrations were 38.0 g/L in all samples, which were confirmed by nephelometry. Albumin concentrations were measured in these prepared samples simultaneously in triplicate by the BCG and mBCP methods.
Evaluation of nutritional status
Nutritional status of malnourished patients was graded by CSs, as described elsewhere. 5 Briefly, the score was calculated using three laboratory parameters. According to measured values, each parameter was scored as follows: (a) albumin (g/L), ⩾35 (0 points), 30 to <35 (2 points), 25 to <30 (4 points), and <25 (6 points); (b) TLC (/µL), ⩾1600 (0 points), 1200 to <1600 (1 point), 800 to <1200 (2 points), and <800 (3 points); and (c) serum TC (mmol/L), ⩾4.66 (0 points), 3.63 to <4.66 (1 point), 2.59 to <3.63 (2 points), and <2.59 (3 points). The sum of (a), (b), and (c) was defined as the CS. Nutritional status was categorized into four classes by CSs: normal (CS 0–1), slightly impaired (CS 2–4), moderately impaired (CS 5–8), and severely impaired (CS 9–12). As we measured serum albumin concentrations using the BCG and mBCP methods, we obtained two CSs (CS-BCG and CS-mBCP) for each patient.
Statistical analysis
Laboratory data are presented as means ± standard deviations and CSs are presented as medians. We used Pearson’s correlation coefficients to examine the association between CRP and ΔALB and the ALBBCG:ALBmBCP ratio. To compare mean or median values between groups, we used the Student’s and Welch’s t-tests or the Mann–Whitney U-test and one-way analysis of variance or the Kruskal–Wallis test. All statistical tests were two-sided, and p < 0.05 was considered statistically significant.
Results
Baseline characteristics of study subjects
Anthropometric and laboratory data of the study subjects.
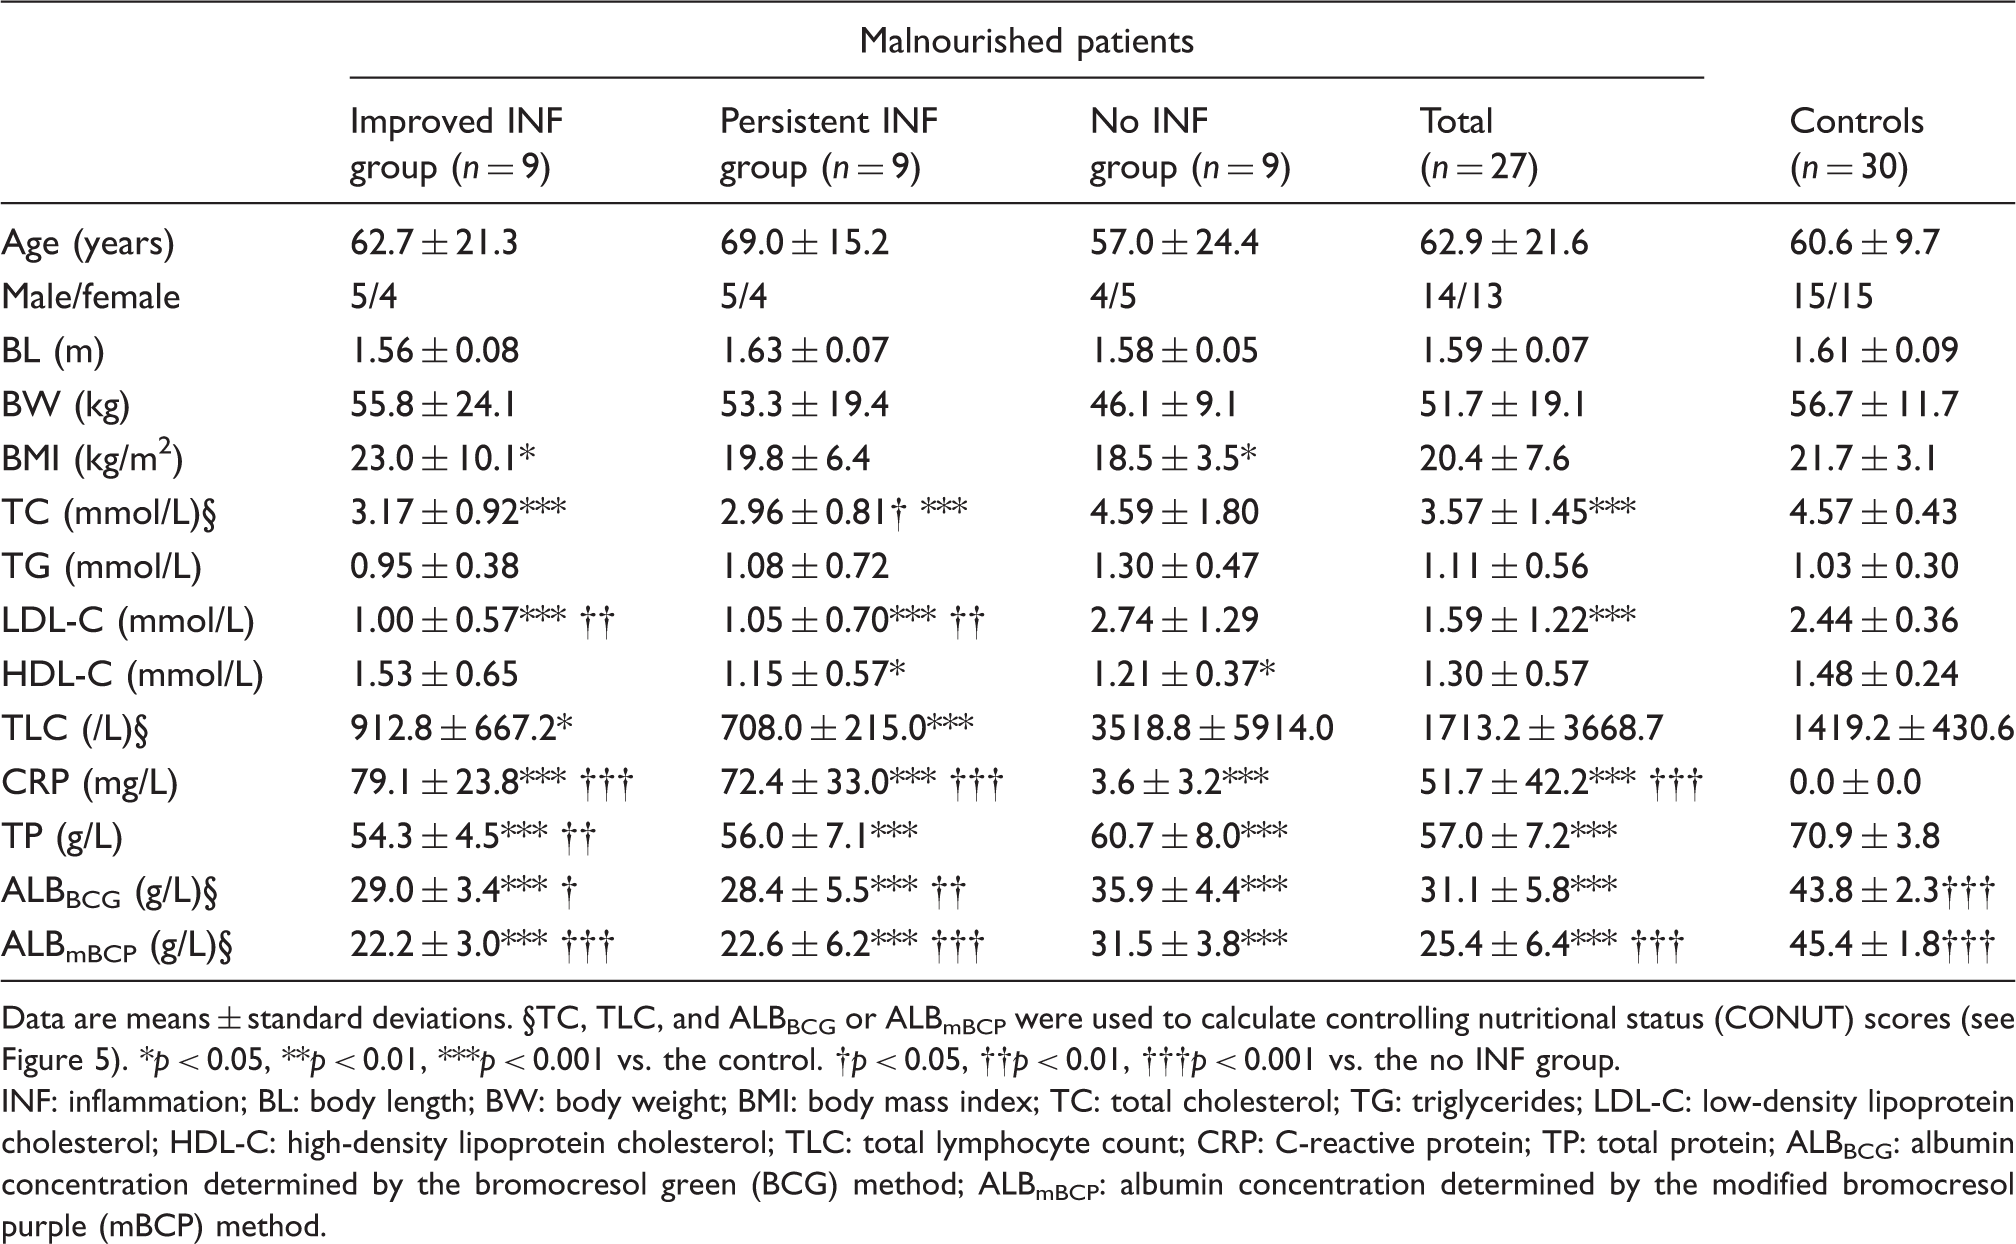
Data are means ± standard deviations. §TC, TLC, and ALBBCG or ALBmBCP were used to calculate controlling nutritional status (CONUT) scores (see Figure 5). *p < 0.05, **p < 0.01, ***p < 0.001 vs. the control. †p < 0.05, ††p < 0.01, †††p < 0.001 vs. the no INF group.
INF: inflammation; BL: body length; BW: body weight; BMI: body mass index; TC: total cholesterol; TG: triglycerides; LDL-C: low-density lipoprotein cholesterol; HDL-C: high-density lipoprotein cholesterol; TLC: total lymphocyte count; CRP: C-reactive protein; TP: total protein; ALBBCG: albumin concentration determined by the bromocresol green (BCG) method; ALBmBCP: albumin concentration determined by the modified bromocresol purple (mBCP) method.
Relationship between INF and discrepancy in albumin concentrations measured by the BCG and mBCP methods
Severity of INF was closely associated with the difference between ALBBCG and ALBmBCP. Serum CRP concentrations were positively correlated with ΔALB (r = 0.59, p < 0.001; Figure 1(a)) and ALBBCG/ALBmBCP (r = 0.57, p < 0.001; Figure 1(b)). Notably, ALBBCG/ALBmBCP was always > 1.0 in malnourished inpatients. However, even in patients with CRP < 5 mg/L (n = 13), 31% of patients had ΔALB values >10%.
Associations between C-reactive protein (CRP) and change in albumin (ΔALB, %) and the ratio of albumin concentrations determined by the bromocresol green (BCG) and modified bromocresol purple (mBCP) methods (ALBBCG : ALBmBCP) in 44 malnourished patients. ΔALB was defined as [(ALBBCG − ALBmBCP)/ALBBCG] × 100 (%). The association was analysed by calculating Pearson’s correlation coefficients.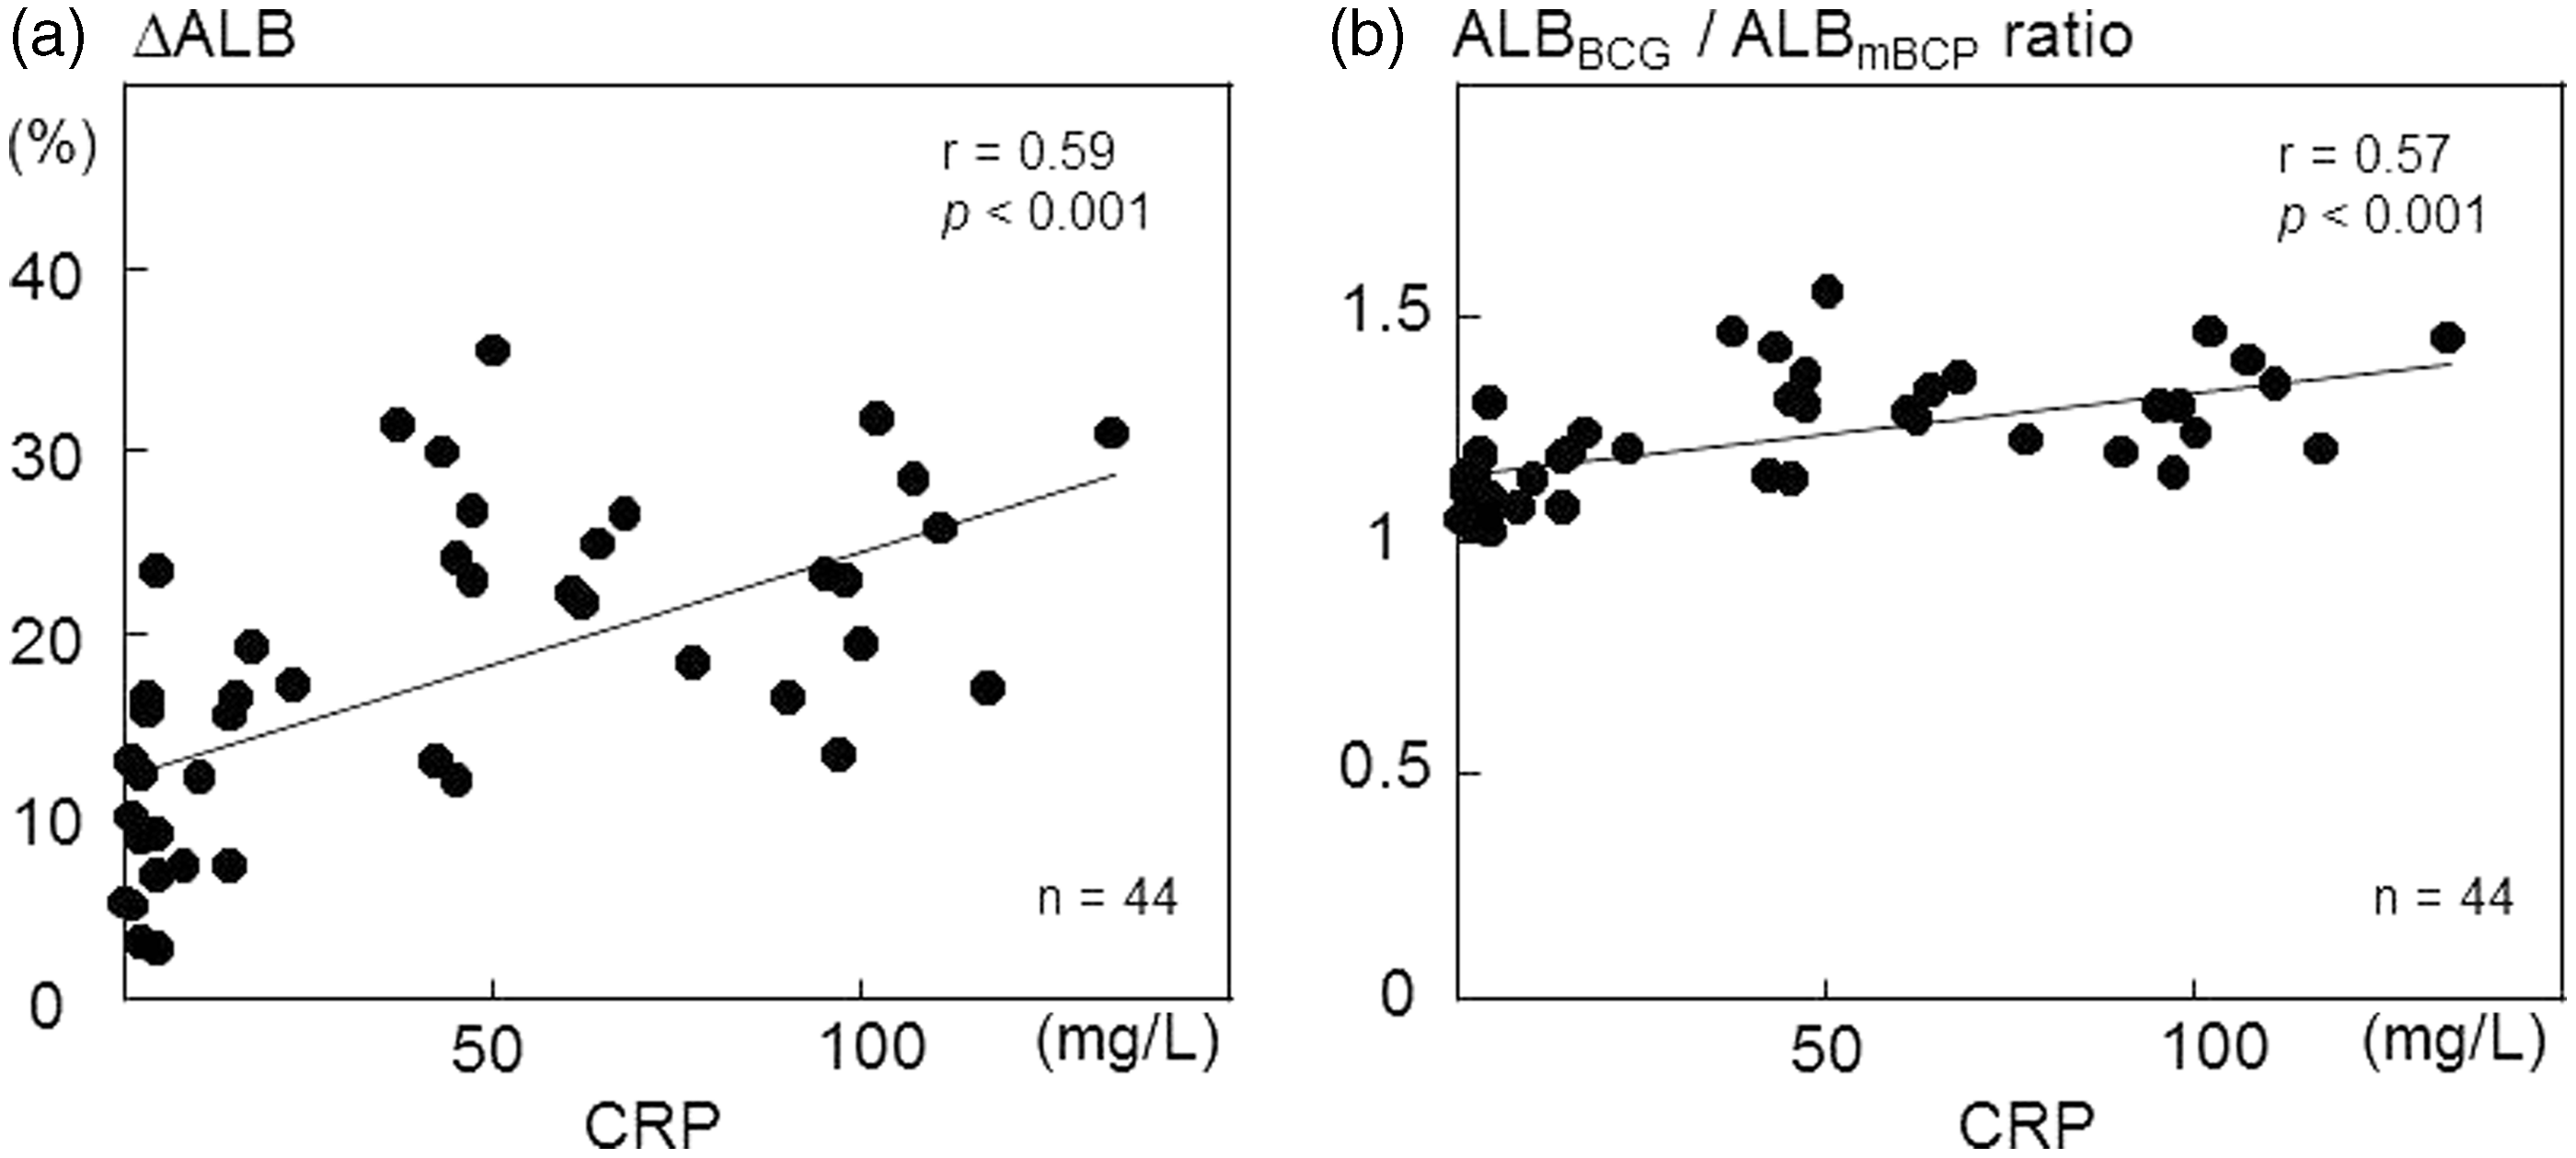
Effects of haptoglobin on albumin measurements
We performed serum protein electrophoresis in some subjects to determine the protein fractions that increased during INF. Densitometric analyses revealed that patients with high CRP levels had increased α1 and α2 fractions. In contrast, patients with normal CRP levels showed almost normal patterns. Representative patterns are shown in Figure 2.
Serum protein electrophoresis densitometry patterns. Serum samples were obtained from patients with (a) or without inflammation (b). Protein fractions were stained with Ponceau 3R after separation on a cellulose-acetate membrane. Concentrations were calculated using total protein concentrations and the densitometrically determined areas of individual fractions.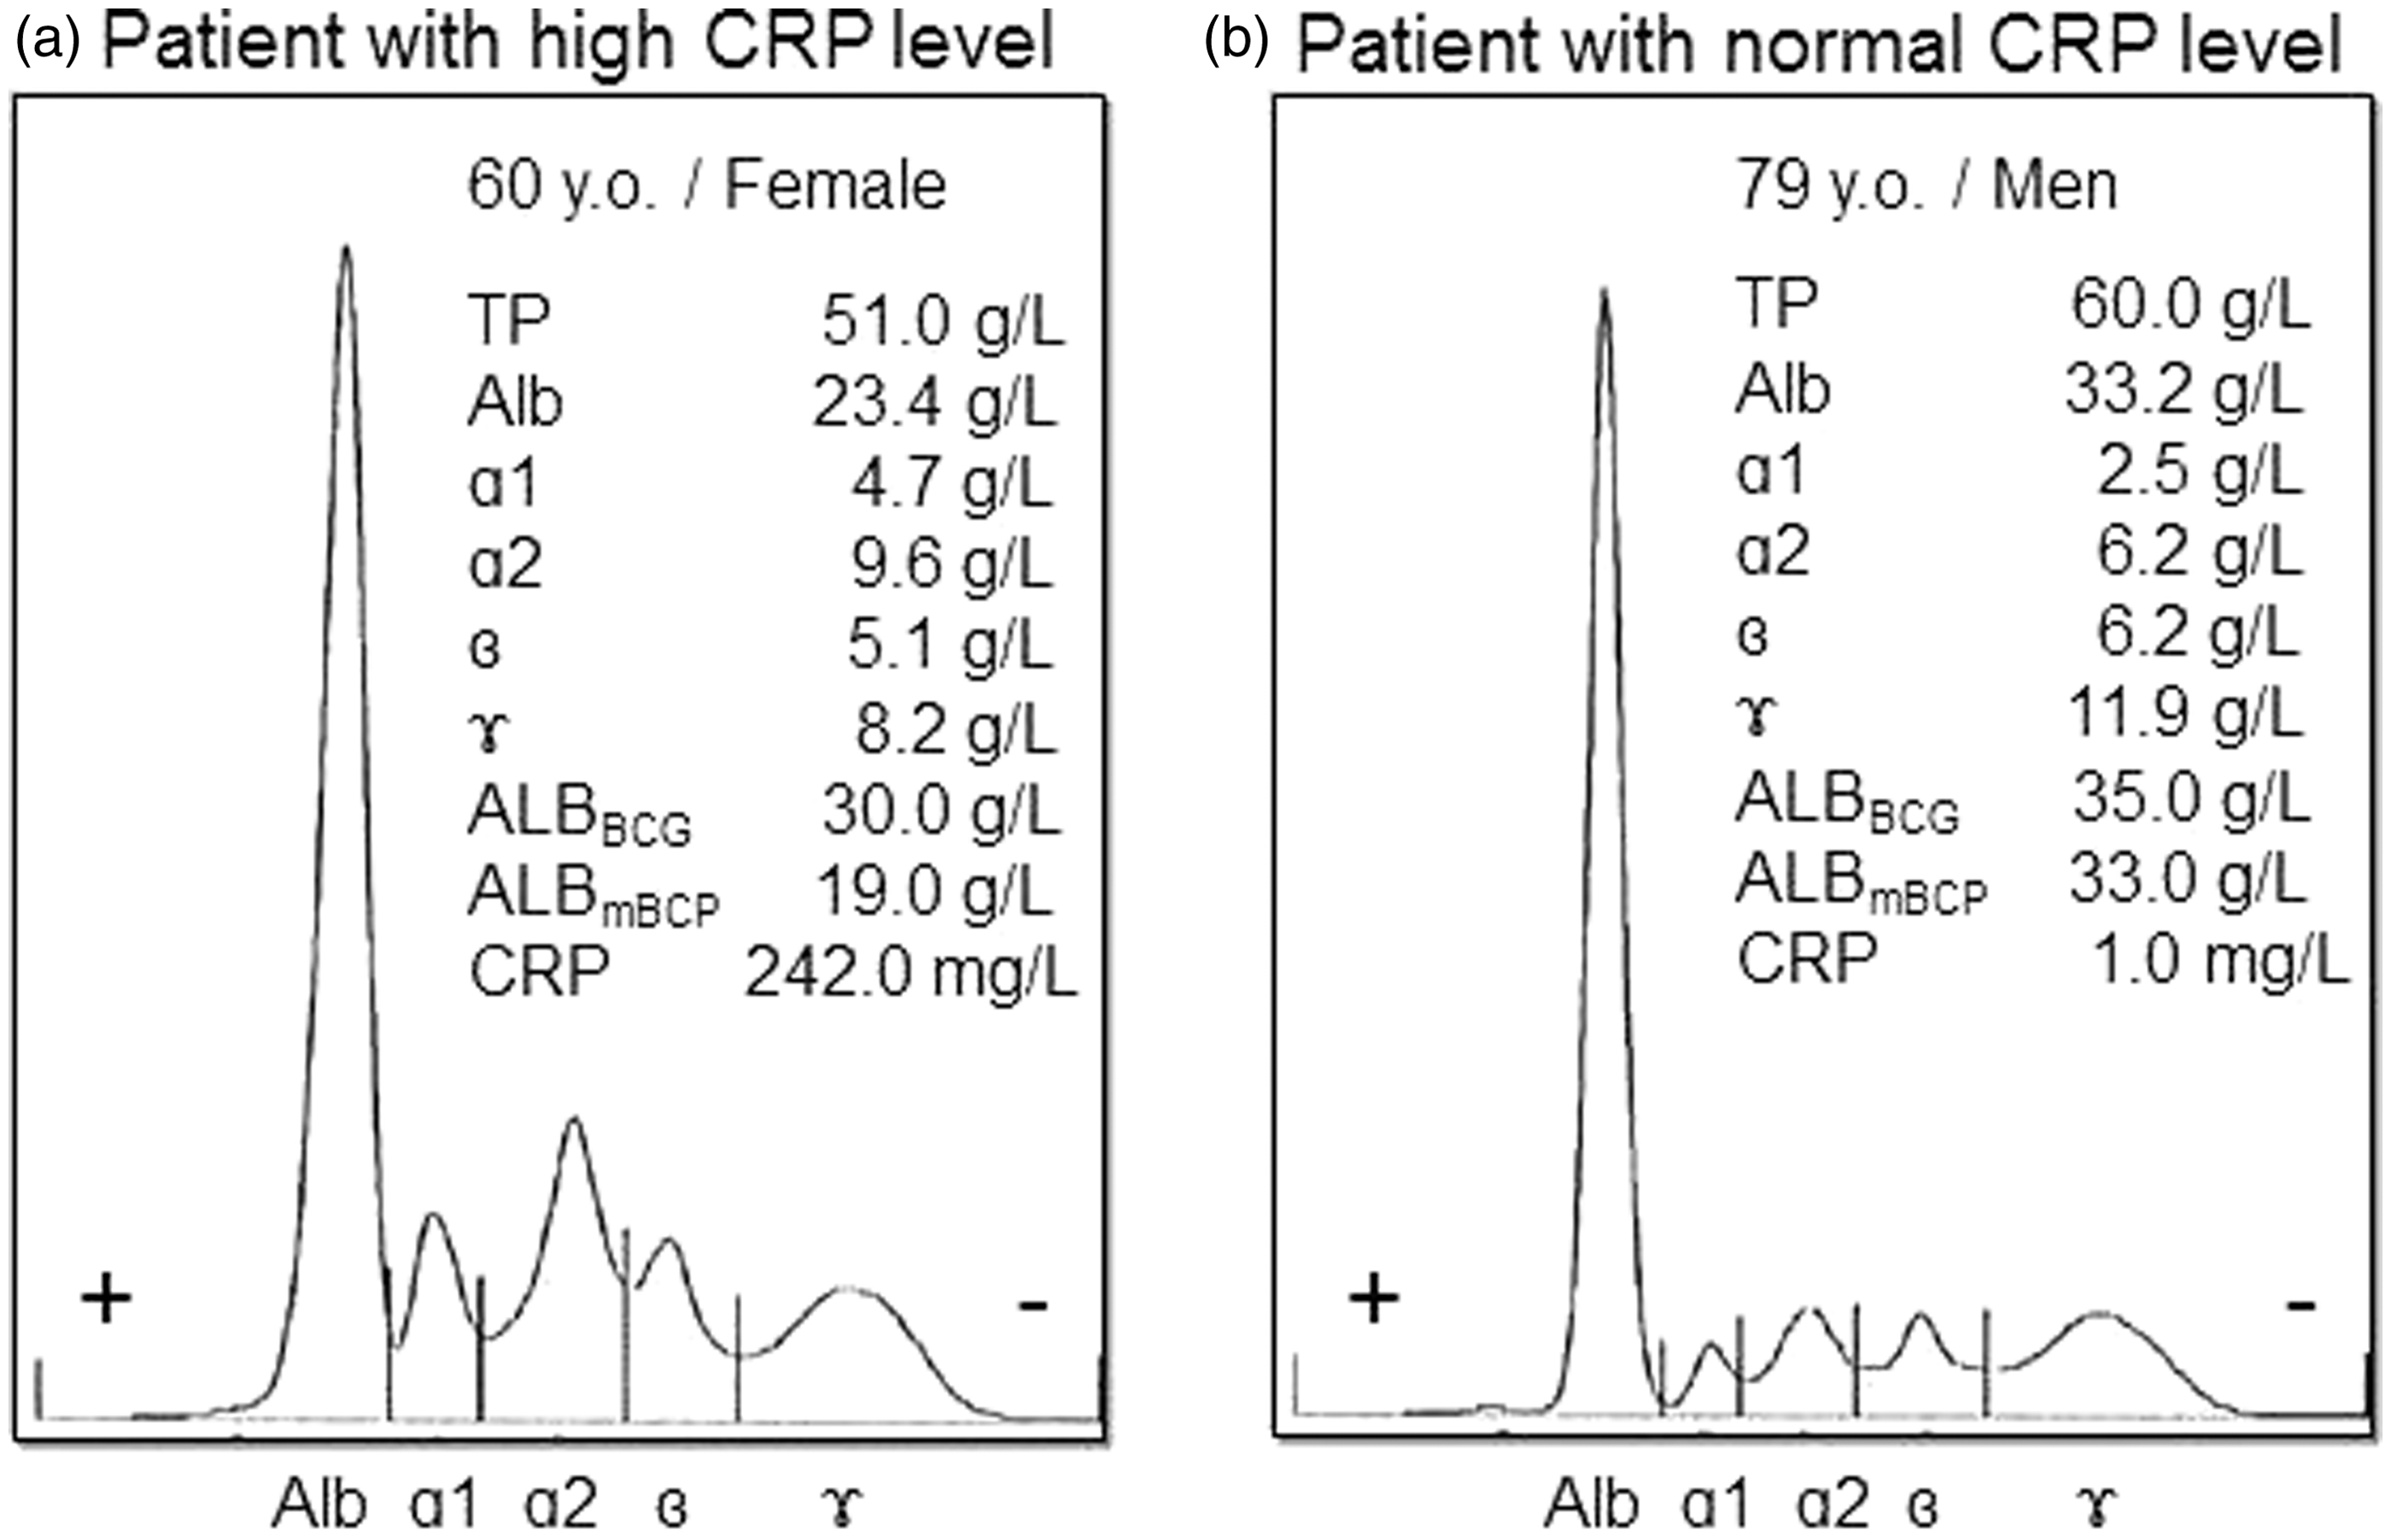
Then, we examined the effects of haptoglobin on ALBBCG and ALBmBCP values in vitro. Haptoglobin increased ALBBCG in a dose-dependent manner (Figure 3, solid line), but did not affect ALBmBCP (Figure 3, dotted line).
Effects of haptoglobin on albumin measurements. We prepared human albumin samples that contained purified haptoglobin at the concentrations indicated. Albumin concentrations were determined using the BCG and modified BCP methods (ALBBCG and ALBmBCP). ***p < 0.001 vs. ALBmBCP at the same haptoglobin levels; †††p < 0.001 vs. ALBBCG at 0.0 g/L of haptoglobin.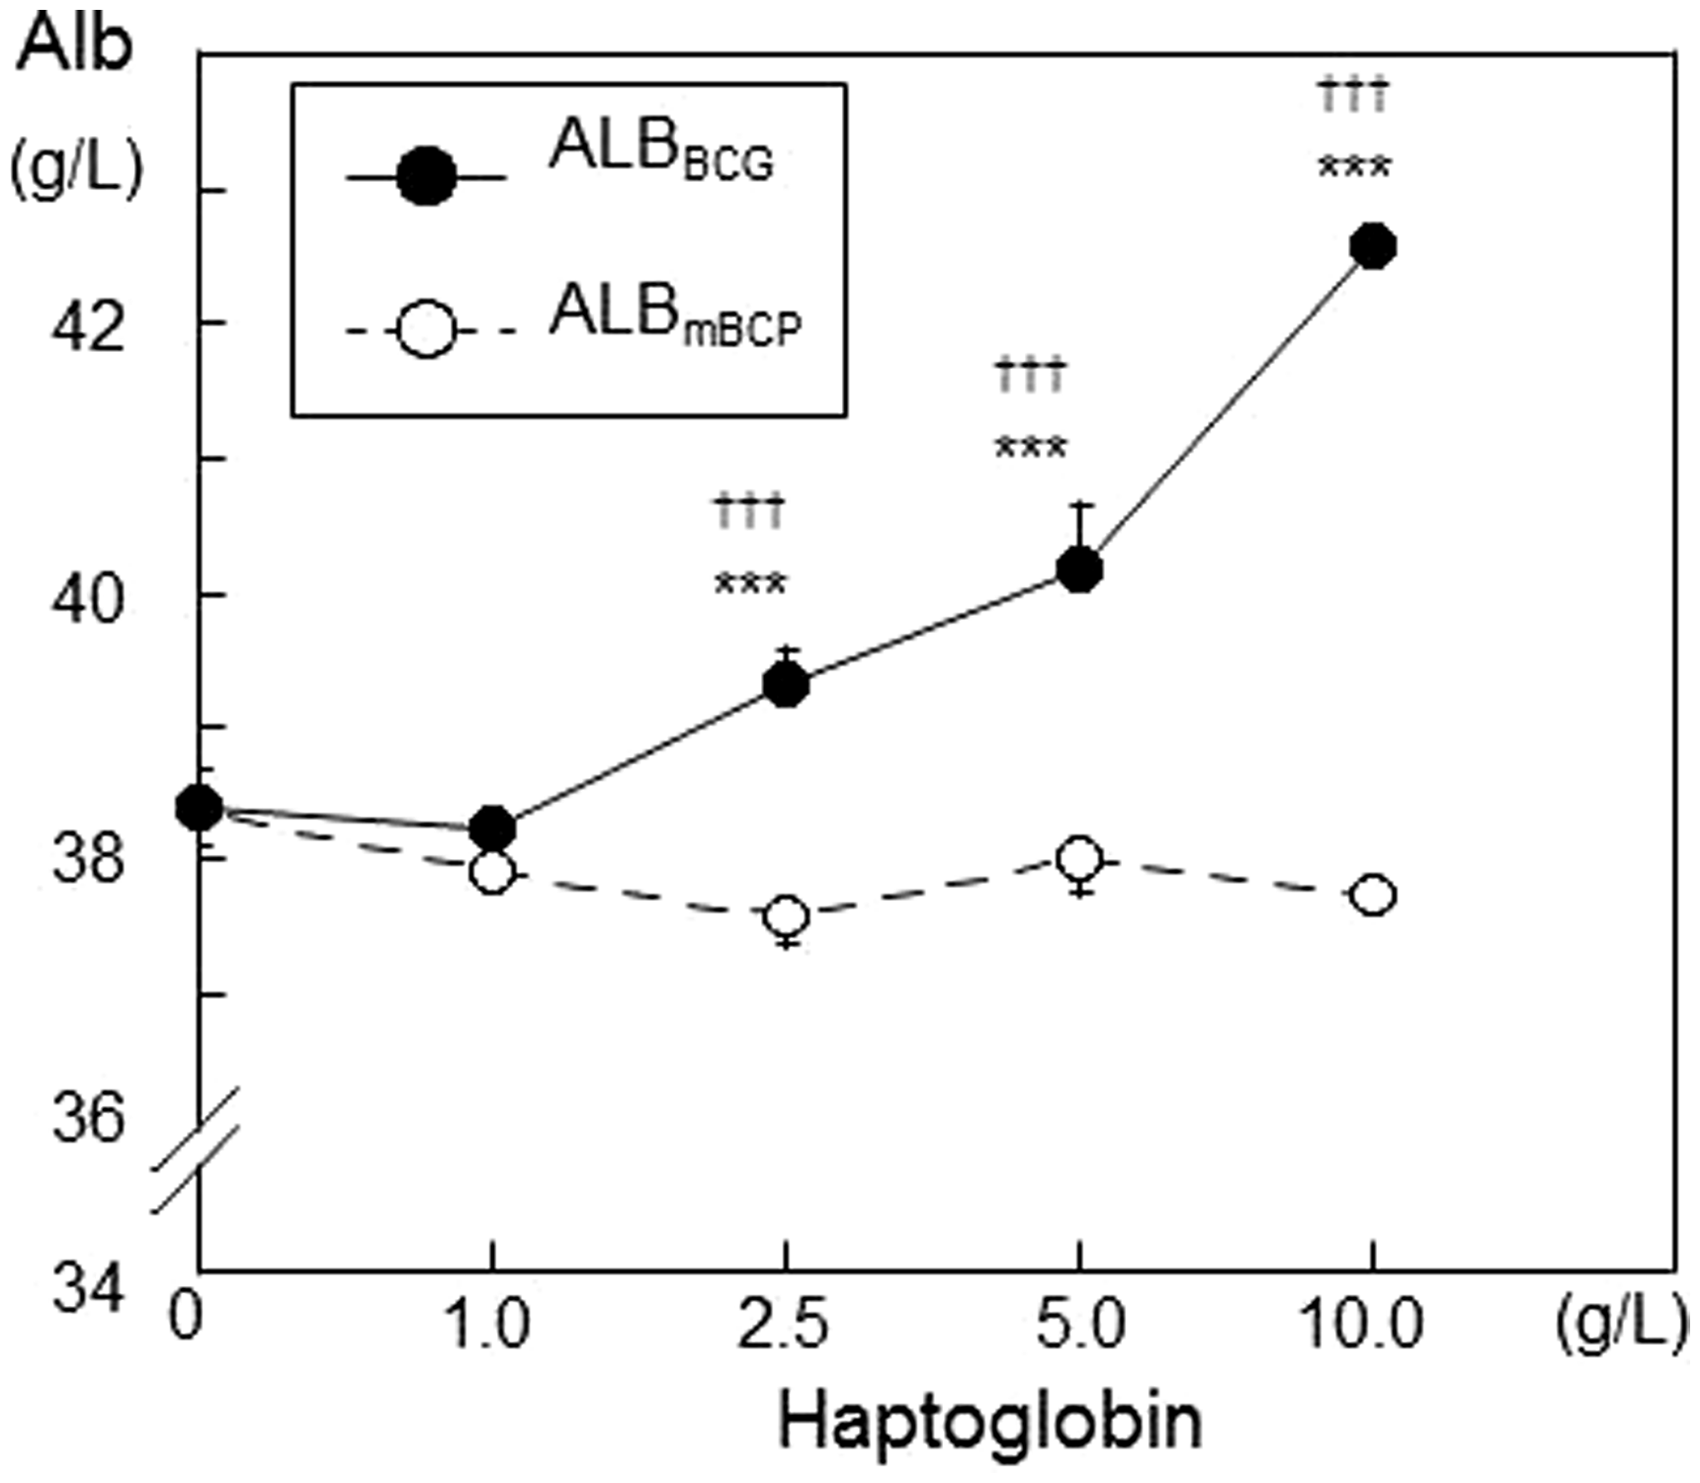
Effects of INF on albumin measurements and CONUT scores
To clarify the influence of INF on albumin measurements in a clinical setting, we divided the malnourished patients into three groups according to INF status (persistent, improved, or absent) during nutritional intervention (persistent INF, improved INF, and no INF groups: Table 1). We then calculated the CSs of each patient. CRP levels were altered differently in these three groups during nutritional intervention (Figure 4(a)). TP, ALBBCG, and ALBmBCP improved gradually in the improved INF and no INF groups during nutritional intervention, but those in the persistent INF group showed no difference during nutritional intervention (Figure 4(b)–(d)).
Changes in C-reactive protein (CRP) (a), total protein (TP) (b), and albumin concentrations determined by the bromocresol green (ALBBCG) (c) and modified bromocresol purple (ALBmBCP) (d) methods in malnourished patients with varying degrees of inflammation during nutritional intervention. CRP, TP, ALBBCG, and ALBmBCP levels were followed in the persistent inflammation (INF) (○, n = 9), improved INF (▪, n = 9), and no INF (▴, n = 9) groups during four weeks of nutritional intervention. Data are means ± standard deviations. *p < 0.05, **p < 0.01, ***p < 0.001 vs. corresponding baseline; †p < 0.05, ††p < 0.01, †††p < 0.001 vs. the improved INF group at the same time point; #p < 0.05, ##p < 0.01, ###p < 0.001 vs. the no INF group at the same time point.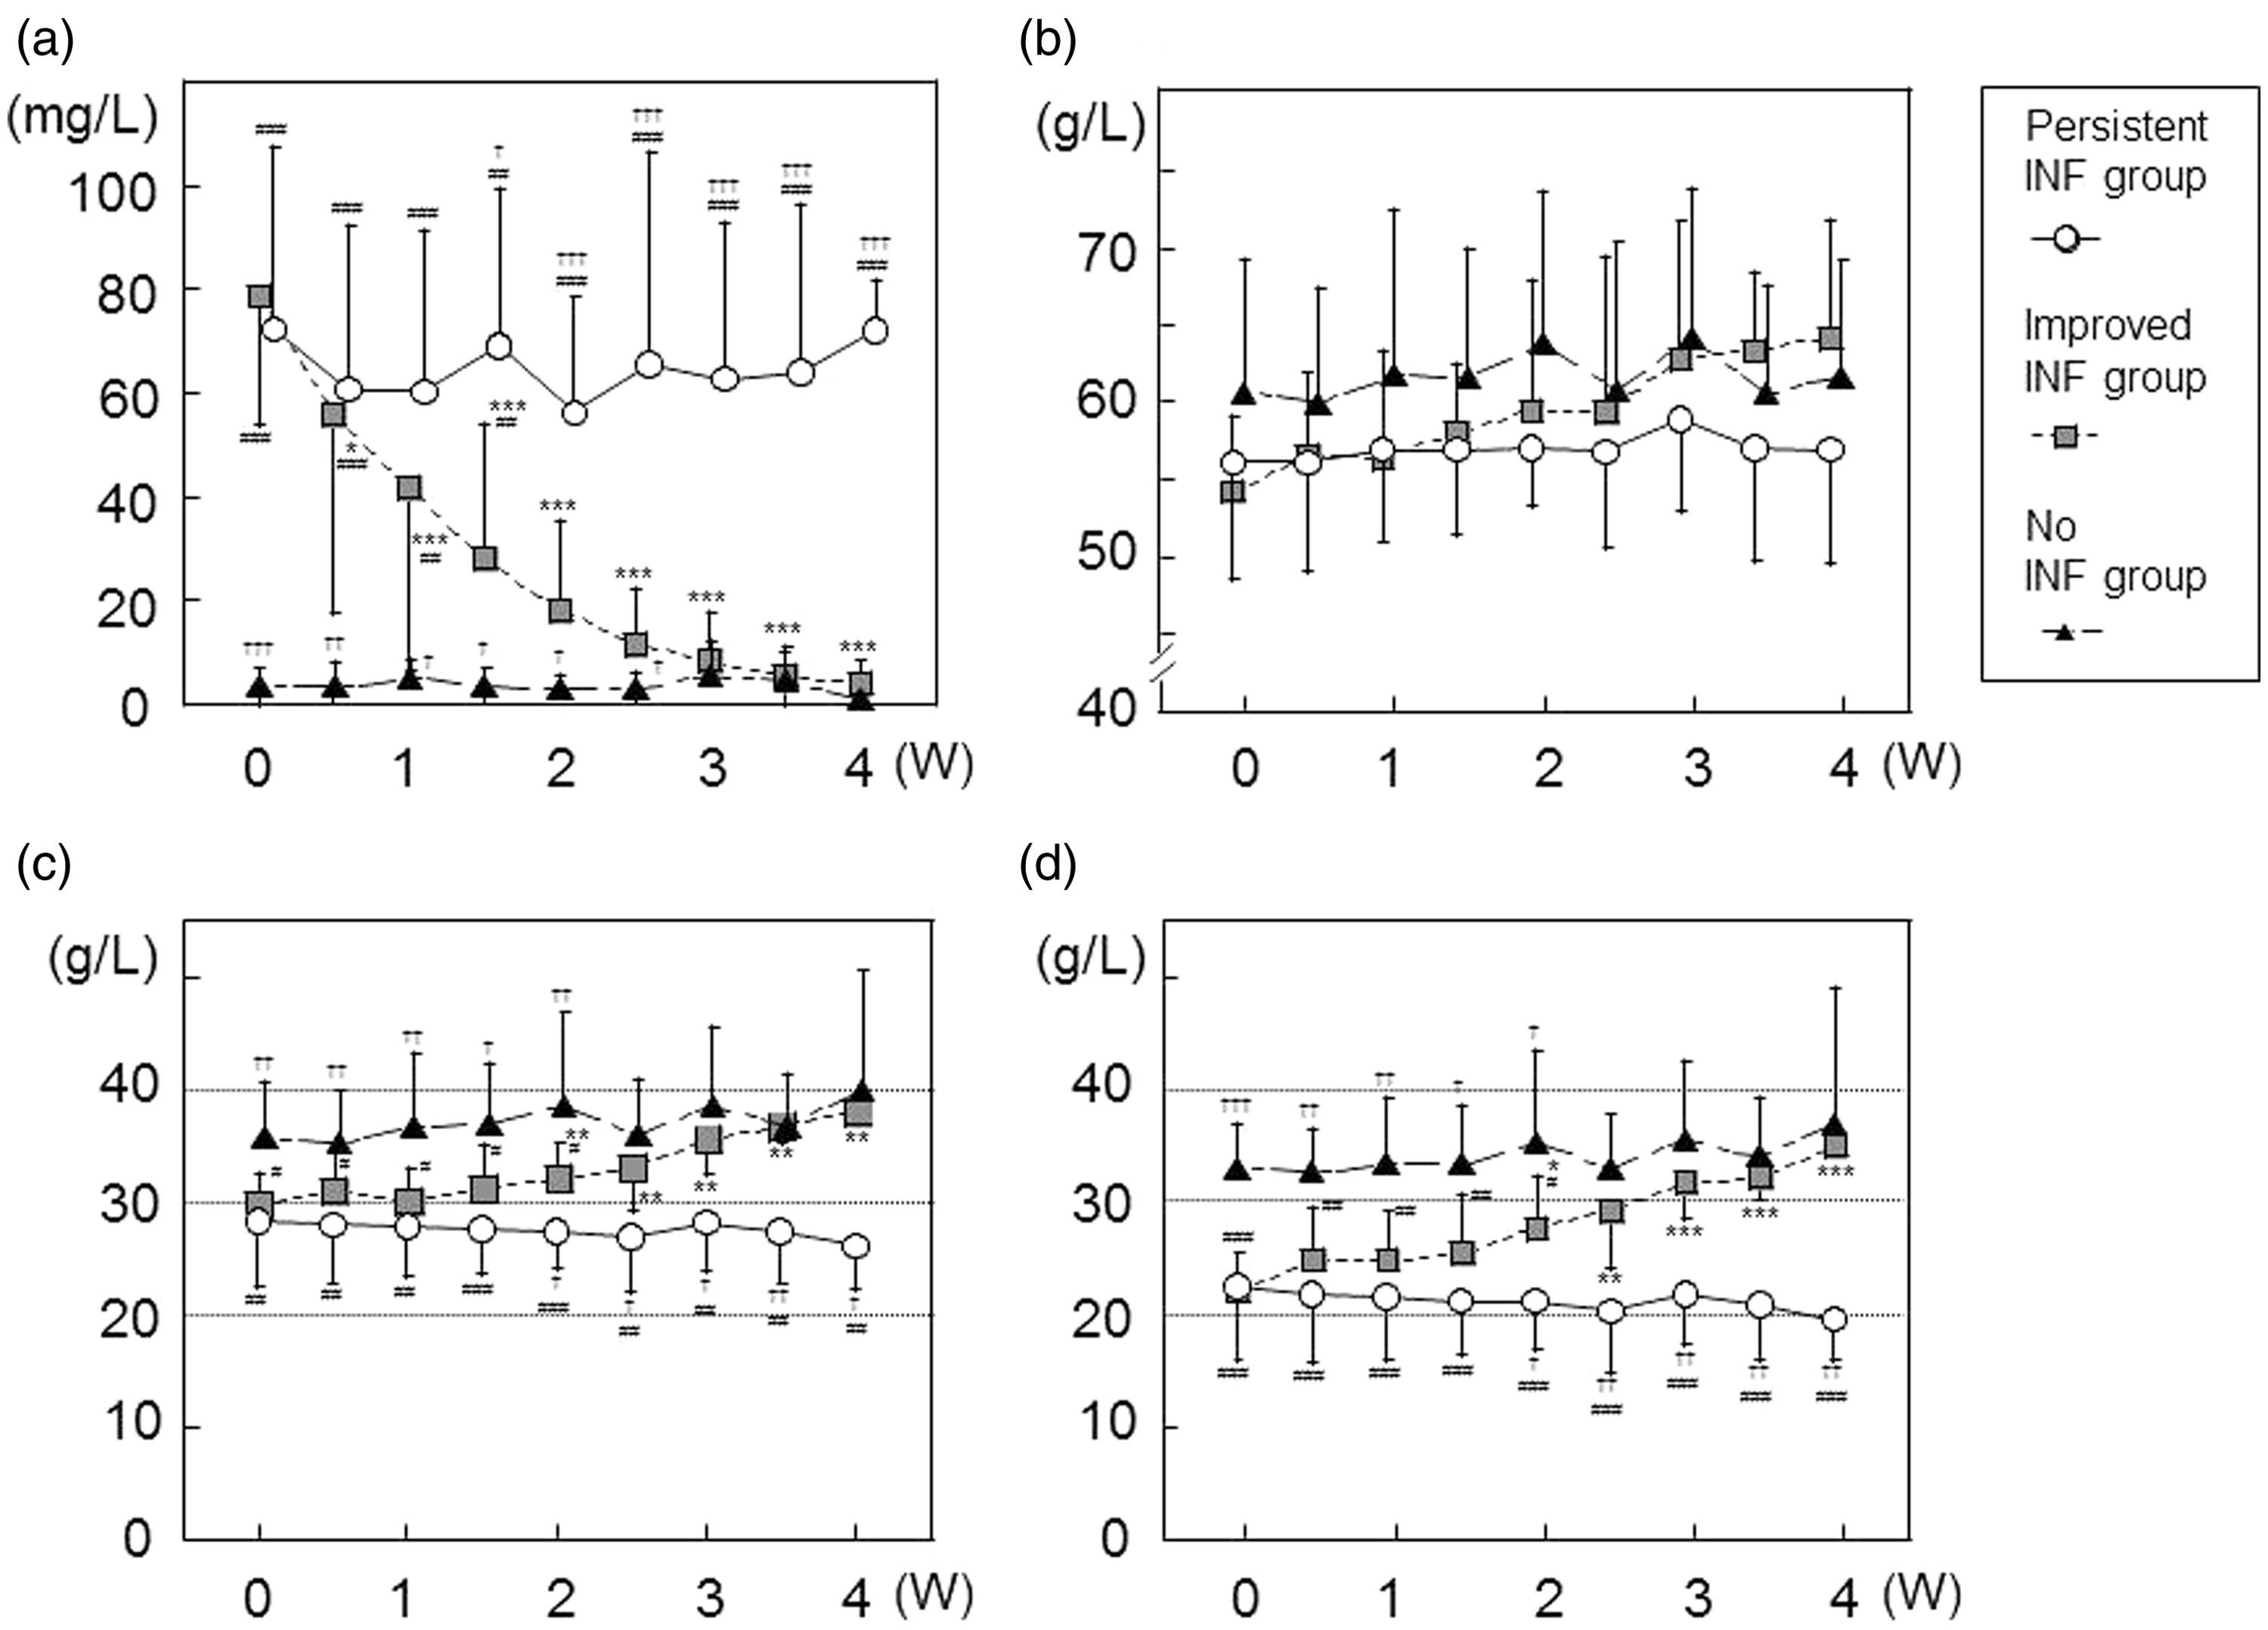
CS-BCGs were not in accordance with CS-mBCPs in patients with INF (Figure 5(a) and (b)). CS-BCGs were always lower than CS-mBCPs in malnourished patients with persistent INF (persistent INF group) (Figure 5(a)). In contrast, in patients whose INF improved during the clinical course (the improved INF group), differences between CS-BCGs and CS-mBCPs continued to decline as CRP concentration decreased (Figure 5(b)). CS-BCGs and CS-mBCPs did not differ significantly in patients with no INF (no INF group) (Figure 5(c)).
Relationship between C-reactive protein (CRP) levels and controlling nutritional status (CONUT) scores (CSs) in malnourished patients with different inflammatory statuses during nutritional intervention. Changes in CSs in malnourished groups are shown in (a)–(c). CSs calculated with albumin values determined by the bromocresol green method (CS-BCGs) in the persistent inflammation (INF; •, n = 9), improved INF (▪, n = 9), and no INF (▴, n = 9) groups. CSs calculated using albumin values determined by the modified bromocresol purple method (CS-mBCPs) in the persistent INF (○, n = 9), improved INF (□, n = 9), and no INF (Δ, n = 9) groups. Data are expressed as medians. *p < 0.05, **p < 0.01, ***p < 0.001 vs. corresponding baseline; †p < 0.05, ††p < 0.01 vs. CS-BCGs at the same time point.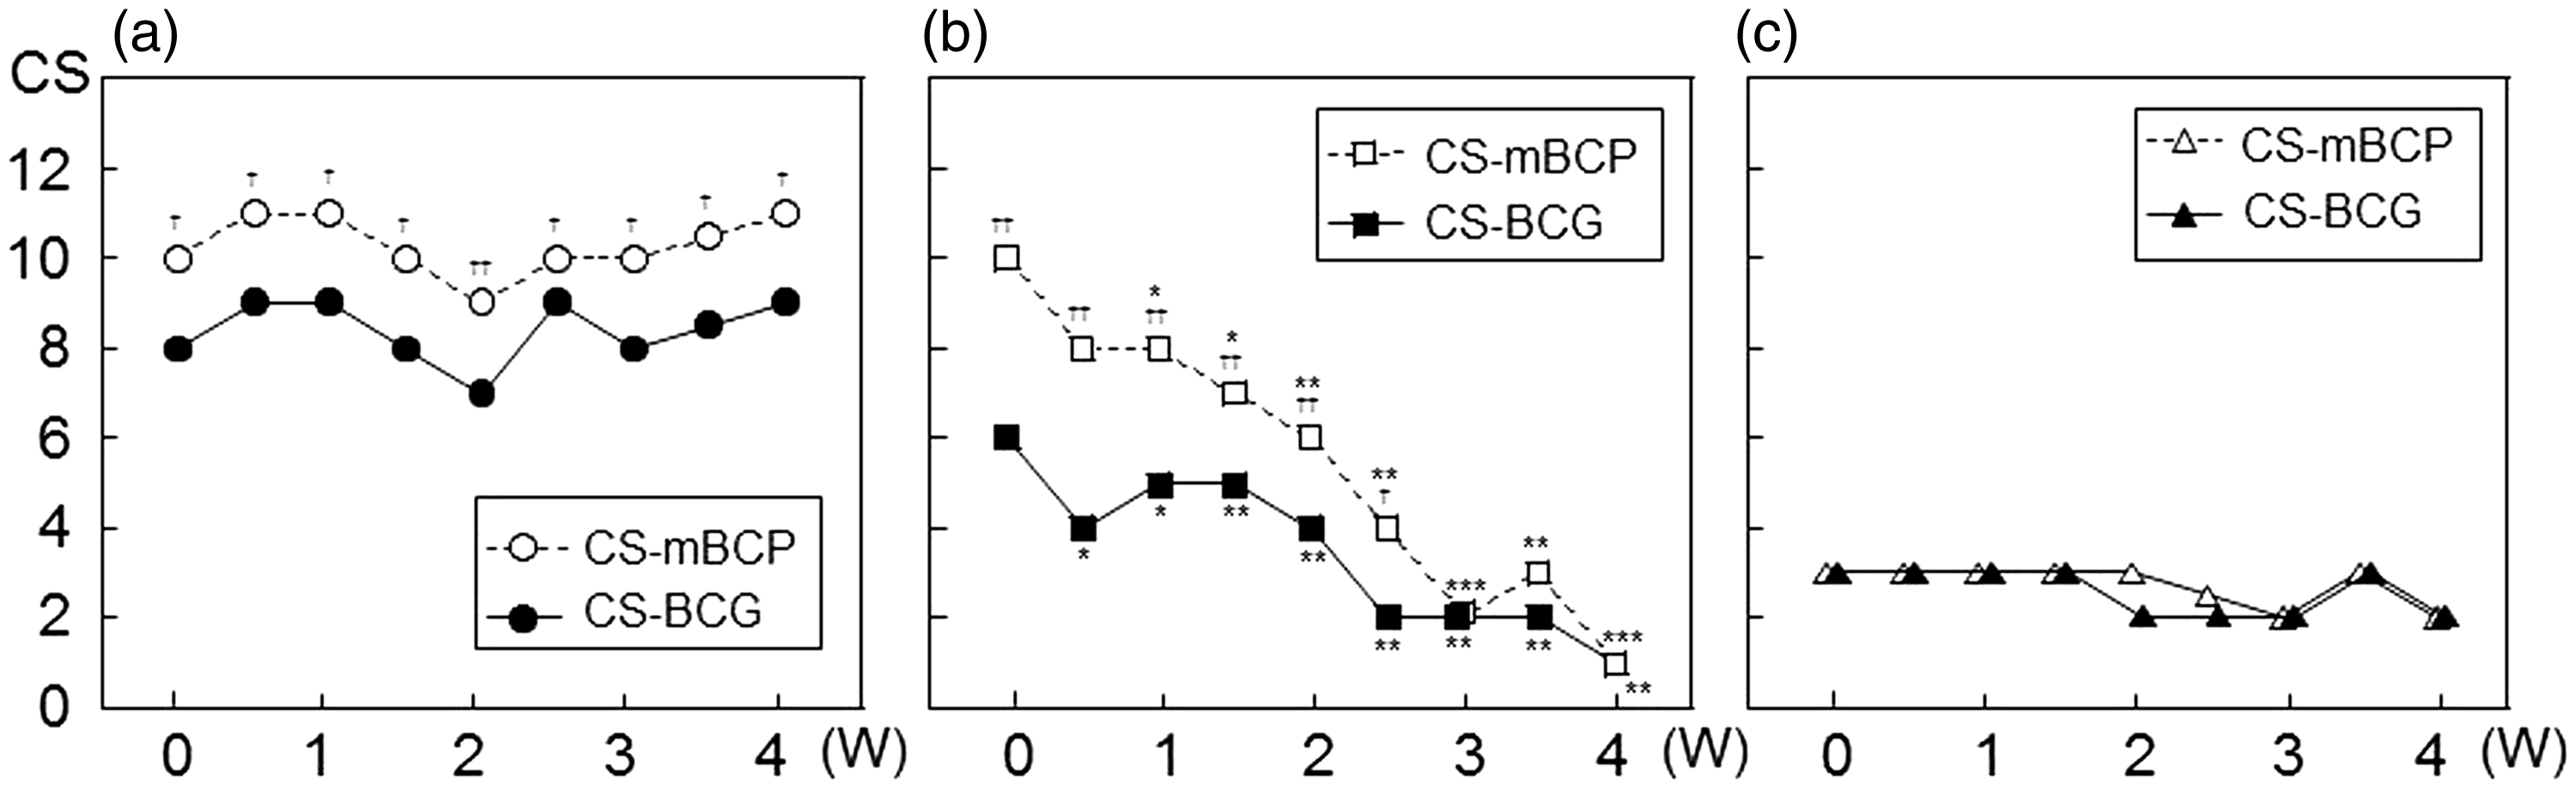
Discussion
The results of this study clarify that the choice of albumin assay affects assessment of nutritional status using the CS during INF. We found that assessment of nutritional status with CS-BCGs tended to classify malnourished patients into better nutritional categories than an assessment based on CS-mBCPs. This inconsistency was observed only in patients with INF (Figure 5(a) and (b)).
Although immunological methods and electrophoresis are more specific for albumin measurements compared with dye-binding methods,19,20 BCG, BCP, and mBCP assays are still used in clinical laboratories for this purpose. Among the various dye-binding assays, the mBCP assay is superior to the BCG assay in terms of its specificity for albumin. 15 BCG reacts not only with albumin, but also with acute-phase proteins, such as α-globulins, which increase during INF. 11 Webster 21 separated globulin fractions from concentrated serum samples using cellulose acetate electrophoresis and extracted these fractions from the membranes for in vitro experiments. Although all globulin fractions reacted with the BCG reagent, the α2-fraction had nearly two-fold higher reactivity than the α1- and γ-globulin fractions. Since they did not examine individual proteins in the α2-fraction, it remains to be determined which proteins are responsible for interference with the BCG reagent and to what extent such proteins affect ALBBCG. We carried out in vitro experiments by adding highly purified haptoglobin to albumin solutions, because haptoglobin is one of the typical acute-phase proteins with α2-mobility, and increases during INF.22,23
Although we could not evaluate all acute-phase proteins, our in vitro experiments clearly showed that haptoglobin interfered with the BCG method, but not with the mBCP method (Figure 3). In general, ALBBCG was higher than ALBmBCP during INF (Figure 4(c) and (d)), which lead to overestimation of nutritional status using the CS-BCG (Figure 5(a) and (b)). Haptoglobin is one of the major proteins in the α2-fraction, and markedly increases during INF.22,23 In our in vitro experiments, we determined the final concentrations of haptoglobin that cover the ranges of fluctuation during INF. Therefore, haptoglobin may be a cause of the positive bias in ALBBCG.
During INF, ALBmBCP reflects nutritional status more accurately than ALBBCG, because BCP does not react with α-globulins. 13 In other words, CS-mBCP is more reliable than CS-BCG for assessing nutritional status. Our results strongly suggest that the BCG assay overestimate the albumin concentration, particularly in patients with INF (Figures 1, 4(c), and (d)). In this case, CS-BCG was smaller than CS-mBCP, and some malnourished patients may be overlooked when assessed using the CS-BCG (Figure 5(a) and (b)).
Although the original BCP assay has some disadvantages described below, the mBCP assay is improved in its superior specificity for albumin. Albumin exists in a reduced (human mercaptalbumin, HMA) or oxidized (human nonmercaptalbumin, HNA) form in human serum. HMA is a major form of serum albumin, but a significant amount of HMA is oxidized during storage. The original BCP assay reacts less with HMA than HNA, whereas the mBCP assay reacts equally with both forms. 15 Albumin concentrations measured by the original BCP assay increased in temperature- and time-dependent manners. To prevent this phenomenon, the mBCP assay reagents contain sodium dodecyl sulfate and 5,5′-dithiobis (2-nitrobenzoic acid). With these modifications, the mBCP assay yields stable values under various sample storage conditions. 15 However, the mBCP method has not yet been disseminated worldwide.
During INF, CS-mBCP is likely a better surrogate marker of nutritional status than RTPs such as retinol-binding protein, transthyretin, and transferrin. The half-lives of RTPs in human serum are 0.5–7 days, whereas that of albumin is a few weeks.7,9 Inflammatory cytokines inhibit hepatic synthesis of these marker proteins, including albumin. Due to their shorter half-lives, the serum concentrations of RTPs are likely to fluctuate more than those of albumin when INF improves or deteriorates in a relatively short period of time.
There are some limitations in our study. First, we did not measure haptoglobin concentrations in our patients. Thus, we could not show the relationship between ALBBCG and haptoglobin in the malnourished patients receiving NST intervention. Second, other proteins may also interfere with the BCG reagents in vivo. Third, representative dye-binding assays have other shortcomings that may affect assessments of nutritional status. For example, albumin values are lower in patients undergoing hemodialysis using the BCP assay than when using the BCG assay due to the presence of 3-carboxy-4-methyl-5-propyl-2-furanpropanoic acid (CMPF) in the serum.24,25 CMPF cannot be removed from circulation by hemodialysis and prevents BCP from binding to albumin. Therefore, the BCG assay is preferable for albumin measurement in patients undergoing hemodialysis, because no such interference has been reported for this assay. However, lithium heparin plasma causes a negative bias in ALBBCG, but has no effect on albumin values measured by the BCP assay.26,27 This finding is important because some laboratories use heparin plasma for biochemical tests to reduce report turnaround time. Although ALBmBCP is reliable even in patients with INF or elevated HNA levels, high-dose penicillin G treatment was found to falsely decrease ALBmBCP values by about 50%. 28 Those authors reported that penicillin G may compete with the albumin BCP binding site or interfere with the BCP colour reaction. Thus, it is possible that other undetermined interference may affect dye-binding assays.
We conclude that the choice of albumin assay affects the assessment of nutritional status using CSs in patients with INF. We strongly recommend that the modified BCP assay, not the BCG assay, be used to assess nutritional status, independent of INF.
Footnotes
Acknowledgements
We would like to thank Kainos Laboratories for providing the albumin assay kits.
Declaration of conflicting interests
T Satoh is an employee of Roche Diagnostics.
Funding
This research was supported by Grants-in-Aid for Science Research from the Ministry of Education, Science, and Culture of Japan (No. 22590535, 2010–2012 to SH and No. 23590689, 2011–2013 to TM) and a grant from the Sportology Center, Juntendo University Graduate School of Medicine (SH).
Ethical approval
The study protocol was approved in advance by the ethics committee of Juntendo University Hospital, and the study was conducted in full accordance with the Declaration of Helsinki, revised in 2008.
Guarantor
TM.
Contributorship
TU, SH, M Ito, T Shimizu, and TM designed the study and EN, HS, M Idei, and YH conducted the research. TU, SH, YF, T Satoh and HO analysed the data. TU, SH and TM wrote the paper, and SH had primary responsibility for the final content. All authors reviewed and edited the manuscript and approved the final version of the manuscript.