
Abstract
Background
Harmonization of reference intervals for analytes that have a sound calibration and metrological traceability is a widely recommended practice. The UK Pathology Harmony has recently harmonized reference intervals for calcium and albumin. In this study, we have determined the reference intervals for calcium and albumin on the UK’s most commonly used analytical platforms.
Method
A prospective reference population of healthy individuals was recruited according to the IFCC CRIDL criteria. A second indirect population was collected from 14 primary care setting and measured in laboratories using various analytical platforms and methods (Roche, Abbott, Beckman and Siemens analytical platforms).
Results
In total, 299 subjects were recruited; the central 95th centile values for calcium for three out of four analytical platforms were in a close agreement with UK Pathology Harmony reference intervals of 2.2–2.6 mmol/L. Reference intervals of BCG methods from both cohorts and irrespective of analytical platforms were higher for both lower and upper reference limits than those for BCP. In comparison, the indirect study showed an age-related variation. The younger population reference intervals varied by up to 5.7% at the lower reference limit and up to 12% at the upper reference limit compared with Pathology Harmony reference intervals, and the older population showed a variation of up to 14% at both limits.
Conclusion
While calcium reference intervals can be a subject for harmonization, albumin reference intervals studied showed large variation which is unsupportive of embracing a common reference interval for albumin.
Introduction
There is a growing assumption among physicians and patients that test results from different laboratories are equivalent and can be interpreted using common reference intervals. This has been a challenging problem for the specialty of laboratory medicine, and a pragmatic approach was taken by several UK professional bodies to develop a set of harmonized reference intervals for assays with an established standardized calibration system. 1 The UK Pathology Harmony initiative used a mixture of pragmatic and scientific approaches to dealing with existing variations in reference intervals. They recommended reference intervals of 2.2–2.6 mmol/L and 35–50 g/L for calcium and albumin, respectively, without regard to analytical method.
It has long been recognized that there are differences between methods for calcium and albumin. Moreover, there is growing evidence that there are additional physiological differences in serum albumin concentration due to age and gender.2–4 Since calcium is a largely albumin-bound cation, knowledge about albumin assay performance is essential to validate the adjusted calcium equation. 5 In fact, the practice of using equations that adjust calcium to a single albumin concentration, regardless of age or gender has recently been criticized. 3
Reference intervals represent a distribution of test values and are regarded by users of clinical laboratories to describe healthy individuals. Derivation of reference intervals is a laborious and costly task due to the need to collect samples from individuals who fit pre-defined criteria and then analysing their samples under strict protocols defining the pre-analytical, analytical and statistical methods. Recently, the International Federation of Clinical Biochemistry (IFCC) evaluated a less laborious approach for reference interval establishment using an indirect approach which makes use of routine retrospective laboratory data. 6 In contrast to the traditional approach (direct approach), this technique does not require an assessment of individual participating subjects and is less expensive than the direct approach. Nevertheless, exclusion and inclusion criteria also need to be clearly defined to filter out extreme results that may influence the reference interval in question. 7
Clinical laboratories are expected to provide reference intervals with their test results. This is supported by the European Union Directive on In Vitro Diagnostic Medical Devices which requires manufacturers to provide reference intervals specific for their methods and analytical platforms. The International Organisation of Standardisation (ISO) 15189 mandates medical laboratories to perform the periodic re-evaluation of their reference intervals. 8 Finally, medical laboratories may choose to establish their own reference intervals as recommended by the IFCC. 9 Laboratories are supported by the IFCC which is currently coordinating worldwide multicountry reference interval studies using a standardized protocol which covers all aspects of reference interval. 10
This study aims to derive reference intervals for calcium and albumin and determine the magnitude of the methodological differences previously identified.11–13 We also compare our ranges with those provided by current manufacturers. We used a direct approach study involved in the recruitment of a local healthy population from West Yorkshire according to the IFFC-recommended protocol. 10 An indirect approach was used in collaboration with laboratories across the UK and Eire.
Materials and methods
Direct approach
A prospective reference population of healthy individuals was recruited according to the IFCC Committee on Reference Intervals and Decision Limits (C-RIDL protocol). 10 Subjects were recruited using advertisements at three hospitals in the region: the Leeds Teaching Hospitals, Hull Royal Infirmary and Harrogate Hospital. Participants were asked to complete a short health questionnaire about their general health. The health questionnaire included demographic data such as date of birth, gender, race and habitual alcohol and tobacco consumption. Details of medical history of disease and prescribed and over-the-counter medication were recorded. This study was approved by the National Research Ethics Committee (Ref 11/H/1302/5).
Exclusion criteria for reference individuals
Regular drug therapy for chronic diseases (diabetes, hypertension, hyperlipidaemia, gout, depression), Known diabetes on oral therapy or insulin (diet alone was acceptable). Know CKD, liver disease or endocrine disorders Had results from their blood samples that clearly pointed to a disease. Unusual or strenuous exercise during the preceding three days. Female participants who were pregnant or lactating. History of chronic liver or kidney disease or any other significant disease or disorder
Blood collection
Blood was collected by a single phlebotomist (AL). A tourniquet was avoided whenever possible. In the few cases when a tourniquet was necessary, it was applied and released within less than 1 min to minimize the effects of venous stasis. To reduce variation due to postural influence, the participants were requested to sit for 10 min prior to blood collection. 14 Repeated fist pumping was not allowed. Blood was collected into Vacuette gel separator serum tubes. Each tube was inverted at least five times. For incompletely filled tubes, the remaining vacuum was released to avoid vacuum-induced haemolysis. A single batch of phlebotomy equipment was used.
Sample analysis
Blood tubes were allowed to clot at room temperature for 30 min and within 6 h of venepuncture samples were centrifuged at 3000 g for 10 min at room temperature. Serum samples were aliquoted into a single batch of storage tubes (Vacuette Greiner, Stonehouse, UK).
Samples were analysed on the four most widely used analytical platforms in the UK for the measurement of total calcium and albumin. Analysis was undertaken on Roche Cobas (Roche Diagnostics Ltd, West Sussex, UK), Beckman Unicel DxI (Beckman Coulter Ltd, High Wycombe, UK). Abbott Architect i2000SR Plus (Abbott Diagnostics, Kent, UK) and Siemens Advia XP (Siemens Healthcare Diagnostics, Surrey, UK). This included two calcium methods: (1) NM-BAPTA (Roche), (2) ArsenazoIII (Beckman, Siemens Advia, and Abbott Architect) and two albumin methods: (1) BCP method (Beckman and Abbott Architect) and (2) BCG (Roche Cobas and Siemens Advia XP). All four laboratories participating in this study were ISO15189-accredited laboratories at the time of undertaking this study. All analysers were maintained as per the manufacturers’ standards, and manufacturers’ reagents were used as per their protocols. Each laboratory participated in external quality assessment by UKNEQAS, and all had acceptable performance throughout the duration of the study.
Indirect approach
Collaborating laboratories were recruited to ensure that data were collected from the four most commonly used analytical platforms in the UK (as for direct approach).
Laboratories were asked to collect data retrospectively and provide anonymized biochemical data from their laboratory information system (LIMS) according to a circulated protocol. The protocol specified collecting data solely from primary care settings for a period of two to three months. The extracted data from Primary care sources included the following variables: age (>18 years), gender, hospital number, albumin, alkaline phosphatase (ALP), alanine aminotransferase (ALT) and estimated glomerular filtration rate (eGFR). Laboratories were asked to provide the name of the analytical platform, albumin methods, reference intervals used for reporting and analytical performance indices for albumin method.
Data filtration was employed to exclude individuals with abnormal liver and renal tests. Abnormal enzymes were defined by ALT and ALP greater than the upper limit of the reference interval as defined by the host laboratory, and normal kidney function was defined biochemically by eGFR >60 mL/min/1.73 m2. Only patients with one set of results in the time window were included. The use of such samples from primary care sources was an attempt to reduce the number of diseased individuals. Data on pre-analytical factors such as patient preparation and venepuncture were not available.
Statistical analysis
Direct reference intervals
Statistical analysis was performed using the Analyse-it add-in package (version 2.10) for Microsoft Excel (www.analyse-it.com). The Dixon test was used to detect outliers. Reference intervals were calculated using the Quantile function method. After establishing a normal distribution, the reference interval was based on taking the central 95% range in accordance with the IFFC recommendations. 15 Distributions were assessed for normality using Anderson-Darling test. The test rejects the hypothesis of normality when the P-value is ≤0.05. Normally distributed values were suitable for parametric reference interval derivation, whereas a log transformation method was applied for non-normally distributed values. Data were excluded after analysis if there were missing or incomplete data.
Indirect reference intervals
Outliers were removed by iterative removal of results outside the interquartile range after log transformation as described by Inal et al. 16 Because of non-normalized distribution, the Box-Cox-log transformation method was used for reference interval derivation. Once the distribution was normalized, the reference interval was based on the central 95% range in accordance with IFCC recommendations. 11 Figure 1 was prepared on the Graph Pad Prism statistical package.
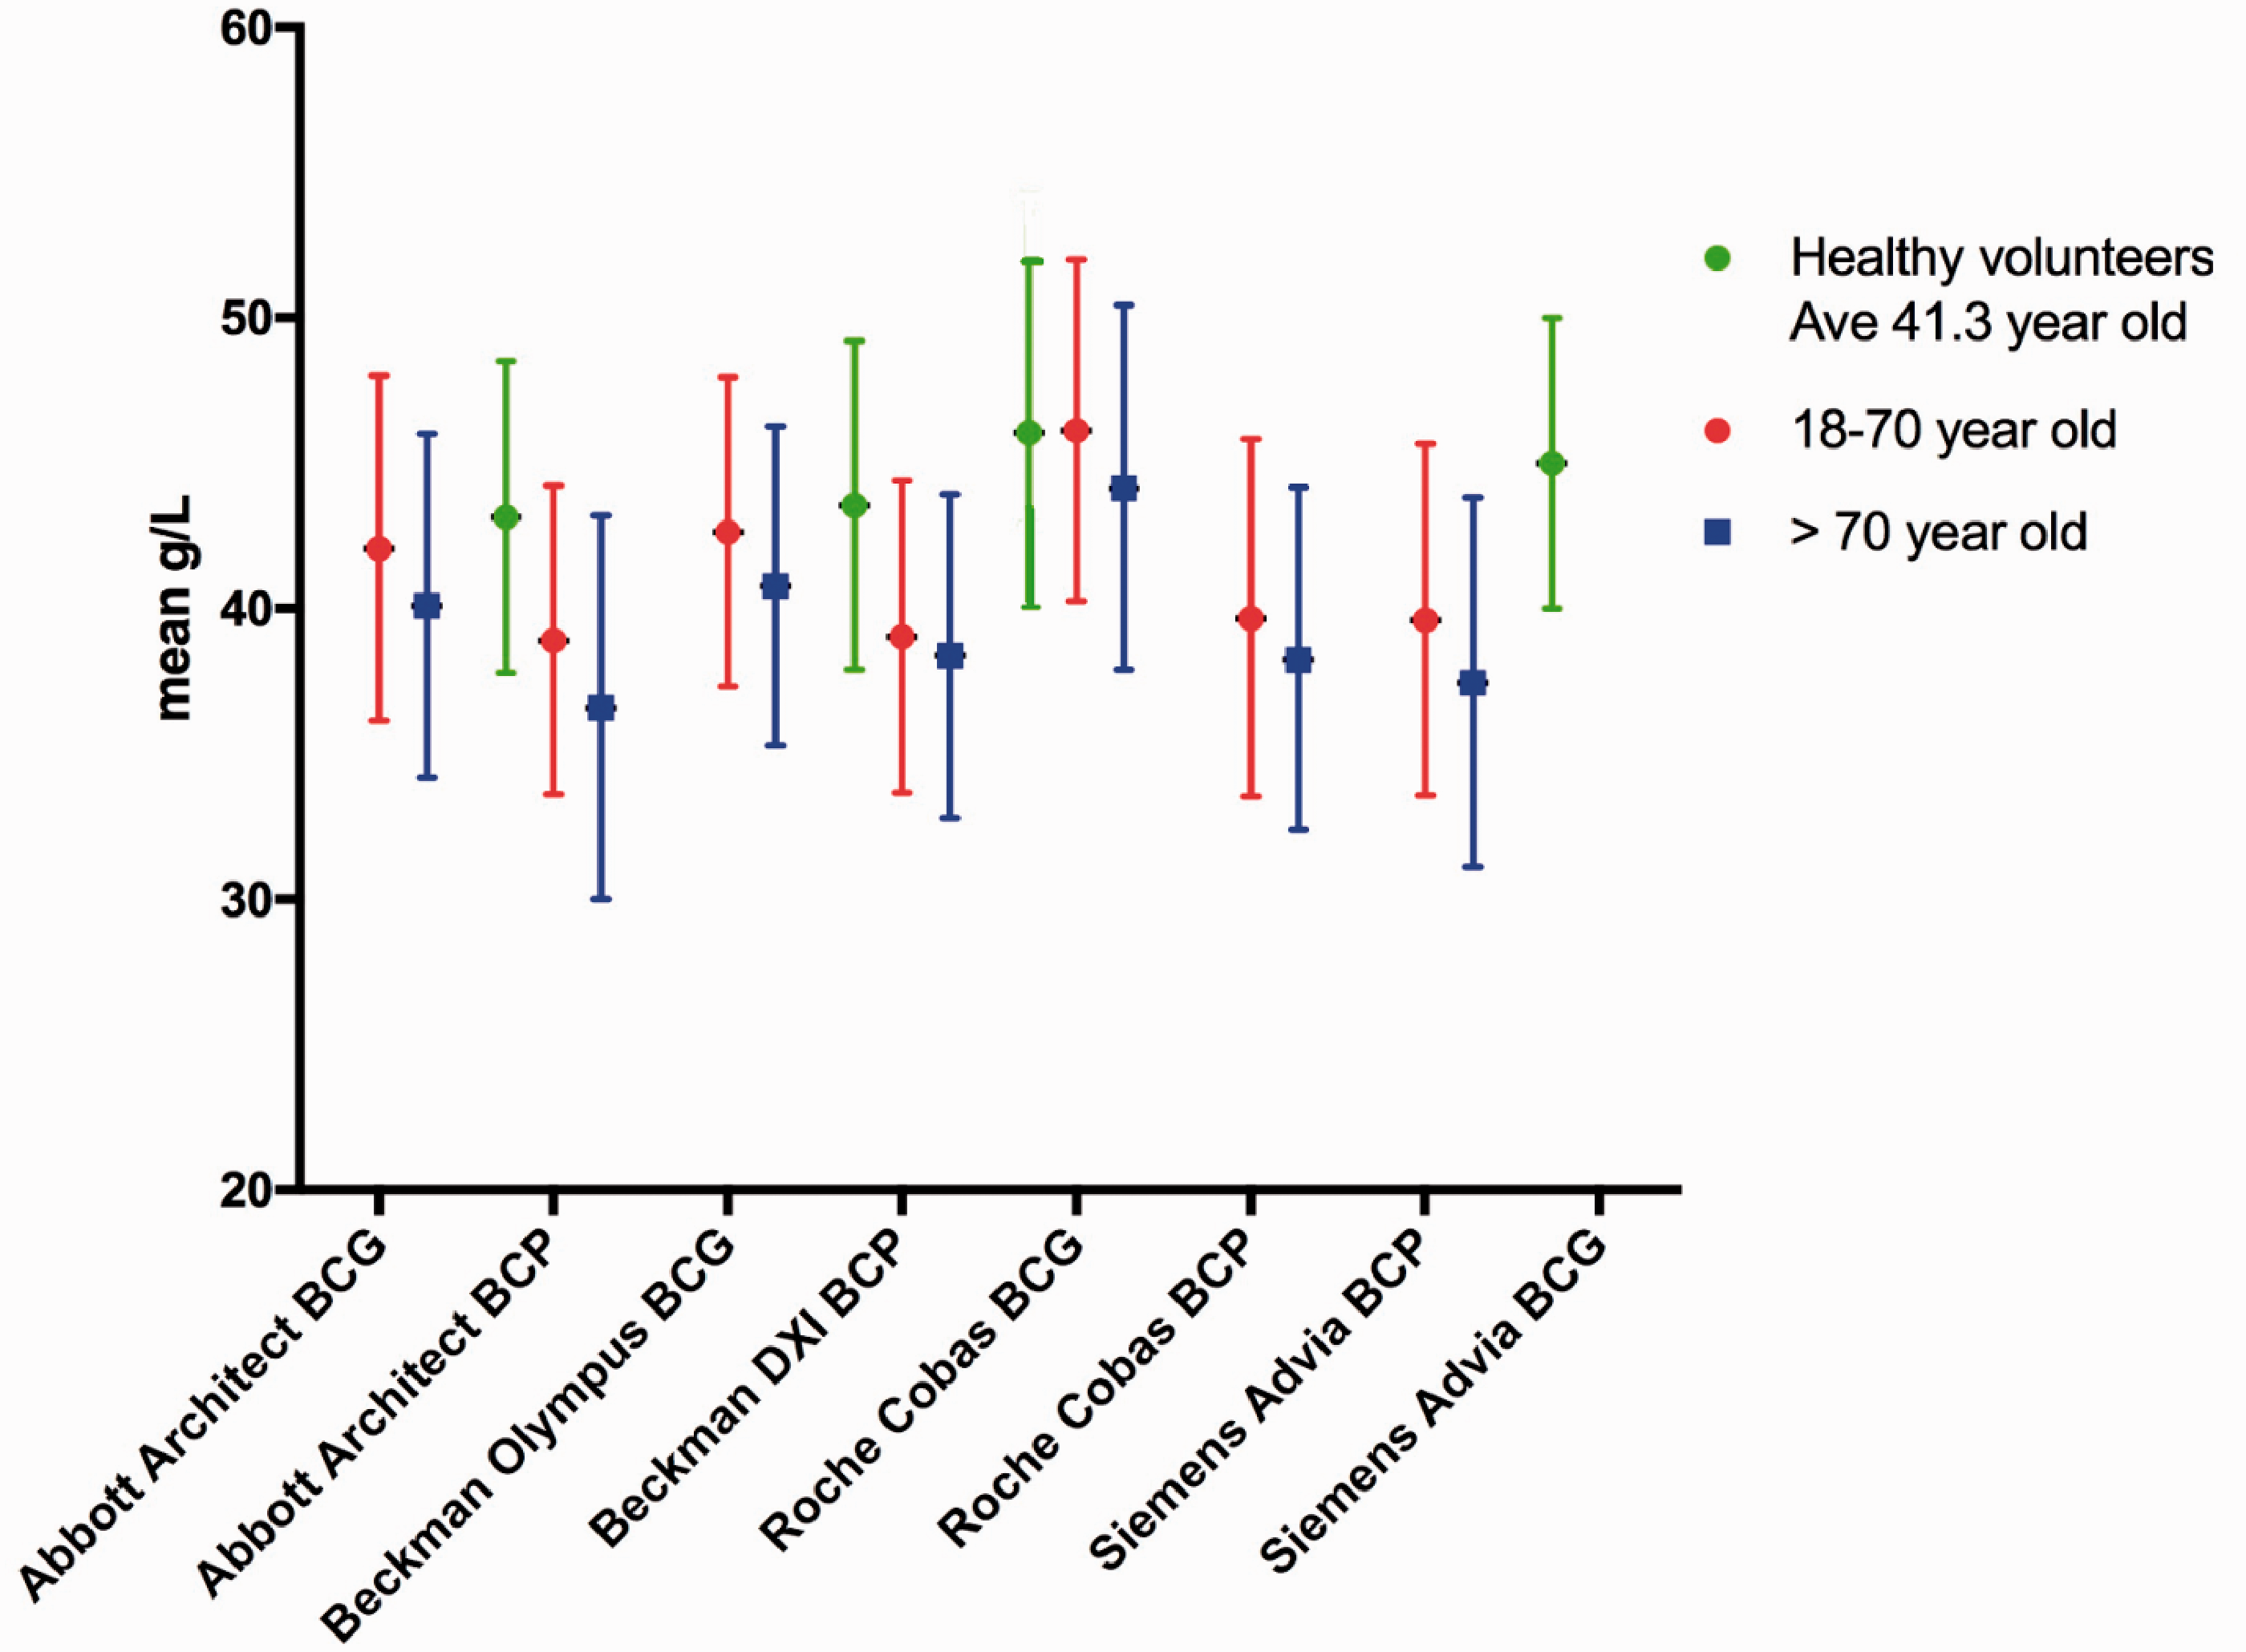
Albumin reference intervals from this study according to age and method compared to the UK Pathology Harmony recommended reference interval. Green lines represent direct reference intervals and red indirect, the dashed line represents the UK Pathology Harmony reference interval.
Results
Direct reference intervals study
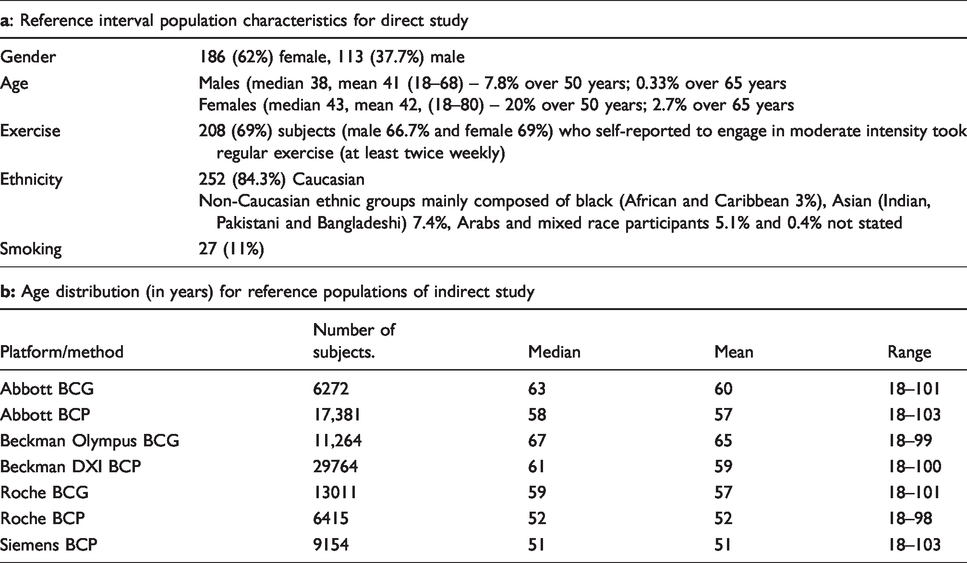
Two hundred and ninety-nine volunteers were recruited for the direct reference interval study (see Table 1a). The 2.5 and 97.5 percentiles for calcium and albumin are presented in Tables 2 and 3. This study showed a close agreement between the calcium-derived reference intervals and the UK Pathology Harmony-recommended reference intervals (2.2–2.6 mmol/L), with the exception of Siemens Advia XP. This latter method shows intervals limits on West Yorkshire subjects that are approximately 0.1 mmol/L (<5%) lower at both reference interval limits. There is a close agreement between calcium reference intervals derived from this study and those provided by the manufacturers except for Siemens (difference <5%) (see Table 4).
Reference interval population characteristics; (a) direct approach, (b) indirect approach.
Direct study – healthy population – reference intervals for total calcium (mmol/L) on various analytical platforms.
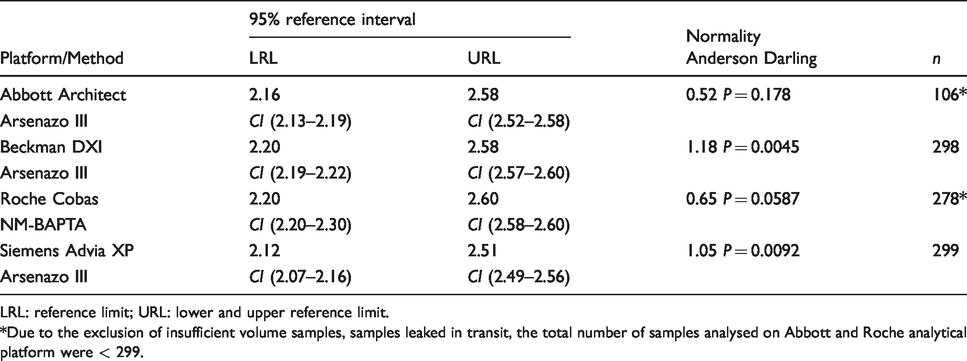
LRL: reference limit; URL: lower and upper reference limit.*Due to the exclusion of insufficient volume samples, samples leaked in transit, the total number of samples analysed on Abbott and Roche analytical platform were < 299.
Direct study – healthy population – Reference intervals for albumin (g/L) on various analytical platforms.
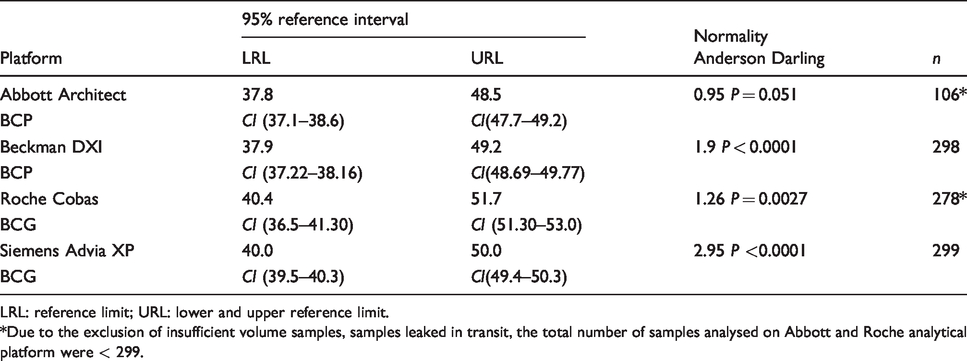
LRL: reference limit; URL: lower and upper reference limit.*Due to the exclusion of insufficient volume samples, samples leaked in transit, the total number of samples analysed on Abbott and Roche analytical platform were < 299.
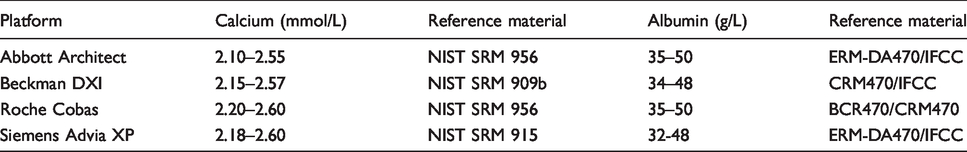
Reference interval for albumin and calcium as provided by the manufacturers and traceability of methods used to calculate the reference interval.
Indirect study – data mining – Reference intervals for albumin methods (g/L) on various analytical platforms for 18–70 years old cohort.
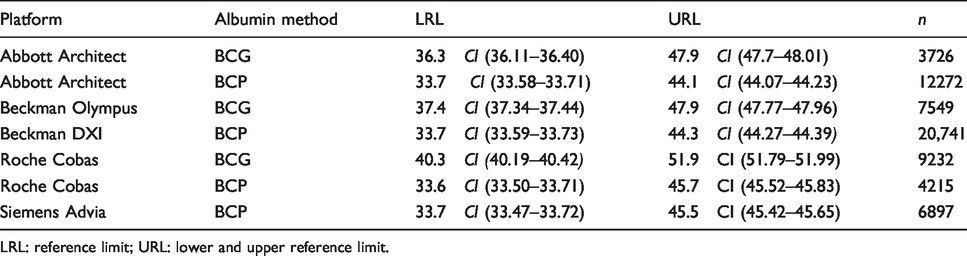
LRL: reference limit; URL: lower and upper reference limit.
UK Pathology Harmony recommended an albumin reference interval of 35–50 g/L. The derived reference intervals from the direct differ. At the lower reference limit (LRL), there is a difference of 3–6 g/L or (9–17%). At the upper reference limit (URL), the difference from Pathology Harmony is smaller at 1–2 g/L or <5%. The Roche BCG method reference interval is higher than the other methods and significantly higher than the Pathology Harmony reference interval at both lower and upper limits. BCP reference intervals (for Beckman DXI and Abbott Architect) are lower than BCG reference intervals (Siemens Advia and Roche Cobas) at both the upper and lower limits.
Indirect reference intervals study
The mean and age distribution of the reference population is given in Table 1b. Fourteen participating laboratories were grouped by analytical platform as described in Table 1. No data for BCG albumin method from Siemens Advia XP were obtained. The 2.5 and 97.5 percentiles for the age group 18–70 years old are presented in Table 5 and those for the >70 years old age group are presented in Table 6.
Indirect study – Data mining – Reference intervals for albumin methods (g/L) on various analytical platforms for >70 years old cohort.
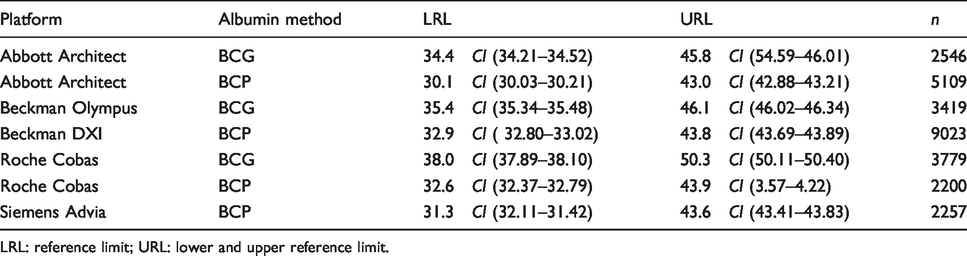
LRL: reference limit; URL: lower and upper reference limit.
Reference intervals of BCG methods, irrespective of analytical platforms or age, are higher for both the LRL and URL than those for BCP. This difference of 3–4 g/L is independent of analytical platform except Roche BCG which demonstrated an increased difference of 6–7 g/L. In comparison to the UK Pathology Harmony reference interval for albumin, the younger population reference interval varied by up to 5.7% at the LRL and up to 12% at the URL (Table 5). In the older population, variation of up to 14% was observed at both LRL and URL (Table 6). In general, the difference between age-specific reference intervals and the UK Pathology Harmony reference interval, especially at the URL, was greater than the minimal acceptable analytical variation for albumin, which estimated to total error 6.1%. 17
Reference intervals for the >70 age group are lower than those for the younger population (18–70 years old) with a LRL and URL almost lower by 1–2 g/L and those of the younger population are lower than the reference intervals from the direct study (Figure 1). Figure 1 presents all reference intervals obtained from this study, using both a direct and an indirect approach, in relation to the UK Pathology Harmony reference interval.
Discussion
The establishment of reference intervals is an important responsibility of laboratory medicine professionals. The recent promotion of the indirect approach is welcomed, as it makes the determination of reference interval task less demanding. 6 In the present study, both the direct and indirect approach has been used to establish method-specific reference intervals for albumin and calcium.
The observed calcium reference intervals for all manufacturers systems were in good agreement with both the UK Pathology Harmony-recommended reference interval and with the manufacturers own reported ranges except the Siemens Advia. Siemens reference interval for calcium was lower than the UK Pathology Harmony reference interval for the lower and upper limits.
All participating laboratories performed within the acceptable limits in internal quality assessments and in the UK National External Quality Assessment scheme for calcium and albumin. The laboratory using the Siemens Advia has never exceeded the allowable bias and consistently performed at bias <2% during the period of study. The analytical procedure in each laboratory followed the manufacturers’ recommendations, and the pre-analytical procedures were applied consistently for all samples; therefore, the difference in Siemens reference interval is likely to be due to reagent, calibration differences or the use of a non-commutable calibrator. 18 , 19 Indeed, recent data from the Spanish External Quality Assurance (EQA) scheme, in which commutable EQA samples were used, showed evidence of a calibration error in Siemens Advia XP calcium assay. 15 This error was related to the use of a non-commutable reference material (NIST SRM 915). 15 Therefore, from a harmonization point of view, Siemens users should not be using the UK Pathology Harmony reference interval until the calibration issue has been resolved. Our finding is in keeping with the Hughes et al. study in which harmonization for the calcium reference interval was recommended for all calcium methods with the exception of Siemens Dimension RxL. 20 This case indicates the need for laboratories to validate manufacturers’ reference intervals as recommended by ISO 15189. 8
The reference intervals for BCG albumin were consistently higher than that for BCP methods, irrespective of platform as previously identified. 21 In this study, the BCG methods hardly met the minimum analytical performance limits-based biological variations. 22 Roche BCG-based reference intervals for both direct and indirect studies are not only higher than BCP-based reference intervals, but also higher than all other BCG-based reference intervals tested in this study (Table 3, 5 and 6). Our finding that the Roche albumin BCG method had a positive bias of 6 g/L compared with the Abbott BCP albumin method has been recently reported by Coley-Grant et al. 12
The difference between reference intervals obtained from BCG and BCP methods could be partly attributed to the lack of a direct traceability system transfer for routine albumin methods, analytical variability between laboratories and method specificity. 23 Data from a recent a study showed that the Roche BCG has a systematic bias positive to other analytical platforms.21,24 Two independent EQA schemes reported a BCG systematic bias of only 2 g/L or less.11,22 While this bias supports the findings of a higher BCG reference interval, it does not completely explain the size of the difference observed in this study.
Albumin reference intervals derived in this study differed widely from the UK Pathology Harmony. This difference varied between 1 to 5 g at the LRL and 1 to 7 g at the URL depending on the age of the population. This disparity becomes most marked (up to 5 g/L at the LRL and up to 7 g/L at URL) between reference intervals from >70 years of age and Pathology Harmony.
There is growing evidence that albumin concentrations decline with advanced age.3,22 In our indirect study, a fall in reference intervals was seen with age (Figure 1 and Tables 5 and 6). This is consistent with the findings of Weaving et al. 3 We found that the reference intervals were higher in the direct than the indirect study, but this may be due to the subjects in the direct group being younger than the indirect (mean age 41.3 vs. 59 years). This difference in the population age mean may add another layer of variation that contributes to the disparity between reference intervals from various analytical platforms.
The most recent multicentre study of reference intervals examined the impact of population differences across Japan on reference intervals for 25 biochemical tests. This study recommended a single reference interval for calcium and albumin regardless of age or gender differences. 25 In contrast, Carlsson et al. reported that the calcium and albumin reference interval in a population of 70 year olds subjects in Sweden without CVD was higher at the upper limit for calcium and albumin than our indirect study. 26 Carlsson et al. also found that differences between genders exist, but the 90% CI for the reference value was not separated, suggesting that gender differences are not sufficiently different to merit separate reference intervals. It is worth mentioning that Carlsson et al. excluded hyperparathyroidism as a cause of occult hypercalcaemia in this age group.
The Nordic Reference Interval Project (NORIP) also employed a scientifically valid approach that ensured harmonization of methods through the use of commutable calibrator materials before the measurement of samples from healthy volunteers. The reported reference interval for calcium in serum/plasma and for albumin was significantly different from the other initiatives and lower than the calcium and albumin reference intervals obtained from our study (Table 7). One can suggest that this could be explained by population differences. Ozarda et al. have demonstrated biochemical differences between healthy populations recruited from different countries. 27 The characteristics of the reference population from our study which consisted of a mainly white Caucasian population are similar to the NORIP study population. The NORIP study circulated reference samples to participating laboratories to correct for calibration difference. 28 Unlike the NORIP study, our study design lacked the measurement of reference material across the studied analytical platforms. Therefore, differences in calcium and albumin reference intervals are more likely to be attributed to calibration and methodological differences rather than population differences.
Published calcium and albumin reference intervals.
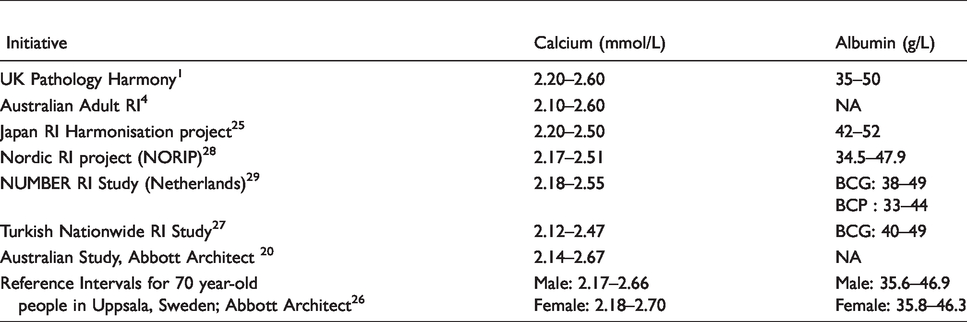
Among many harmonization initiatives, the Australian Association of Clinical Biochemistry (AACB) developed an evidence-based approach for harmonizing reference intervals for tests with a sound, standardized calibration system. The AACB proposed a harmonized calcium reference interval wider than that of the UK Pathology Harmony (Table 7). Nevertheless, AACB have not proposed one for albumin because of the wide variation between results produced by BCG and BCP methods. In the presence of a strong evidence of bias, method-specific reference intervals become a safer practice. In agreement with the AACB, our finding also supports a case for method-specific reference interval. 22 , 24
It is worth mentioning that our reference populations showed a small kurtosis (–2.3 to 3.8) and shows a non-Gaussian distribution. This observation had led to age-partitioning of the data. While this partitioning slightly improved the Anderson-Darling factor, this value remained elevated suggesting further partition is needed. Data can be partitioned by age or gender. We have not been able to further partition our data by a decade or by gender due to a small sample size number. While the literature does not strictly prescribe the required reference sample number, <1000 and >10,000 data points are respectively considered small and large populations. 6 The size of our reference population fell mostly between these ranges. Therefore, a bigger data-mining exercise is required to confirm the finding from this study and explore decade- and gender-specific albumin reference intervals and subsequently, age- or gender-specific calcium equations.
In conclusion, while calcium reference intervals that were derived by our study in general agree with other studies, the harmonization conclusion by the UK Pathology Harmony can be acceptable for three out of four analytical platforms. The albumin reference intervals obtained from our study show a large variation. This variation is probably attributed to the current traceability system, to analytical, age and probably gender variation. While reference intervals harmonization is a desirable exercise, it is premature to embrace a common reference interval for albumin without further age- and gender-partitioning studies. The present study adds to the literature body that challenges the harmonization of albumin reference interval and also the use of a calcium adjustment equation with single albumin concentration irrespective of population albumin mean.
Footnotes
Declaration of conflicting interests
The author(s) declared no potential conflicts of interest with respect to the research, authorship, and/or publication of this article.
Funding
The author(s) received no financial support for the research, authorship, and/or publication of this article.
Guarantor
NJ.
Contributorship
NJ designed the study, collected and analysed the data. AL, DN and NJ have collected samples for the prospective healthy reference interval study. All authors collected data for the indirect reference interval study. NJ and JHB drafted the paper. All authors have read and agreed the final version of the article.