
Abstract
Background
Pneumatic tube transport of pathology specimens from the emergency department to the laboratory for analysis is a widely used practice. When compared to manual specimen transport, it results in savings in both time and labour. Sampling of cerebrospinal fluid still forms part of the workup of patients with suspected subarachnoid haemorrhage. There are claims in the literature that transport of cerebrospinal fluid samples by pneumatic tube results in excess haemolysis, which interferes with cerebrospinal fluid analysis for the presence of bilirubin. The aim of our study was to ascertain whether pneumatic tube transport of blood-stained cerebrospinal fluid to the laboratory, results in clinically significantly higher levels of haemolysis compared with manual transport of the same specimens.
Methods
Stored cerebrospinal fluid was spiked with varying amounts of red blood cells creating 72 specimens of varying red cell concentration. Half of these specimens were transported to the laboratory manually while the other half were sent by pneumatic tube transport. The rates of haemolysis were compared between the pneumatic tube and manual transport samples.
Results
There was no clinically significant difference in the rates of haemolysis between the samples transported to the laboratory by pneumatic tube compared with those moved manually.
Conclusions
Pneumatic tube transport of cerebrospinal fluid to the laboratory is not associated with clinically significantly higher rates of haemolysis when compared to manual transport.
Keywords
Introduction
Assessment of cerebrospinal fluid (CSF) for bilirubin is one of the accepted investigations for suspected subarachnoid haemorrhage (SAH) when the initial computerized tomography (CT) scan is negative. 1
Bilirubin is produced by in vivo red blood cell haemolysis and contributes to the yellow or reddish brown discolouration of CSF referred to as xanthochromia. Other red blood cell breakdown products contributing to this discolouration are oxyhaemoglobin and methaemoglobin. 2 Methaemoglobin is uncommon and will not be considered further. 3 Although xanthochromia can be detected by visual inspection alone, this is considered inferior to spectrophotometry. 4 Visual inspection is also unable to determine the relative contributions of bilirubin and oxyhaemoglobin.
Red blood cells in CSF undergo lysis releasing oxyhaemoglobin within 2 to 12 h.2,5 In vivo, oxyhaemoglobin is usually converted into bilirubin by the action of macrophages and other leptomeningeal cells. This process takes at least 6 h and up to 15 h to form post bleed.2,5–9 Hence, current advice is to wait at least 6 h and preferably 12 h after the onset of headache before performing lumbar puncture to investigate suspected SAH. 8 Mechanical haemolysis of red blood cells in collected CSF specimens may also release oxyhaemoglobin but bilirubin is not produced due to the absence of in vivo enzyme systems.
Oxyhaemoglobin and bilirubin have overlapping absorbance spectra with different spectral absorbance peaks (415 vs. 450 nm, respectively). 2 These overlapping absorbance spectra can make differentiation of the two compounds problematic as oxyhaemoglobin produced by the haemolysis of red blood cells introduced into CSF at time of lumbar puncture (i.e. traumatic tap) may interfere with the detection of bilirubin. Pneumatic transport tubes are often used to transport pathology specimens and are known to cause haemolysis of red blood cells under certain circumstances.8,10,11
The most detailed reference for the detection of bilirubin by spectrophotometry, the UK National Guidelines, has been developed by the working group of the UK National External Quality Assessment Scheme for Immunochemistry and was initially published in 2003 6 and revised in 2008. 3 The laboratory at our study institution uses this reference as the basis for their method of bilirubin detection by spectrophotometry. The UK National Guidelines advise against the use of pneumatic tube systems to transport specimens from the emergency department to the laboratory due to concerns that pneumatic tube systems induce haemolysis resulting in elevated oxyhaemoglobin, which interferes with or confounds the interpretation of bilirubin. 3 This is based on a study by Wenham et al. who reported significantly higher absorbance value at 415 nm (wavelength for oxyhaemoglobin) for blood-stained CSF samples transported by pneumatic tube and concluded that pneumatic tube transport caused in vitro haemolysis. 12
The aim of this study was to compare pneumatic tube transport of blood-spiked CSF with manual transport and its effect on the rates of haemolysis in the two specimen groups.
Methods
This study’s design was based on the Wenham study with addition of an arm involving transport by hand to enable comparison of the effect of pneumatic tube transport against transport by hand and the use of targeted red blood cell counts from nil to 10,000 × 106/L in 2000 × 106/L increments.
Approval for this study was granted by Northern Sydney Health Human Research Ethics Committee.
CSF source and selection
The Clinical Biochemistry and Microbiology Departments within the pathology laboratory store CSF remaining after clinical investigations for at least seven days prior to disposal in accordance with National Association of Testing Authorities guidelines. 13 The laboratory provided this stored CSF for use in our study.
Any CSF with an oxyhaemoglobin peak, bilirubin peak, high protein (>1 g/L) or associated with a high serum bilirubin (>20 μmol/L) was discarded. Due to the prolonged collection time, CSF supernatant was frozen at −20℃ until sufficient quantity was obtained to perform the study.
A pool of 18.6 mL of CSF was obtained and confirmed by spectrophotometry to be absorbance peak free. This CSF was split into six 3.1 mL sub-specimens, each of which was further assessed by spectrophotometry to confirm the absence of an absorbance peak (Figure 1).
Selection and pooling of CSF specimens.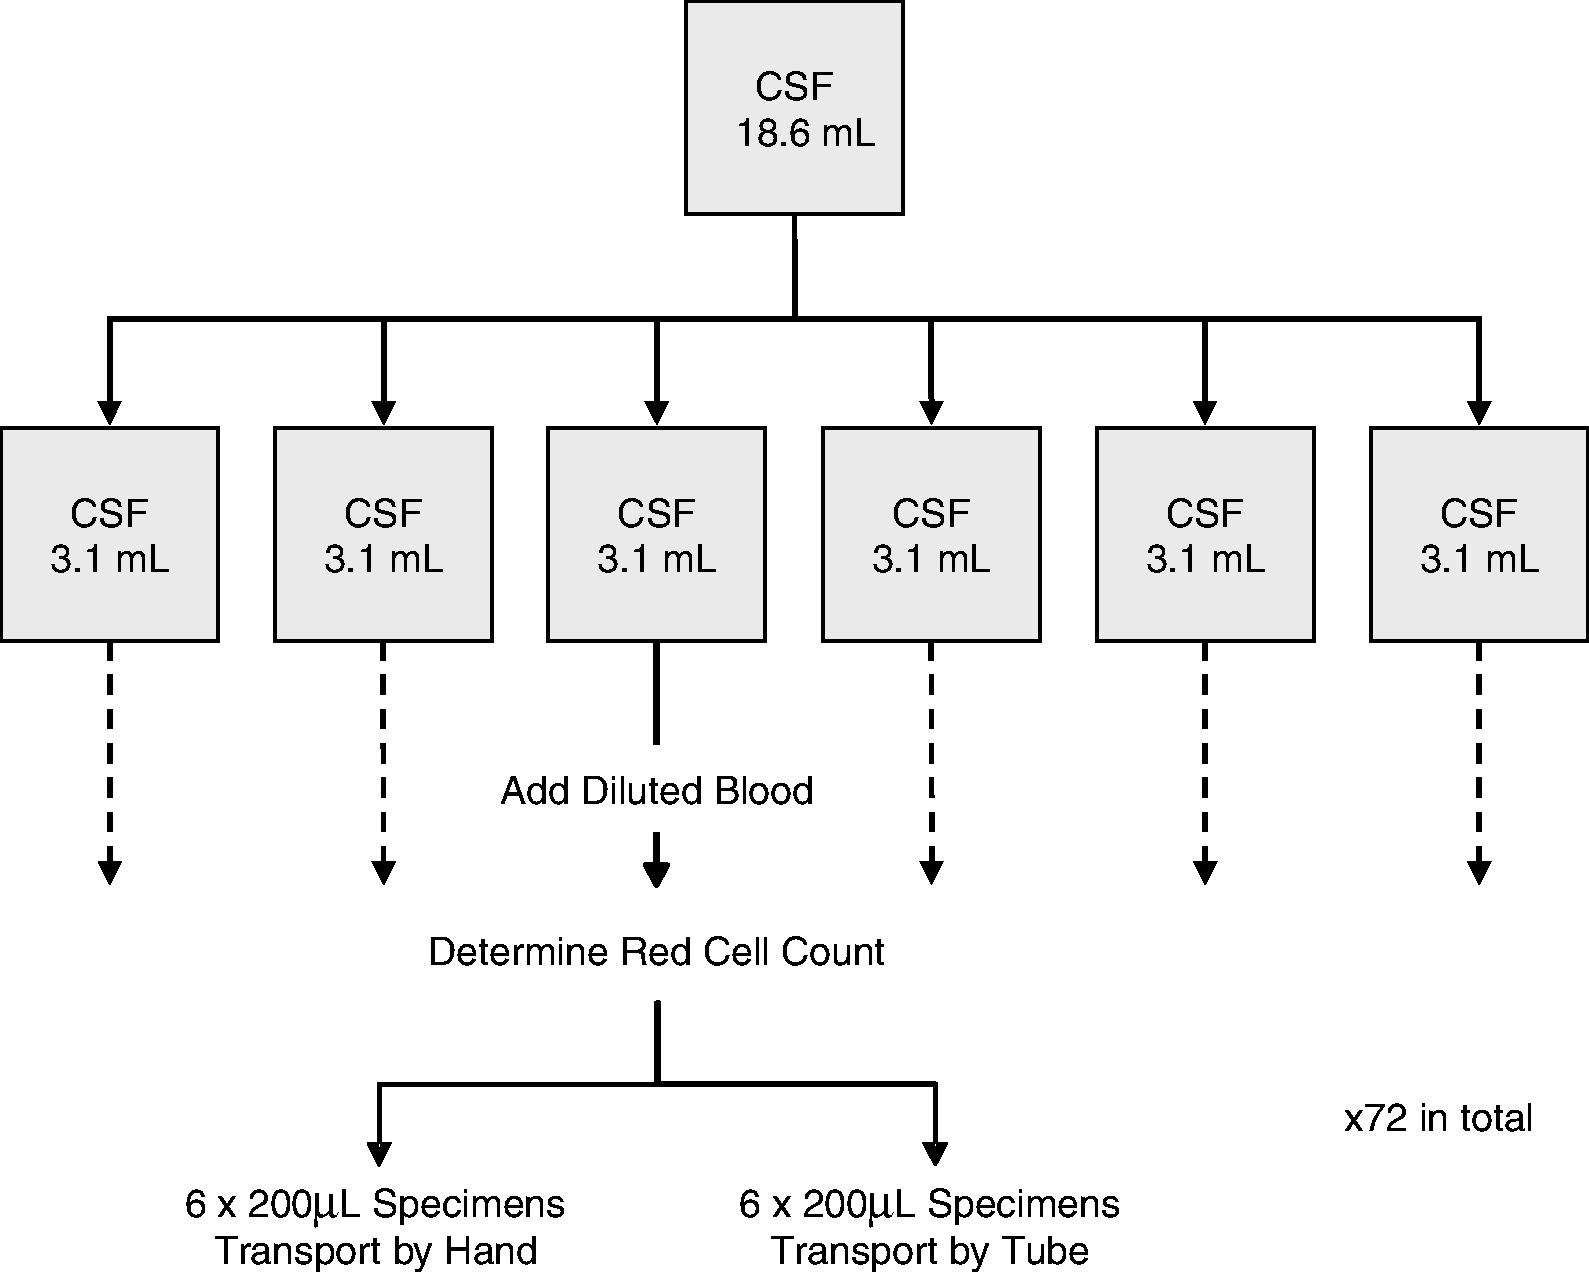
RCC targets, actual cell counts and mean NOA.
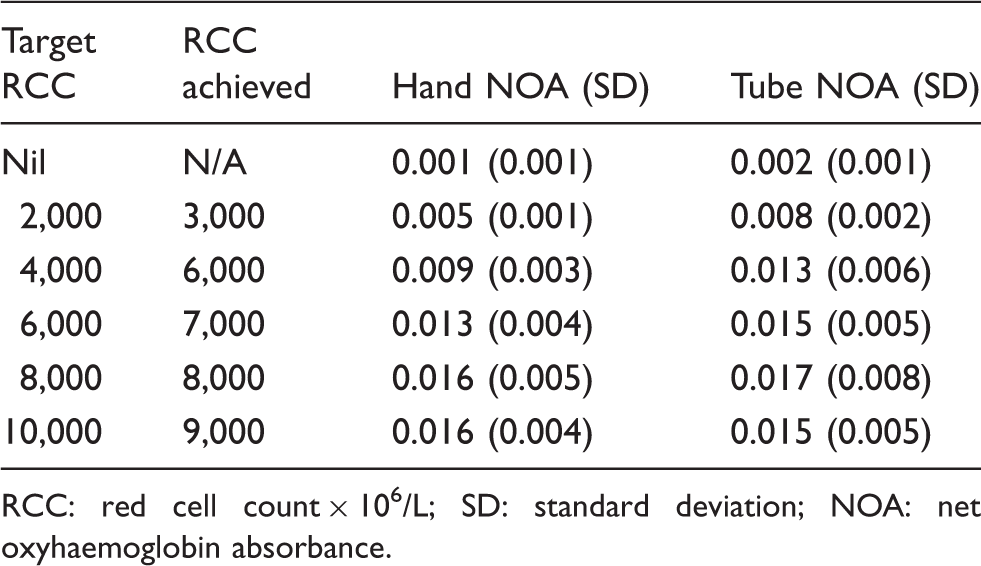
RCC: red cell count × 106/L; SD: standard deviation; NOA: net oxyhaemoglobin absorbance.
Specimen handling
From each of the six pools of blood-spiked CSF, 12 specimens of 200 μL were drawn resulting in a total of 72 200 μL specimens. All specimens were transported by hand to the Emergency Department; from each group of 12, six specimens were transported by pneumatic tube while the corresponding six red cell count group specimens were transported by hand up several flights of stairs to clinical biochemistry (Figure 1). The specimens sent via the pneumatic tube transport system were transported in the usual carrier modules in the same manner as other pathology specimens.
In accordance with Clinical Biochemistry’s normal practice, all specimens were centrifuged at 10,800 r/min for 1 min; the supernatant was separated and then assessed for oxyhaemoglobin and bilirubin with spectrophotometry. All samples were separated within an hour of transport to the laboratory and all spectrophotometry was completed within 6 h of separation with samples stored at 4℃ whilst awaiting spectrophotometry. Samples were analysed in their red cell count groups that included both hand- and tube-delivered samples to minimize time difference to spectrophotometry within a specific red cell count group. The sample groups were analysed in reverse order from highest to lowest red cell count group; thus, the nil red cell count group was the last analysed and subjected to the greatest delay.
Pneumatic tube transport
An Aircom SumetzbergerTm pneumatic airtube system was used to transport specimens between the Emergency Department and Clinical Biochemistry. In this system, carrier modules were moved via both positive and negative pressure.
Spectrophotometry
Spectrophotometry was performed using a Cary 3ETm UV-Visible Spectrophotometer. The principle investigator performed the spectrophotometry and also calculated absorbance at 415 nm and the net oxyhaemoglobin absorbance (NOA) after training by clinical biochemistry staff. As a quality control measure, a random selection of scans and calculations was assessed by the Biochemistry Department laboratory manager, who is experienced in performing and interpreting spectrophotometry. This exercise verified investigator reliability.
Statistical analysis
Data were entered into Microsoft Excel Spreadsheet prior to importation into SPSS v6.1 for Windows. The NOA of each pair of six samples was compared statistically using a randomization test.
Results
Six sets of 12 samples were transported and subsequently assessed by spectrophotometry. After dilution, the resulting red cell counts ranged from nil to 9000 × 106/L (Table 1). The NOA for the initial 18.6 mL CSF pool was 0.002 AU with a range of 0.002 to 0.003 AU for the six 3.1 mL groups prior to the addition of red cells. All samples containing red cells showed a peak at 415 nm, oxyhaemoglobin’s peak absorbance, regardless of mode of transport. The range of NOA showed marked variability once a red cell count of 6000 × 106/L was reached (Table 1).
Mean NOA was determined for each cell group. The mean NOA increased as the red cell count increased except for the highest red cell count group (9000 × 106/L). This group was also the only group to show a lower mean NOA for transport by tube compared to transport by hand (Table 1). Only the 3000 × 106/L red cell count group showed a statistically significant difference between mean NOA after transport by tube and transport by hand (P = 0.036) although the absolute difference was less than 0.003 AU(Figure 2).
Box and whisker plot of all samples demonstrating range of results and net oxyhaemoglobin absorbance by red cell count and mode of transport.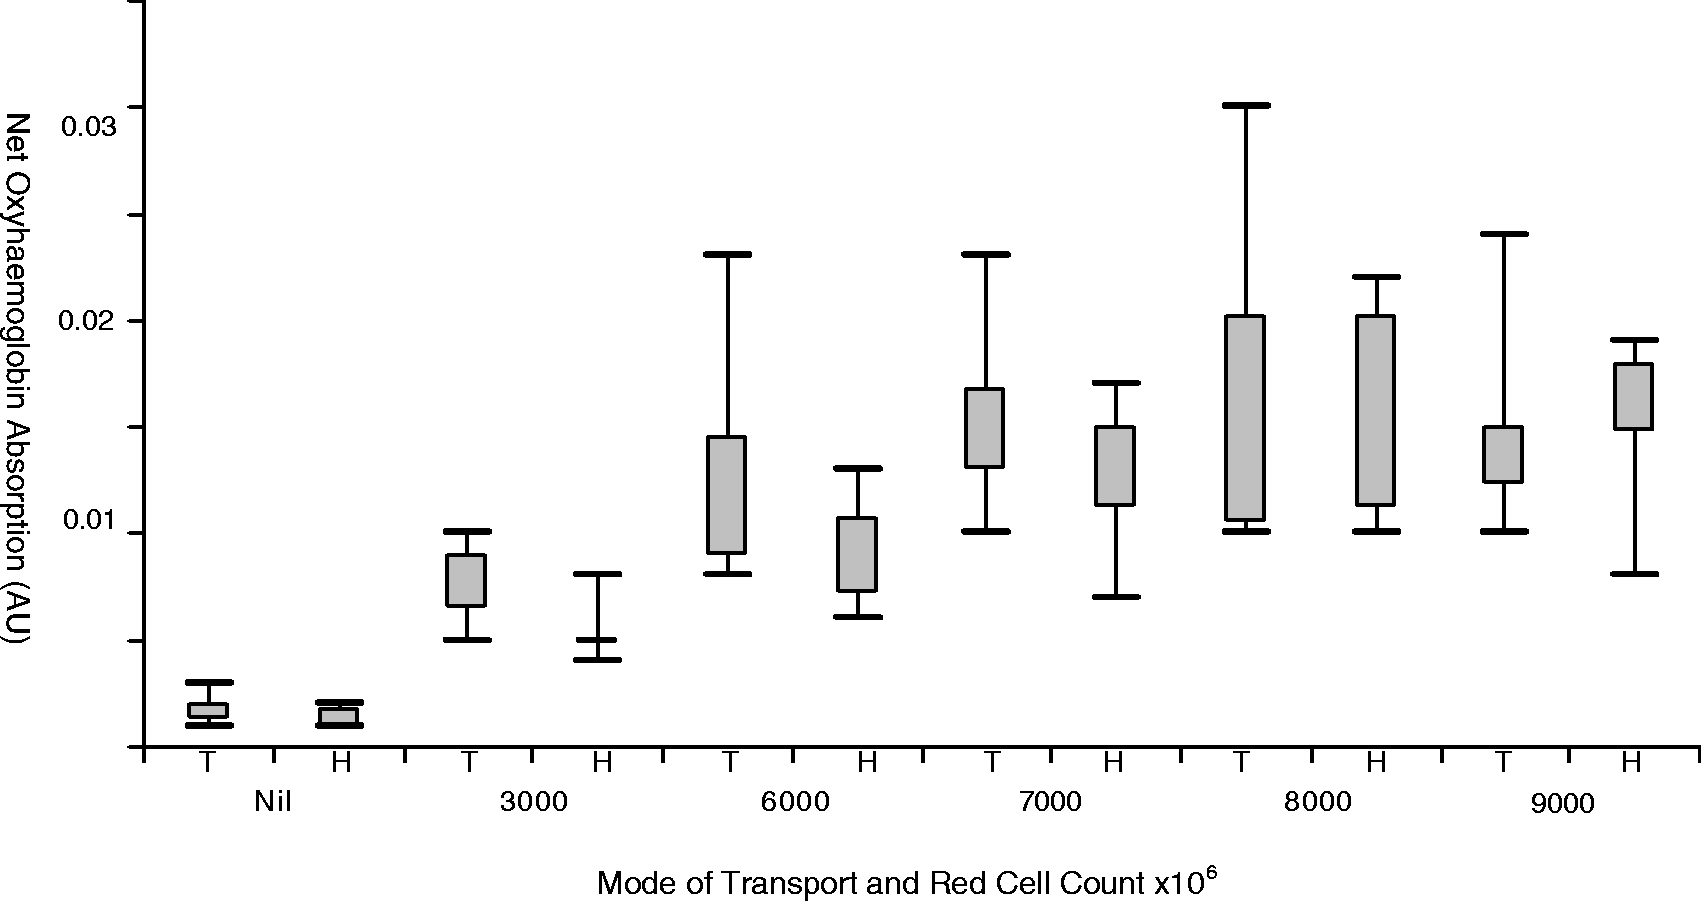
Discussion
Our study demonstrates that blood-spiked CSF specimens transported by either hand or pneumatic tube have an increase in net oxyhaemoglobin absorbance (NOA) indicating an increase in haemolysis. NOA increased with increasing red cell count except for the highest red cell group (9000 × 106/L) whose means for both hand and pneumatic tube transport were less than the means of the lower red cell count group preceding it; this highest red cell group was also the only group where transport by hand produced a higher, but not statistically significant, mean NOA than pneumatic tube transport. The only statistically significant difference in the means for mode of transport was the 2000 red cell count group. In absolute numbers, this difference was less than 0.003 AU which is not clinically significant.
The finding of increased haemolysis in specimens transported by either pneumatic tube or by hand supports Wenham’s conclusion of increased haemolysis with pneumatic tube transport. A major difference between the studies is the comparison of the effects of pneumatic tube against transport by hand. Our study included a hand transport component while Wenham’s study compared pneumatic tube transport to no transport as one group of specimens remained in the laboratory. Wenham’s finding is the reference for the advice against the use of pneumatic tubes to transport CSF specimens made in both the original 2003 2 and revised 2008 9 UK National Guidelines.
Once this statistically significant increase in haemolysis has been identified the next issue is whether it has clinical significance. To have clinical significance, the increase in net oxyhaemoglobin absorbance needs to be sufficient to potentially interfere with detection of bilirubin. The 2008 UK National Guidelines consider this to only occur when NOA is greater than 0.1 AU and recommends this finding be reported as ‘oxyhaemoglobin is present in sufficient concentration to impair the ability to detect bilirubin. SAH not excluded’. When NOA is greater than 0.02 AU but less than 0.1 AU, the recommended report is ‘small amount of oxyhaemoglobin detected. No evidence to support SAH’. The term ‘no evidence to support SAH’ is the same phrase used when NOA is less than 0.02 AU (and no significant bilirubin detection). 9
Among the current study’s findings, seven results were greater than 0.02 AU: two occurring with transport by hand in the 8000 red cell group, and the remaining five in pneumatic tube transport groups, one each in 3000, 7000 and 9000 red cell count groups and two in the 8000 red cell groups. The highest NOA was 0.030 in a sample transported by pneumatic tube in the 8000 red cell group. None of the elevated NOAs are close to reaching the 0.10 AU level for potential interference with detection of bilirubin and thus potential to interfere with detection of SAH.
A possible interpretation of the current study’s findings is that transport by both hand and pneumatic tube results in haemolysis of red cells but tube transport has a greater effect on smaller numbers of red cells, while the effect of transport by hand increases more slowly with a greater effect on higher concentrations of red cells. This interpretation could be explored with a further study with a greater number of specimens in each red blood cell count group.
An alternative interpretation is that the mixing of red cells into CSF causes haemolysis, which increases as the red cell concentration increases and that transport has minimal effect. To explore this interpretation an additional CSF group with the same red cell dilutions but which was not transported would need to be included. While not undertaken in this study, Wenham et al. 10 essentially compared no transport to pneumatic tube transport and failed to demonstrate a consistent increase in NOA with increasing red cell count in the samples which were not transported. This finding suggests that addition of red cells is not the only factor in affecting levels of oxyhaemoglobin.
Regardless of interpretation of the exact origin of the observed increased oxyhaemoglobin, transport of CSF specimens by either hand or pneumatic tube does increase haemolysis.
Investigation of rates of haemolysis in blood samples has also suggested that pneumatic tube specific factors including length, rate of acceleration, rate of deceleration and sudden changes in pressure and direction are important. Differences between the pneumatic tube system employed by Wenham and our laboratory could have made a significant contribution to the different outcome.
Limitations
It is a potential limitation that no specimens above the 9000 RBC concentration were tested. There may or may not have been higher levels of haemolysis in the vacuum tube-transported specimens at these very high RBC concentrations that this study did not pick up. However, capping at the maximum concentration chosen was based on evidence that extremely high CSF RBC concentrations (>10,000 × 106/L) have a much increased likelihood ratio (LR) of SAH12 and require consideration for further investigation above and beyond a standard CT/LP approach.
Conclusions
This study demonstrates that for red cell counts up to 9000 × 106/L, both hand and pneumatic tube transport does result in increased haemolysis; however, this increase is not clinically relevant. Thus, the pneumatic tube can be considered for transport of such specimens to the laboratory.
Footnotes
Acknowledgements
We would specially like to thank Lynne Connelly (Senior Hospital Scientist – Haematology RNSH) who provided considerable help in conducting the red cell count analysis. Further, we would like to acknowledge Jillian Pattinson, (Kolling Institute) statistician, for her help in analysing the data.
Declaration of conflicting interests
None.
Funding
There was no external funding for this project. The minimal expenses for the project were absorbed internally within the Emergency Dept and PaLMS operating budgets.
Ethical approval
This project was approved by the Northern Sydney Central Coast Area Health Service Human Research Ethics Committee (Approval # HREC/08/HARBR/39).
Guarantor
MG.
Contributorship
LJ: Study conception and design; acquisition of data; analysis and interpretation of data; drafting and revising the article and final approval of the version to be published.
GI: Study design, analysis and interpretation of data and final approval of version to be published
DC: Study design; acquisition and interpretation of data and final approval of the version to be published
MG: Study design; analysis and interpretation of data; drafting and revising the article and final approval of the version to be published.