
Abstract
Background
It is unclear which renal function equation, employing an isotope dilution mass spectrometry (IDMS)-aligned creatinine assay, best predicts gentamicin clearance.
Methods
The performances of the Cockcroft-Gault, Modification of Diet in Renal Disease (MDRD) Study and Chronic Kidney Disease Epidemiology Collaboration (CKD-EPI) equations for predicting gentamicin clearances were assessed retrospectively in 240 patients treated with gentamicin during 2011–2012, when the local creatinine assay was IDMS-aligned. Comparisons were based on the percentage within 30% of gentamicin clearance (P30) and the root-mean-square error (RMSE) of each equation. Gentamicin clearance was calculated from plasma concentrations using a one-compartment model.
Results
The Cockcroft-Gault equation and the CKD-EPI equation corrected for individual body surface area (BSA) were associated with the highest P30 (69% and 67%, respectively) and lowest RMSE (39 and 36 mL/min, respectively) in the 240 patients. Correction for individual BSA improved the performances of the MDRD Study and CKD-EPI equations in patients with body mass indices <18.5 or ≥30 kg/m2. The equations systematically underestimated gentamicin clearance as gentamicin clearance increased, with performance being inferior with gentamicin clearance ≥90 versus <90 mL/min.
Conclusions
The CKD-EPI equation corrected for individual BSA, and the Cockcroft-Gault equation, provided the best estimates of gentamicin clearance. The CKD-EPI and MDRD Study equations should be corrected for individual BSA at the extremes of body size, if used for guiding gentamicin therapy. The performances of the equations were inferior in patients with higher values of gentamicin clearance.
Introduction
Quantifying renal function, typically by estimating creatinine clearance or glomerular filtration rate (GFR), is an important foundation upon which to base dose individualization of renally cleared drugs.1–3 The Cockcroft-Gault equation 4 has been used for several decades in clinical practice for estimating renal function, and is still part of the Food and Drug Administration guidance on the study and application of drug pharmacokinetics. 5 Recently, other equations for estimating GFR have been developed, such as the Modification of Diet in Renal Disease (MDRD) Study and Chronic Kidney Disease Epidemiology Collaboration (CKD-EPI) equations.6,7 These are widely reported by laboratories along with plasma creatinine concentrations. The strengths and weaknesses of these equations in predicting GFR are well documented, 8 and their comparative performance for drug dosing debated.9,10 While using any of them to guide dosing has advantages over using creatinine concentrations without estimating GFR, it would be useful to know if there were clear advantages of any one in particular settings.
Gentamicin is a renally cleared aminoglycoside drug with a low therapeutic index. Its efficacy and toxicity are related to its concentration–time profile. 11 The ratio of the peak concentration to the minimum inhibitory concentration of gentamicin should be maximized to optimize efficacy. 12 This is tempered by the need to avoid excessively large areas under the concentration–time curve (AUC) to minimize the risk of toxicity. 11 For a given individual, the AUC is determined by the administered dose and the individual’s gentamicin clearance. The prediction of individualized gentamicin clearance using gentamicin plasma concentrations following the first dose is well established in clinical practice.13,14 However, gentamicin is sometimes used as a single dose. This has been less well studied and is entirely dependent on the estimation of the patient’s likely gentamicin pharmacokinetics prior to feedback from concentrations. The standard Cockcroft-Gault, MDRD Study and CKD-EPI equations have been compared in the literature for estimating aminoglycoside clearance.15–18 Further, some variants of these equations have also been considered. These include using weight descriptors other than total body weight for the Cockcroft-Gault equation and correction for individual body surface area (BSA) for the MDRD Study and CKD-EPI equations. 18 However, we believe that four aspects of these equations warrant further investigation in the setting of predicting an individual’s aminoglycoside clearance. First, given that the serum creatinine concentration is a core feature of all these equations, it is important to use the equations according to whether or not the creatinine assay employed is calibrated using an isotope dilution mass spectrometry (IDMS)-aligned calibrator. For example, the CKD-EPI equation was developed using data from IDMS-aligned creatinine assays, and is thus not directly applicable to serum creatinine concentration values from assays that are not IDMS-aligned. Further, as the original creatinine assays used to support the Cockcroft-Gault equation are no longer widely used, an assessment of its validity with IDMS-aligned assays is necessary. Second, the performance of the equations in patients at different levels of gentamicin clearance (i.e. high or low) in the setting of an IDMS-aligned creatinine assay has not been examined. Third, while it is intuitive that correcting the results from the MDRD Study and CKD-EPI equations for individual BSAs should improve the prediction of renal drug clearance in individuals, this has not been demonstrated in previous research. 18 Finally, while setting the serum creatinine concentration at a minimum of 60 µmol/L has been shown to improve the performance of the Cockcroft-Gault equation, 19 this has not been systematically examined either in the context of various weight descriptors being used in the Cockcroft-Gault equation or in the MDRD Study equation.
We sought to address these aspects by systematically examining the performances of the Cockcroft-Gault, MDRD Study and CKD-EPI equations, and their variants, in predicting gentamicin clearance with an IDMS-aligned creatinine assay.
Methods
Extended interval dosing protocol for gentamicin.
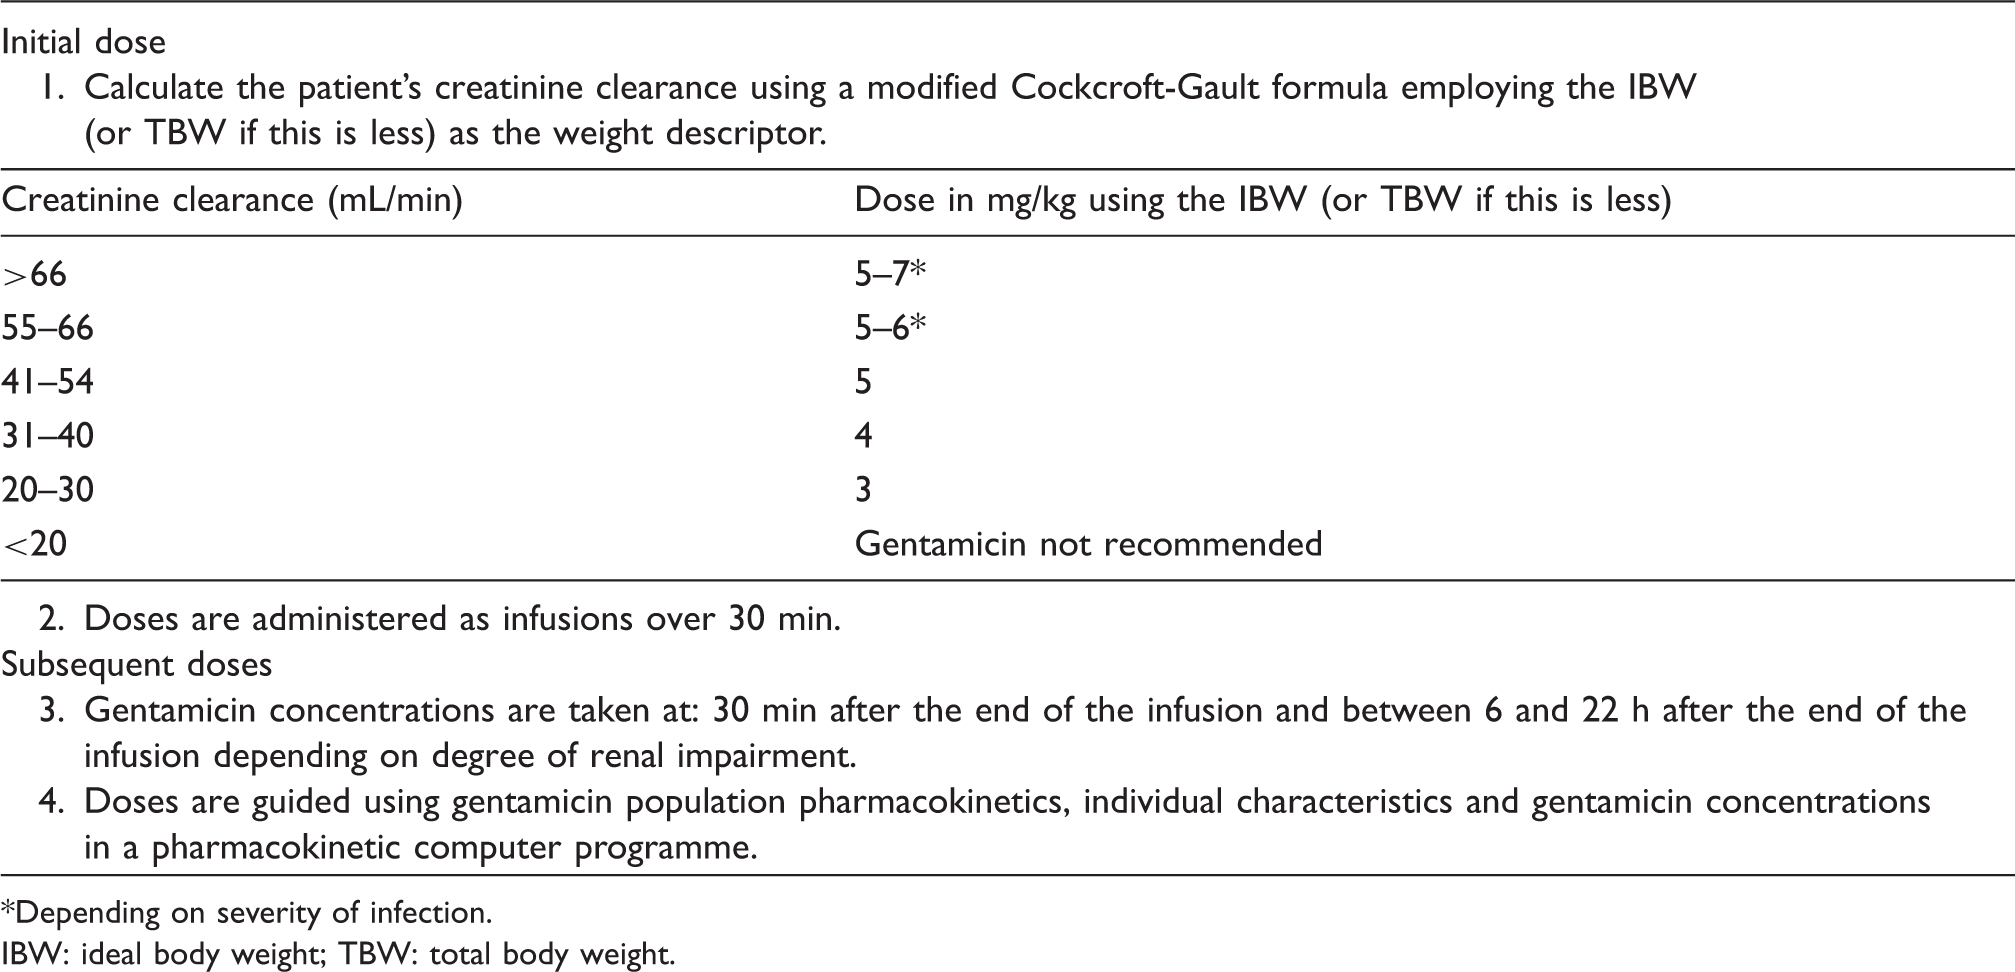
*Depending on severity of infection.
IBW: ideal body weight; TBW: total body weight.
Calculation of gentamicin clearance and volume of distribution using a one-compartment model.
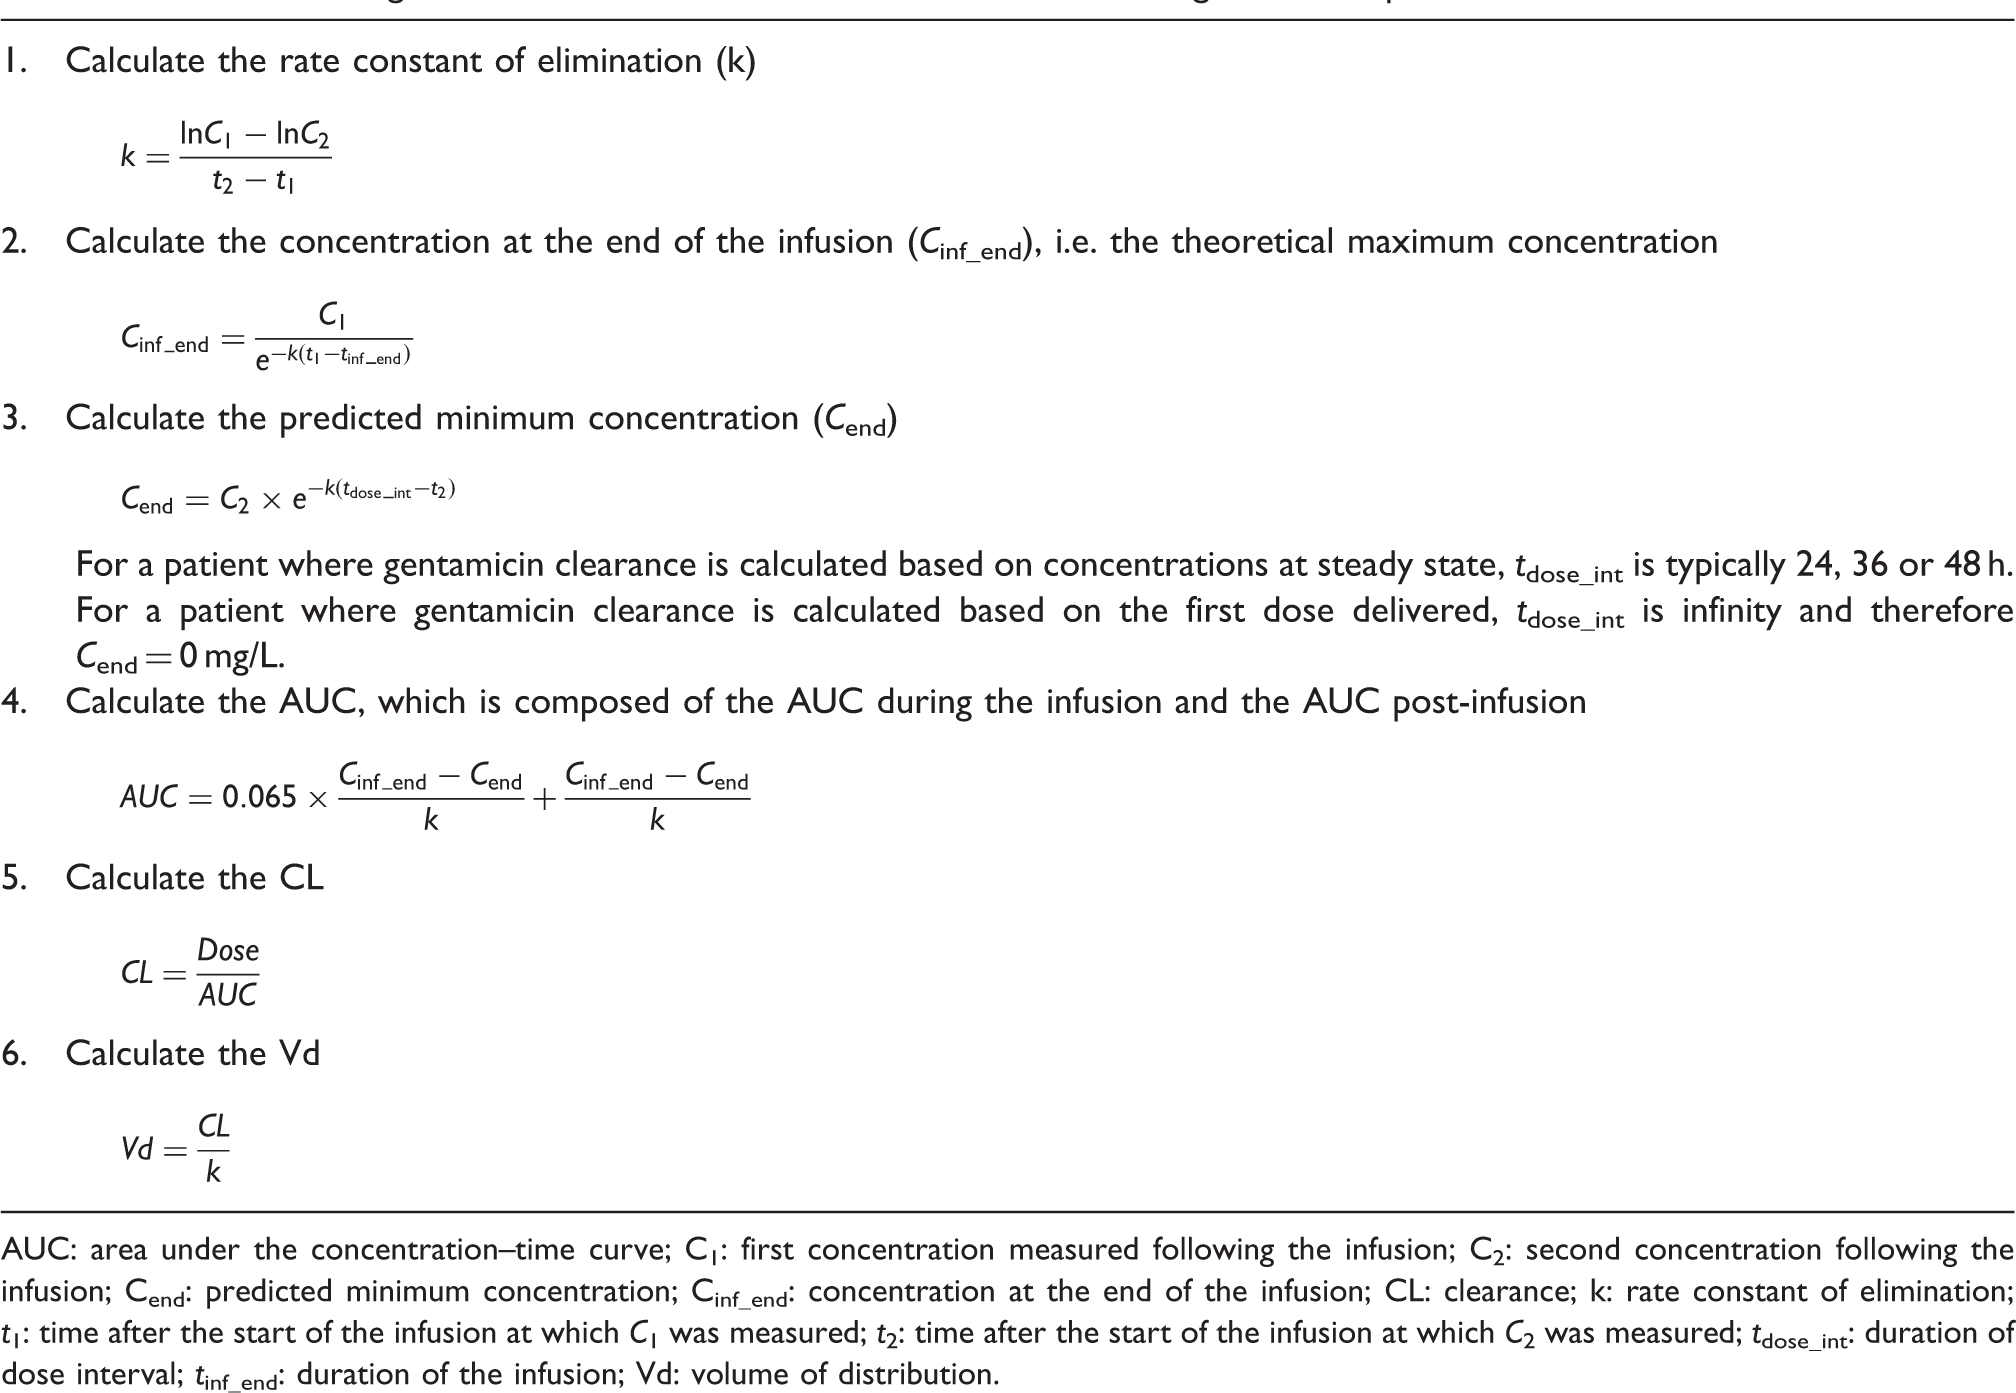
AUC: area under the concentration–time curve; C1: first concentration measured following the infusion; C2: second concentration following the infusion; Cend: predicted minimum concentration; Cinf_end: concentration at the end of the infusion; CL: clearance; k: rate constant of elimination; t1: time after the start of the infusion at which C1 was measured; t2: time after the start of the infusion at which C2 was measured; tdose_int: duration of dose interval; tinf_end: duration of the infusion; Vd: volume of distribution.
Patients were included in this study if they were ≥18 years old and had stable renal function (<25% change in serum creatinine concentrations from baseline around the time of gentamicin therapy 21 ). Exclusion criteria consisted of pregnancy, cystic fibrosis and gentamicin concentrations <0.3 mg/L (the limit of quantification for the local gentamicin assay).
Creatinine and gentamicin assays
Serum creatinine was measured using an Abbott® Architect analyser by the modified Jaffe reaction, which was IDMS-aligned during the period of this study. The assay performed consistently within the allowable limits (coefficient of variation of ±8%) set by the Royal College of Pathologists of Australasia, with a coefficient of variation of <4%. Serum gentamicin was measured using an Abbott® Architect c8000 analyser by the particle-enhanced turbidimetric inhibition immunoassay method, with a coefficient of variation of <5%. The accuracy of this assay has been validated locally by a recovery study on spiked samples (see Supplementary Figure 1).
Equations for estimating gentamicin clearance

Renal function equations.
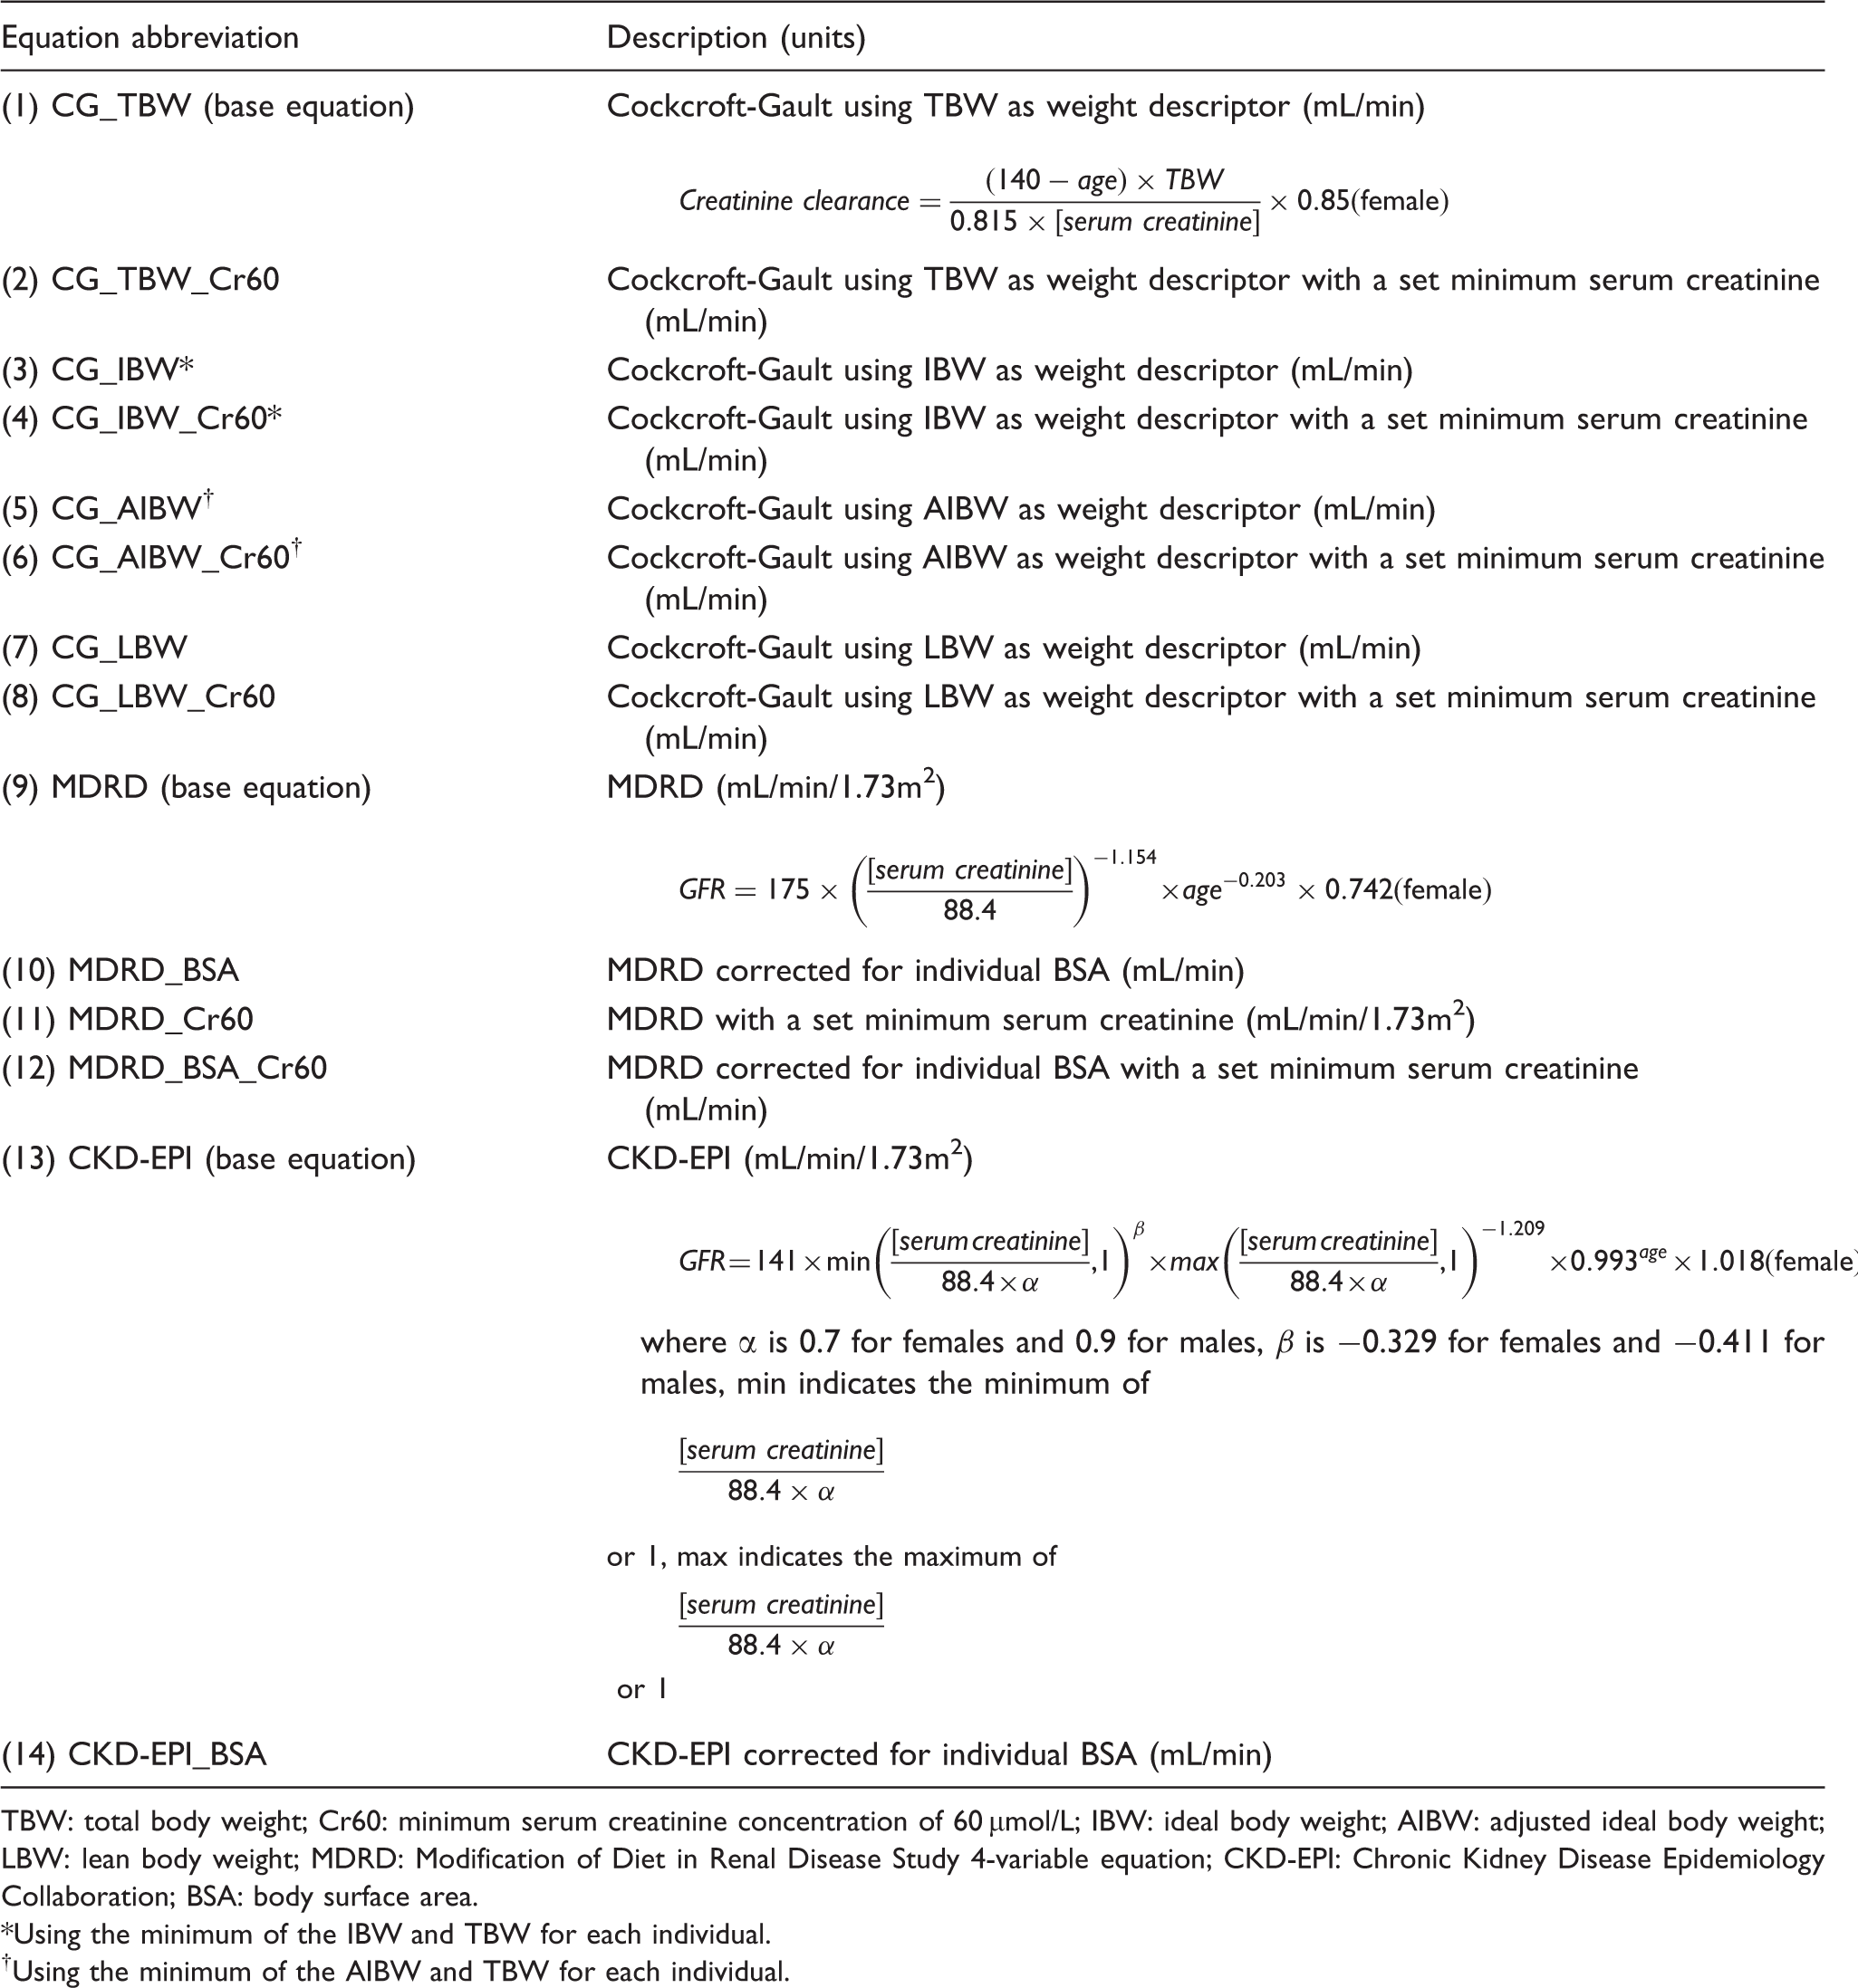
TBW: total body weight; Cr60: minimum serum creatinine concentration of 60 µmol/L; IBW: ideal body weight; AIBW: adjusted ideal body weight; LBW: lean body weight; MDRD: Modification of Diet in Renal Disease Study 4-variable equation; CKD-EPI: Chronic Kidney Disease Epidemiology Collaboration; BSA: body surface area.
Using the minimum of the IBW and TBW for each individual.
Using the minimum of the AIBW and TBW for each individual.
In the setting of obesity, use of the IBW in the Cockcroft-Gault equation underestimates the creatinine clearance, as it does not account for the increased muscle mass in these individuals.
23
Using a ‘midway’ point in weight between the ideal and total body weight (TBW), in the form of the adjusted IBW (AIBW), has thus been advocated
24

Of the weight descriptors, the lean body weight (LBW) provides the closest approximation of fat free mass, which is the size descriptor most directly relevant to creatinine production
25

The MDRD Study equation was used with and without a minimum serum creatinine concentration of 60 µmol/L. This was not applied to the CKD-EPI equation because it already handles low creatinine concentrations through the use of different coefficients.
Statistical analysis
Statistical analyses were performed using MedCalc 12.3.0 and SPSS 19.0.0.2. The bias and imprecision of the renal function equations were assessed with respect to the reference gentamicin clearance. Bias, defined as systematic deviation of the equation-estimated gentamicin clearance from the reference gentamicin clearance, was expressed as mean bias ±95% confidence interval (CI) of the difference plots. 28 The reference gentamicin clearance, rather than the mean of this and equation-estimated gentamicin clearance, was used on the horizontal axes of the difference plots. The 95% limits of agreement were determined by the mean bias ±1.96 times the standard deviation of the differences, giving the intervals containing the differences of 95% of individuals. The relationship between the differences and gentamicin clearance was assessed using simple linear regression of the plots, from which the slopes ±95% CI were recorded. The root-mean-square error (RMSE), which comprises an aggregate of bias and imprecision, was determined to provide an overall comparative assessment of performance. The percentage of equation-estimated gentamicin clearance within 30% of the reference gentamicin clearance (P30) was determined for each equation. The statistical significance of the differences between the P30 of the equations was assessed using Cochran’s Q test or McNemar’s test, as appropriate. Where Cochran’s Q test was used, and found to be statistically significant, post hoc McNemar’s tests were performed for pairwise comparisons, with the Bonferroni correction applied to the P values (adjusted P values). P value of <0.05 was considered statistically significant.
The equations were compared in the entire cohort of eligible individuals and the following subgroups: those with reference gentamicin clearance <90 mL/min; those with reference gentamicin clearance ≥90 mL/min; those with body mass index (BMI) <18.5 or ≥30 kg/m2 (both groups combined); those with BMI 18.5–30 kg/m2 and those with a serum creatinine concentration <60 µmol/L. Stratification at 90 mL/min was chosen as gentamicin clearance is thought to closely resemble GFR, 29 and published chronic kidney disease classifications use this breakpoint to delineate normal and abnormal GFR. 30 Further, most published guidelines on dose adjustment to accommodate renal function relate to decision points below 90 mL/min. 27 The process of comparing equations occurred in three stages. First, the three base equations were compared (Table 3, CG_TBW, MDRD and CKD-EPI). Secondly, each base equation was compared with its variants. Finally, Chi-square tests were used to compare the performance of equations between relevant subgroups. Specifically, Chi-square tests were used to compare the P30 of the base equations in the two subgroups stratified by gentamicin clearance e.g. the P30 values of the CG_TBW equation in the gentamicin clearance <90 mL/min versus ≥90 mL/min. Further, where a variant equation demonstrated a superior P30 to its base equation in the BMI <18.5 or ≥30 kg/m2 subgroup, a Chi-square test was used to compare this difference in P30 with that in the BMI 18.5–30 kg/m2 subgroup.
Ethical approval for this study was obtained from the Upper South B Regional Ethics Committee, New Zealand (URB/12/02/010).
Results
Demographic characteristics.
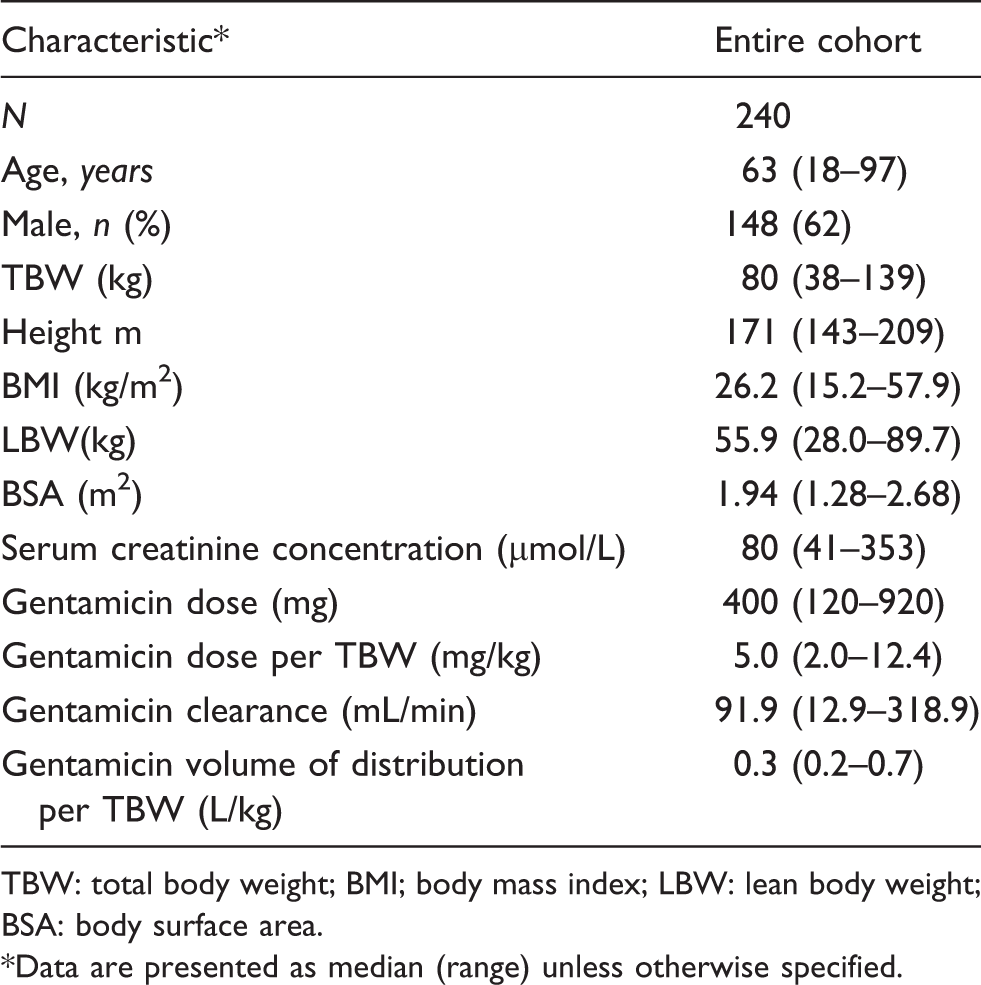
TBW: total body weight; BMI; body mass index; LBW: lean body weight; BSA: body surface area.
Data are presented as median (range) unless otherwise specified.
The performances of the 14 equations for the entire cohort are detailed in Table 5 and Supplementary Table 2. Of the three base equations, the Cockcroft-Gault equation was associated with the highest P30 (69%, adjusted P < 0.001 and P = 0.001 compared with the MDRD and CKD-EPI equations, respectively) and the lowest RMSE (39 mL/min). The CKD-EPI equation had a higher P30 (adjusted P = 0.043) and a lower RMSE than the MDRD equation. The Cockcroft-Gault equations employing either total body weight or AIBW had the highest P30 (adjusted P ≤ 0.014) and lowest RMSE ( ∼ 38 mL/min) compared with those employing either IBW or LBW. The MDRD equations that incorporated individual BSAs had higher P30 (adjusted P < 0.001) and lower RMSE (∼40 mL/min) compared with those not incorporating individual BSAs. Correction for individual BSA also improved the performance of the CKD-EPI equation, with the CKD-EPI_BSA having a higher P30 (67%, P = 0.001) and smaller RMSE (36 mL/min) than the base equation. However, setting a minimum creatinine of 60 µmol/L did not improve the performance of the Cockcroft-Gault (adjusted P > 0.99) or MDRD equations (adjusted P > 0.99). A significant systematic relationship between bias and gentamicin clearance was present for all equations, as demonstrated by the simple linear regression slopes of the difference plots that ranged from −0.37 to −0.71. In most cases the bias was positive at low values and negative at high values of gentamicin clearance. This is demonstrated graphically by the difference plots (Figure 1 for the three base equations; for variant equations see Supplementary Figure 2).
Difference plots of base renal function equations for entire cohort: (a) Cockcroft-Gault equation (b) MDRD equation and (c) CKD-EPI equation. Bias and imprecision of renal function equations for estimating gentamicin clearance. P30: percentage within 30% of reference gentamicin clearance; RMSE, root-mean-square error; MDRD: Modification of Diet in Renal Disease Study 4-variable equation; CKD-EPI: Chronic Kidney Disease Epidemiology Collaboration . See Table 3 for details of equations. The values calculated by the MDRD and CKD-EPI equations have units of mL/min/1.73 m2; these values are used directly (i.e. as if units were mL/min) in calculation of bias and imprecision parameters.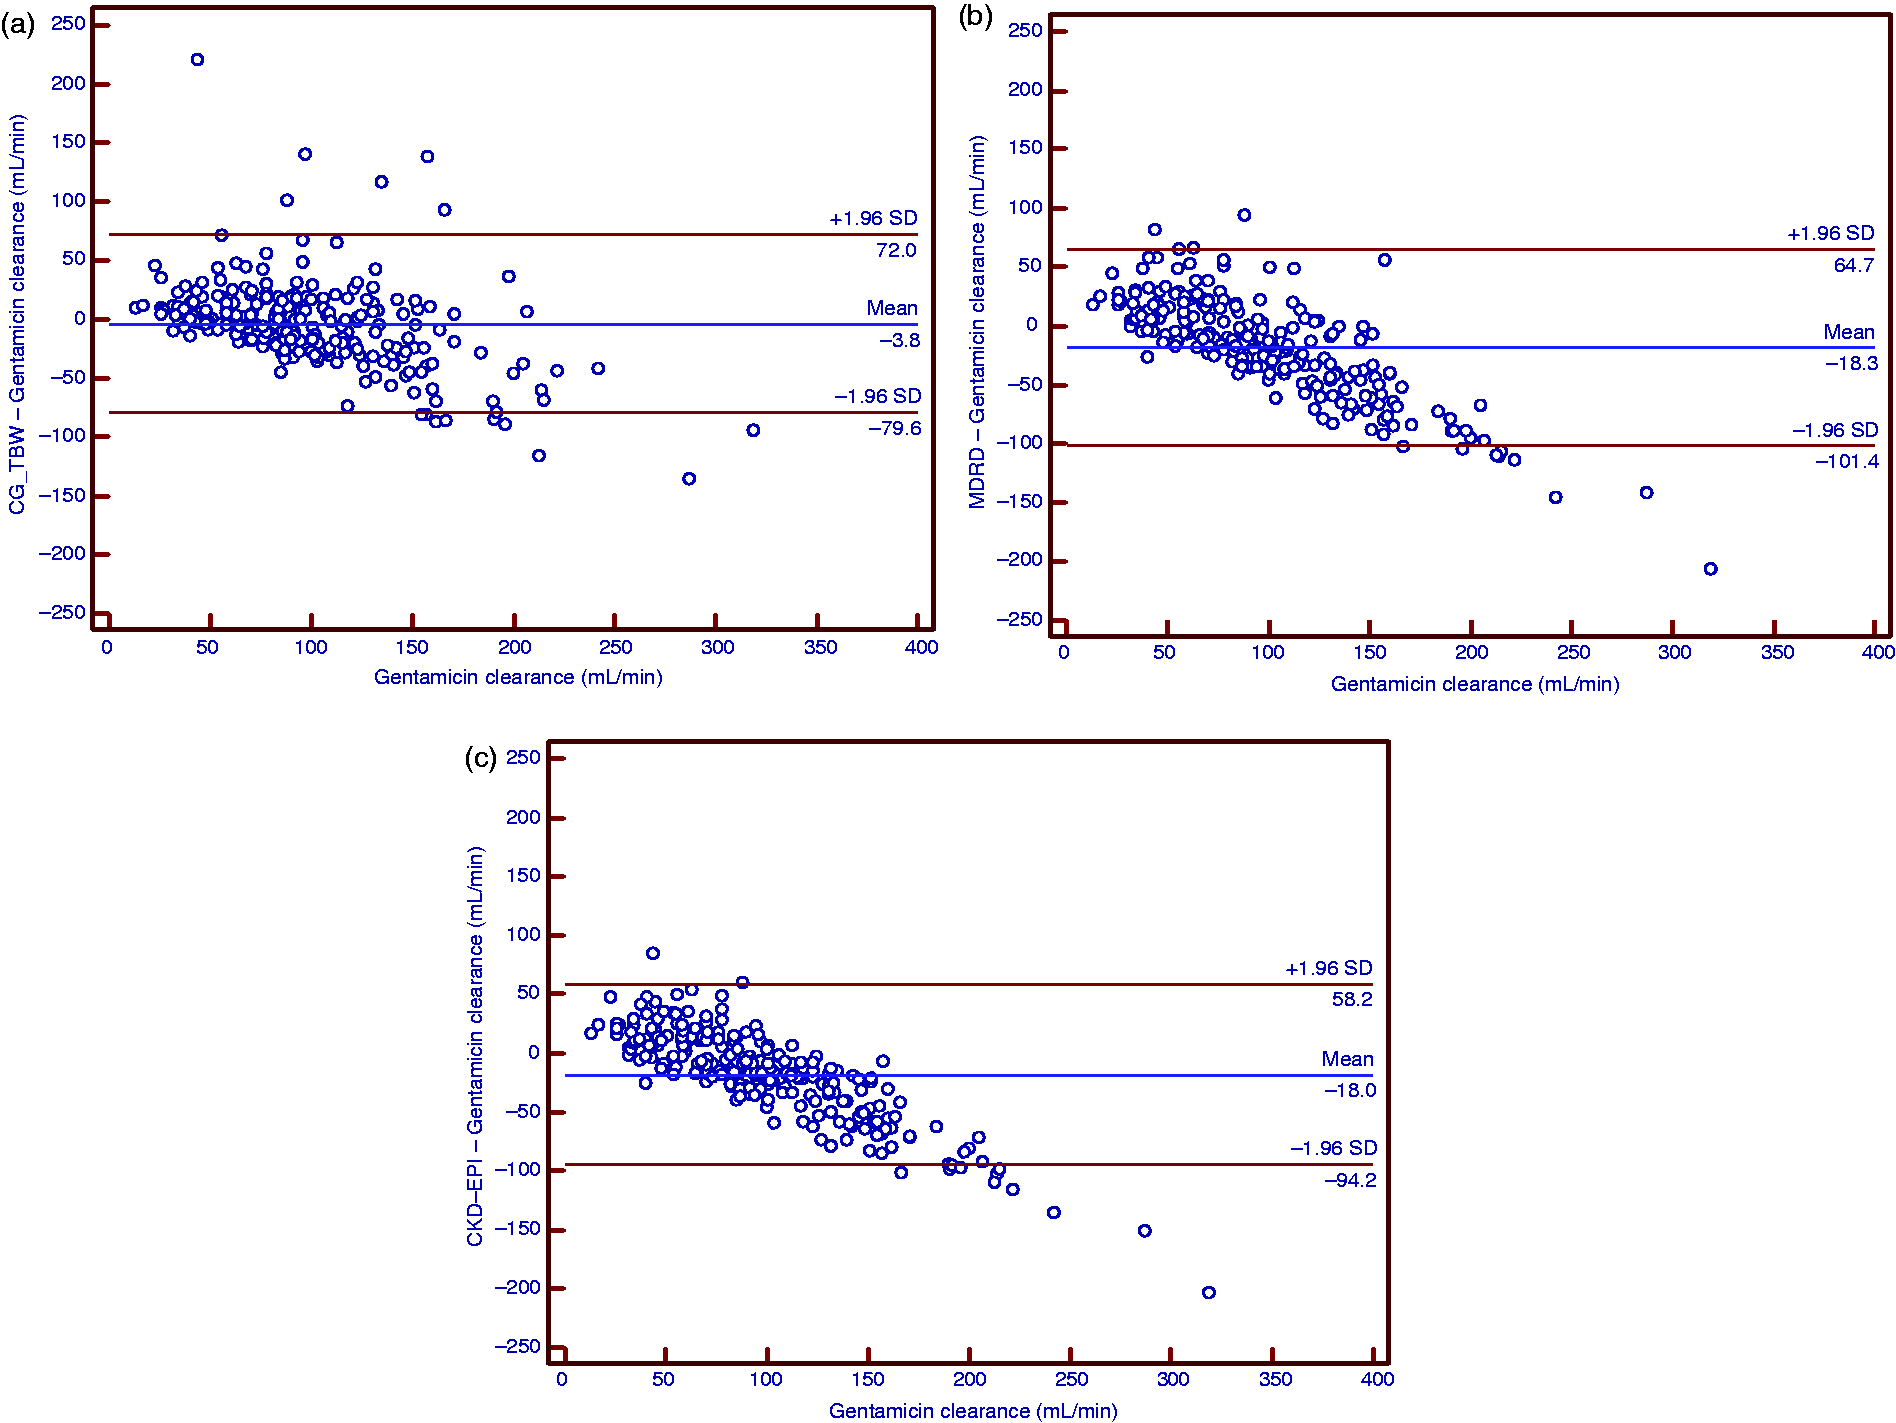
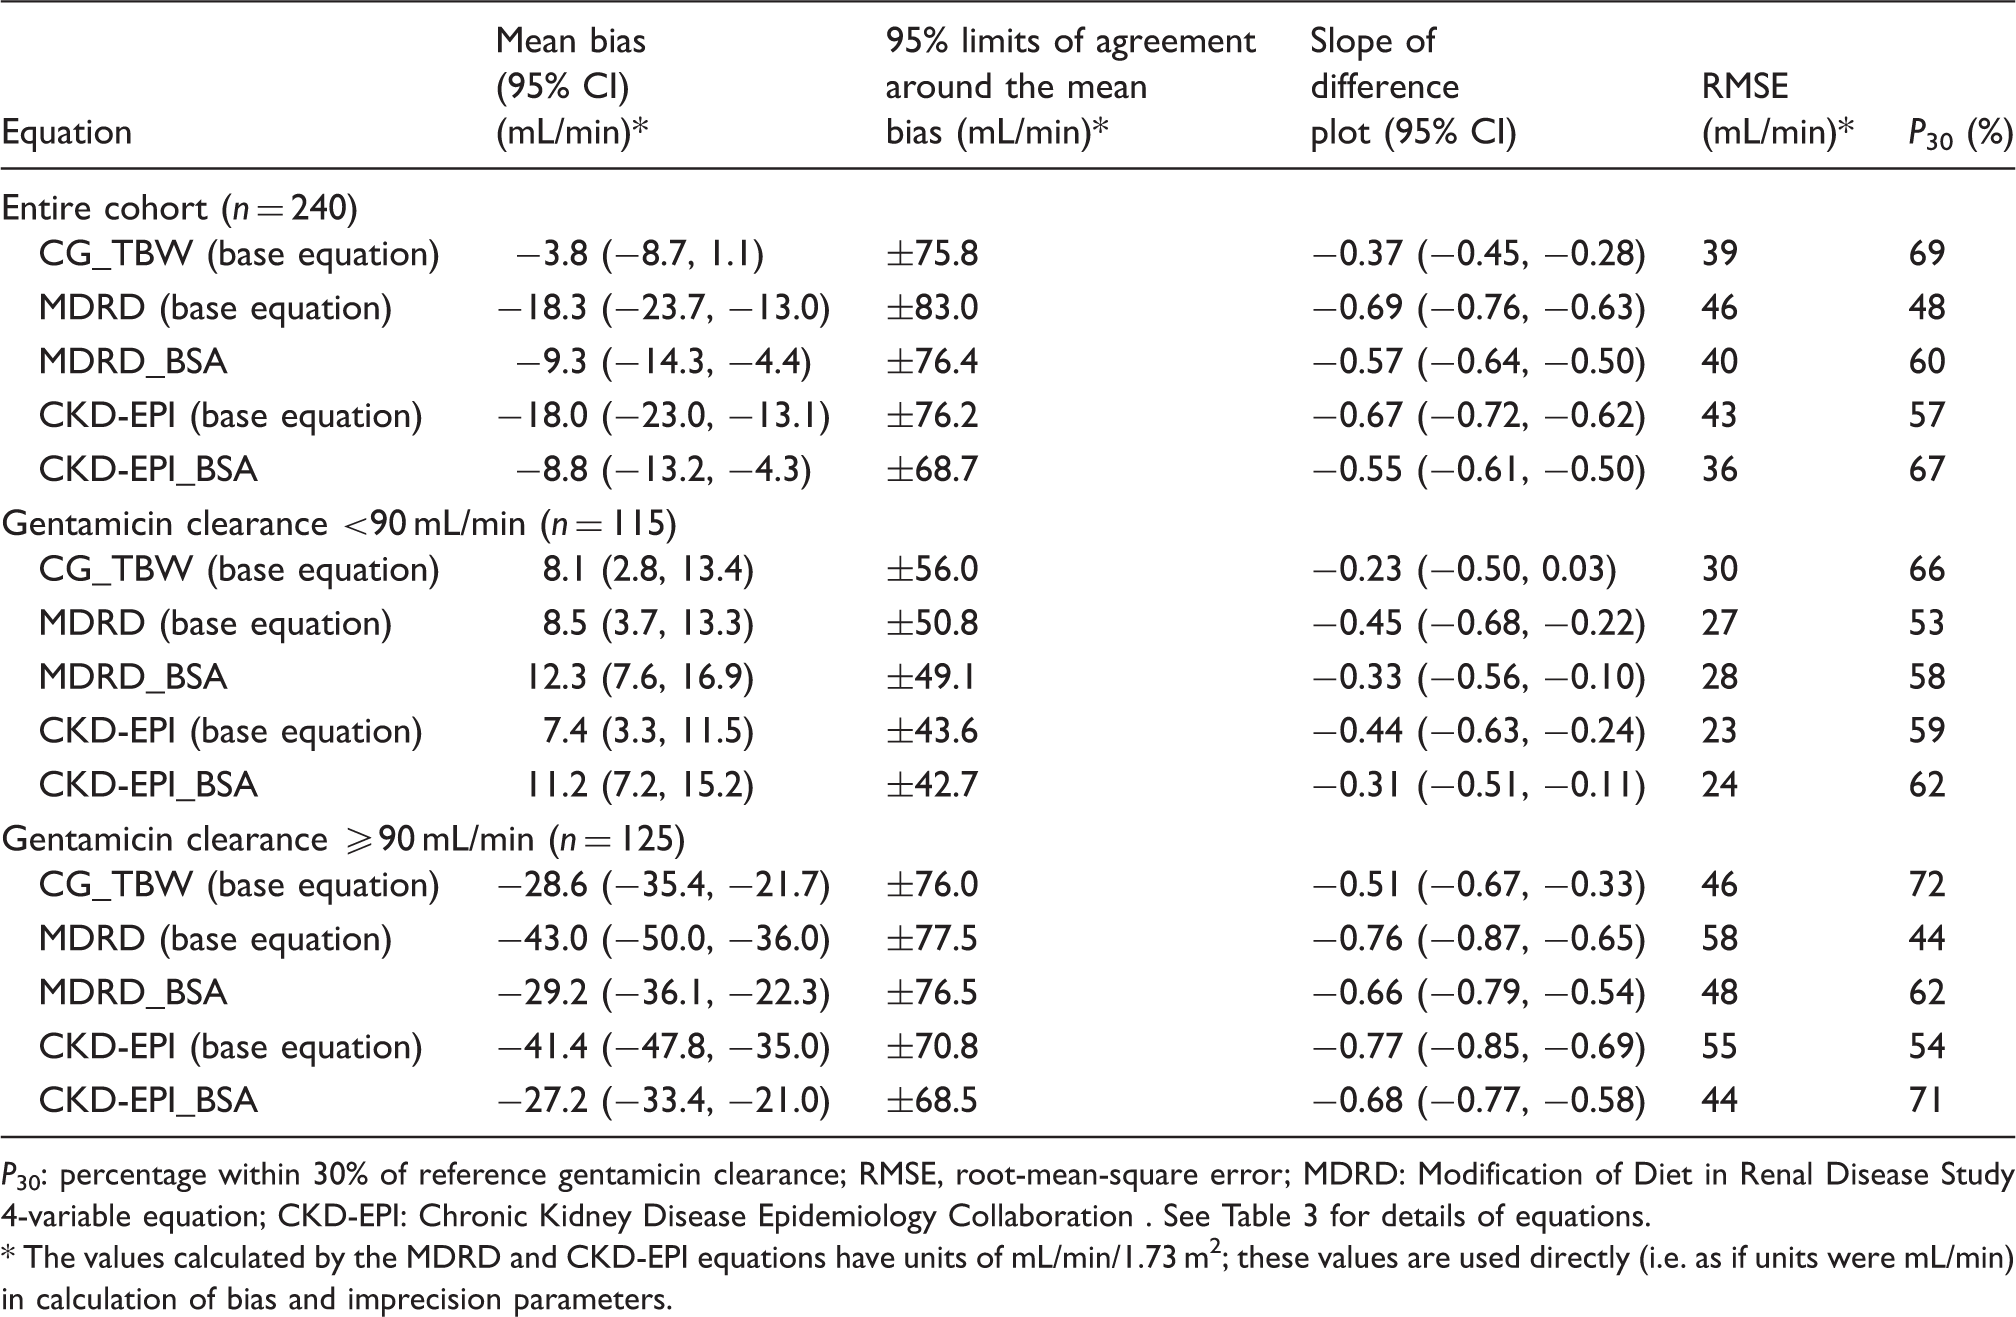
The CKD-EPI base equation had the lowest RMSE (23 mL/min) of the three base equations in patients with gentamicin clearance <90 mL/min (Table 5). However, the P30 (59%) of the CKD-EPI equation was not significantly different from the other two base equations (adjusted P ≥ 0.38). Further, correction for individual BSA did not significantly improve the P30 or RMSE of either the MDRD or CKD-EPI equations in those with gentamicin clearance <90 mL/min. The Cockcroft-Gault equation had the highest P30 (72%, adjusted P ≤ 0.001) and lowest RMSE (46 mL/min) of the three base equations in patients with gentamicin clearance ≥90 mL/min (Table 5). In this high clearance subgroup, correction for individual BSA improved the P30 of both MDRD (P < 0.001) and CKD-EPI equations (P < 0.001), with commensurate improvements in the RMSE values. Overall, there was lower bias and imprecision of the base equations in patients with gentamicin clearance <90 mL/min (RMSE values ranging from 23 to 30 mL/min) than those with gentamicin clearance ≥90 mL/min (RMSE 46–58 mL/min). Further, the simple linear regression slopes of the difference plots were steeper in the ≥90 mL/min gentamicin clearance subgroup (−0.51 to −0.77) than the <90 mL/min gentamicin clearance subgroup (−0.23 to −0.45) (Table 5, Supplementary Figure 3). However, the P30 values of each of the three base equations were not significantly different between these two subgroups (P ≥0.20 for each respective pairwise comparison). Of note, gentamicin clearance was largely underestimated by the base equations in the subgroup with gentamicin clearance ≥90 mL/min (Supplementary Figure 3).
The Cockcroft-Gault equation had a higher P30 (70%) than the MDRD (31%, adjusted P < 0.001) and CKD-EPI (44%, adjusted P = 0.001) equations in the subgroup with BMI < 18.5 or ≥30 kg/m2 (Supplementary Table 3). The P30 of the Cockcroft-Gault equations employing total body weight were higher than those using either IBW (adjusted P = 0.021) or LBW (adjusted P = 0.044), but were not significantly different from those using AIBW (adjusted P > 0.99). Correcting for individual BSA in this subgroup was associated with significantly higher P30 for the MDRD equations (adjusted P < 0.001 for pairwise comparisons of equations with and without correction for individual BSA). This was also the case for the CKD-EPI equation (P = 0.001). Further, correction for individual BSA for the MDRD and CKD-EPI equations also led to a reduction in RMSE values, as a consequence of smaller mean biases and narrower limits of agreement. In the 160 individuals with BMI 18.5–30 kg/m2, no significant difference in P30 was present for either the MDRD equation (Cochran’s Q(3) = 6.3, P = 0.096) or the CKD-EPI equation (P = 0.13) when corrected for individual BSA (Supplementary Table 4). There was a greater increase in P30 for both MDRD (χ 2 (1) = 26.9, P < 0.0001) and CKD-EPI (χ 2 (1) = 11.7, P = 0.0006) equations with the correction for individual BSA in those with BMI < 18.5 or ≥30 kg/m2 than in those with BMI 18.5–30 kg/m2.
No significant difference in P30 was demonstrable between the three base equations for the subgroup with creatinine <60 µmol/L (Cochran’s Q(2) = 2.9, P = 0.23, Supplementary Table 5). Setting the serum creatinine concentration at a minimum of 60 µmol/L did not improve the P30 of the Cockcroft-Gault equation (Cochran’s Q(7) = 0.8, P > 0.99) or MDRD equation (Cochran’s Q(3) = 1.5, P = 0.68) for this cohort. There was also no systematic improvement in the other measures of bias and imprecision.
Discussion
The disparities between various equations for estimating renal function when used to guide dosing of renally cleared drugs have been investigated in the literature.15,17,18,27,31 Our data contributes in four ways. Firstly, our study is the first to demonstrate the utility of the CKD-EPI equation for gentamicin dosing in the setting of an IDMS-aligned creatinine assay. Secondly, it adds to the evidence base for the use of the Cockcroft-Gault equation in drug dosing, which has otherwise achieved a pre-eminence largely through accumulated experience. 8 Thirdly, we have demonstrated the benefits of correcting the MDRD Study and CKD-EPI equations for individual BSA in the setting of gentamicin dosing. Finally, we have shown substantially different bias in the performances of the equations above and below 90 mL/min of gentamicin clearance, suggesting that GFR estimates at higher clearance values are less predictive of gentamicin clearance.
Gentamicin is a highly polar drug that is almost entirely excreted unchanged via glomerular filtration.29,32 Equations that provide estimates of GFR can therefore be used to predict the clearance of gentamicin and to guide its dosing.13,15–18,33 These are particularly useful for guiding the initial dose of gentamicin, prior to feedback from gentamicin concentrations. Further, there are clinical indications such as acute pyelonephritis, where antimicrobial therapy can consist of a single dose of gentamicin followed by alternative orally administered therapy. These accounted for 12% of gentamicin usage at Christchurch Hospital during 2011 (JWA Vella-Brincat, Christchurch Hospital, NZ, personal communication, 2012), and are another setting where gentamicin is dosed in the absence of guidance based on gentamicin concentrations.
Drug-dosing recommendations in relation to impaired GFR have historically been based on the Cockcroft-Gault equation.5,34 However, there is also recognition that relatively few clinicians actually employ the Cockcroft-Gault or indeed any equation for estimating GFR for drug dose adjustment. 35 Estimates of GFR have become more accessible to clinicians through the increasing availability of automated reporting of these estimates, using the MDRD Study, and latterly the CKD-EPI, equations. 36 The CKD-EPI and later versions of the MDRD Study equations were developed using IDMS-aligned creatinine assays. The original Cockcroft-Gault equation was developed prior to this standardization, and there is no widely accepted modification of this equation in this setting. Therefore, the performance of these equations in comparison to the Cockcroft-Gault equation for drug dosing in an IDMS-aligned era is an important issue to address.
We are aware of four previous papers comparing the performance of the Cockcroft-Gault, MDRD Study and CKD-EPI equations in relation to aminoglycoside clearance. Bookstaver et al. 15 found in 71 patients that the MDRD Study equation was superior to the Cockcroft-Gault equation for predicting aminoglycoside clearance. 15 However, they used the 6-variable version of the MDRD Study equation, 37 which is less widely used by laboratories than the 4-variable version. Both Roberts et al. 16 and Ryzner 17 found that aminoglycoside clearance correlated better with the Cockcroft-Gault equation using IBW than the 4-variable MDRD Study equation in 68 and 55 patients, respectively. Despite employing an IDMS-aligned creatinine assay, Roberts et al. 16 used the 186 version of the MDRD Study equation, rather than the 175, which is likely to have led them to overestimate GFR values by ∼6%. 16 Pai et al. 18 demonstrated the utility of the CKD-EPI equation for predicting aminoglycoside clearance in a large cohort of 2073 cases. However, they did not provide details of the creatinine assay(s) used. As their cohort was drawn from the period 1982–2003, it is likely that a significant proportion of patients had serum creatinine evaluated with an assay that was not IDMS-aligned, and thus in whom the CKD-EPI equation should not necessarily have been directly applied.
As the CKD-EPI equation is emerging as the preferred equation in clinical laboratories for estimating GFR, 38 the examination of its performance in the drug-dosing setting is important, as ideally a single equation should be used for any scenario where an estimate of GFR is required. Most dose adjustment is concerned with patients with impaired renal function. Our results pertaining to the patients with gentamicin clearance <90 mL/min are most relevant to this setting (Table 5). The CKD-EPI equation had the lowest RMSE of the three base equations in this subgroup. While the P30 of the CKD-EPI was not statistically significantly different from that of the Cockcroft-Gault equation, it is curious that the latter had a slightly higher P30. An explanation for this anomaly is as follows. The CKD-EPI equation was associated with fewer ‘extreme’ outliers in the prediction of gentamicin clearance, giving the lower RMSE. However, the ‘non-outliers’ of the Cockcroft-Gault equation are closer to the line of equality, leading to the higher P30 (Supplementary Figure 3). It is also notable that correction for individual BSA did not improve the performance of the CKD-EPI equation in this subgroup. An explanation for this is that the median BSA in this subgroup was 1.82 m2 (Supplementary Table 1), which is closer to 1.73 m2, the standard reference,6,7 than that of the entire subgroup (1.94 m2, Table 4). In the subgroup with gentamicin clearance ≥90 mL/min, there was a significant improvement in the performance of the CKD-EPI equation with the removal of BSA normalization. This subgroup had a median BSA of 2.00 m2 (Supplementary Table 1), which reinforces the idea that correction of the CKD-EPI equation for individual BSA is important the further away the patient’s size is from the standard reference BSA of 1.73 m2. 39
Additional support for the principle of accommodating individual sizes when using the CKD-EPI equation comes from our examination of the subgroups with BMI <18.5 or ≥30 kg/m2. Here, we demonstrated that correcting for individual BSA improved the performances of the MDRD Study and CKD-EPI equations. For example, an 82-year-old male being treated for urosepsis in the current study cohort with a BMI of 30.9 kg/m2 and BSA of 2.24 m2 was found to have a gentamicin clearance of 54 mL/min based on gentamicin concentrations. His serum creatinine was 158 µmol/L at that point in time, with CKD-EPI GFR values of 35 mL/min/1.73 m2 and 45 mL/min, with and without normalization for his BSA, respectively. The use of the former GFR value would have led to dose of 3 mg/kg, compared with 4 mg/kg with the use of the latter GFR value (Table 1), which is a 25% difference in dose. Our findings contrast with those of Pai et al., 18 who found that the removal of BSA normalization decreased the precision of these equations. However, given the uncertainty regarding the IDMS-alignment of the creatinine assay(s) used in their study population, it is difficult to make direct comparisons. It is most plausible biologically that an individual’s drug clearance should correlate better with their actual, rather than BSA-normalized, GFR. 39 Our findings are consistent with published guidelines that state that body size should be accommodated when using the MDRD Study and CKD-EPI equations for the dosing of renally cleared drugs.3,38 This is of some importance as it is more convenient for clinicians to employ the ‘raw’ result from the laboratory, with units of mL/min/1.73m2, rather than converting to actual mL/min, to guide drug dosing.
The performance of the equations in predicting gentamicin clearance was inferior in those with higher (≥90 mL/min) compared with lower (<90 mL/min) clearance. Pai et al. 18 noted a similar finding in their cohort, with the explained variance of gentamicin clearance by the equations less where estimated GFR was ≥60 mL/min. Our data demonstrate that the equations increasingly underestimate the reference gentamicin clearance as gentamicin clearance increases. This is unexpected, given that gentamicin has a fraction excreted unchanged by the kidneys of over 0.9, with the predominant mechanism of elimination being glomerular filtration. 32 There are various possible explanations for this phenomenon in individuals at the higher end of renal function. The equations have largely been designed to identify renal impairment, rather than increased renal function, and may thus estimate true GFR poorly in these individuals. There is evidence of this for the MDRD Study equation, 40 which is only validated for GFR <60 mL/min/1.73m2. 6 The Cockcroft-Gault equation was developed in 249 patients with a mean serum creatinine of 123 µmol/L, 4 so few had ‘enhanced’ GFR. However, there are data demonstrating good performance with the CKD-EPI equation in individuals with GFR >60 mL/min/1.73m2. 40 Alternative explanations include an increasing contribution of non-GFR mechanisms to gentamicin clearance with increasing renal function, or overestimation of gentamicin clearance by the one-compartment method at high concentrations of renal function. We are not aware of any data to support these two explanations.
It can be argued that the performance of the equations in patients with gentamicin clearance ≥90 mL/min is not relevant to gentamicin dosing because dose adjustment is traditionally only employed in patients with impaired, as opposed to ‘enhanced’, renal function (Table 1). From this perspective, any of the Cockcroft-Gault, MDRD Study and CKD-EPI equations is reasonable to use given their comparable performances in the subgroup with gentamicin clearance <90 mL/min (Table 5). However, from a general perspective, the performance of the equations in those with high renal drug clearance could be an important issue to address, as underestimation of renal drug clearance in individuals with ‘enhanced’ GFR may lead to underdosing. For a given dose rate of a renally cleared drug, a patient with an ‘enhanced’ GFR is expected to have lower steady-state drug concentrations than the patient with ‘normal’ GFR. It has thus been argued that aminoglycosides should be dosed more frequently, such as every 18 h, in patients with ‘enhanced’ GFR. 41 Further, this may be an issue for drugs where concentrations are not routinely measured and that do not have validated surrogate markers of effect. 42 The area of dose adjustment in states of increased GFR requires more attention.
The superiority of the Cockcroft-Gault equation employing total body weight over those employing the other weight descriptors is perhaps surprising given the wide range of body sizes in our study population. The use of total body weight in the Cockcroft-Gault equation would be expected to lead to overestimation of renal function in obese patients, as total body weight is a poor surrogate for muscle mass in this population. 43 A potential reason for our finding is that our patients had similar body composition to those included in Cockcroft and Gault’s seminal study, but this aspect of their patients is not described in sufficient detail in their paper. 4 Pai et al. 18 also found that the use of ideal and LBW did not improve the prediction of gentamicin clearance using the Cockcroft-Gault equation in a study population comprising 19% with obesity.
The utility of setting the minimum serum creatinine concentrations at 60 µmol/L has previously been demonstrated for the Cockcroft-Gault equation in the setting of IBW as the weight descriptor in relation to gentamicin clearance. 19 This has also been demonstrated for carboplatin, 44 and reflects the idea that low serum creatinine concentrations may be a consequence of low muscle mass and thus low creatinine production, rather than high creatinine clearance. However, in the current study there was little change in the bias and imprecision when a minimum creatinine of 60 µmol/L was applied to either the Cockcroft-Gault or MDRD Study equations. This may be a consequence of the small number of patients (n = 37) that had a low serum creatinine concentration, and the fact that the range of creatinine concentrations in this subgroup, 41–59 µmol/L, was already close to 60 µmol/L. Another large study, which included 409 patients with serum creatinine concentrations of less than 70 µmol/L, found that this approach did not improve the performance of the Cockcroft-Gault equation for estimating creatinine clearance. 23 The data regarding the utility of setting a minimum creatinine concentration are thus conflicting.
There are a number of limitations to our study. We did not examine how dosing decisions in each individual might be altered according to the equations chosen to predict gentamicin clearance. We assumed that the recorded gentamicin doses were completely delivered to each individual. However, there may have been some loss of gentamicin in giving sets if these were not flushed, which in our institution is more likely to have occurred in individuals who are less severely ill, such as those receiving gentamicin some time after their initial acute presentation, and those not in the intensive care unit. Assuming the most extreme losses as a consequence of not flushing in these individuals, we have recalculated the comparative statistics for the three base equations for the entire cohort (Supplementary Table 6). While there is improvement in the performance of the equations, especially of the mean biases of the MDRD Study and CKD-EPI equations, the CKD-EPI and Cockcroft-Gault equations remain superior in terms of the values of RMSE and P30. Our conclusions are therefore not materially altered. Nonetheless, the incomplete delivery of prescribed doses could have contributed to the low P30 values, in comparison to those observed in studies assessing GFR equations against measured GFR (P30 around 80%). 36 Further, while our study only included individuals with creatinine concentrations within 25% of their baseline, all were in hospital. This could potentially contribute to the low P30 as it is likely that these individuals had more unstable renal function than those in the outpatient setting, where measured GFR is typically performed.
In conclusion, our study has demonstrated that the CKD-EPI and Cockcroft-Gault equations provide the best estimates of gentamicin clearance in the setting of an IDMS-aligned creatinine assay. Importantly, this result applied not only to the entire cohort that was studied, but also to the subgroup with gentamicin clearance <90 mL/min, where dose adjustment is most likely to occur. Further, we have shown that removal of BSA normalization improved the performances of the MDRD Study and CKD-EPI equations, especially at the extremes of size. We were unable to demonstrate advantages of either setting a minimum serum creatinine concentration for the Cockcroft-Gault and MDRD Study equations, or of alternative weight descriptors to total body weight for the Cockcroft-Gault equation. The prediction of gentamicin clearance by the GFR equations was increasingly poor at gentamicin clearances exceeding 90 mL/min. Further work examining the outcomes associated with gentamicin dosing according to different renal function equations is required.
Footnotes
Acknowledgements
We would like to thank: Carl Kirkpatrick, Graeme McQueen, Phil Tough and Pam Buffery for their help in assimilating the data from local databases; Lesney Stuart and the staff of Core Biochemistry, Canterbury Health Laboratories for gentamicin and creatinine assays and Chris Frampton for advice with the statistical analyses.
Declaration of conflicting interests
None.
Funding
PKLC is a recipient of the Health Research Council of New Zealand Clinical Research Training Fellowship (2012–2014).
Ethical approval
The Upper South B Regional Ethics Committee of New Zealand approved this study (URB/12/02/010).
Guarantor
EJB.
Contributorship
PKLC researched the literature and conceived the study. PKLC, CMF and EJB were involved in gaining ethical approval and data analysis. PKLC was involved in data collection. PKLC wrote the first draft of the manuscript. All authors reviewed and edited the manuscript and approved the final submitted version of the manuscript.
References
Supplementary Material
Please find the following supplemental material available below.
For Open Access articles published under a Creative Commons License, all supplemental material carries the same license as the article it is associated with.
For non-Open Access articles published, all supplemental material carries a non-exclusive license, and permission requests for re-use of supplemental material or any part of supplemental material shall be sent directly to the copyright owner as specified in the copyright notice associated with the article.