
Abstract
Neuroendocrine neoplasia (NEN) is a heterogeneous group of tumours and often represents a therapeutic challenge to clinicians. The peptides chromogranin A (CgA), chromogranin B (CgB) and cocaine- and amphetamine-regulated transcript (CART) are widely distributed throughout the neuroendocrine system. CgA and CgB have been used as general NEN biomarkers for many years, while CART has only recently been identified. Of these biomarkers, CgA is the most commonly used. However, circulating CgA concentrations exhibit considerable intra-individual biological variation, are altered by proton pump inhibitors (PPIs) and somatostatin analogues and are elevated in non-NEN malignancies. Therefore, interpretation of CgA results must be in the context of these confounding factors. The effects of treatment and non-NEN conditions on circulating CgB and CART concentrations are less well understood. CgB is less affected by impaired renal function and PPIs than CgA; while, circulating CART concentrations lack a diurnal variation in humans and are more reliable markers of pancreatic NEN malignancy than CgA. The utility of circulating CgA measurements in NEN prognosis, surveillance and disease recurrence has been widely investigated. However, the utility of CgB and CART in NEN management is yet to be elucidated. Further studies are needed to establish whether CgB and CART are useful alternatives to CgA.
Keywords
Introduction
Neuroendocrine neoplasia (NEN) constitutes a heterogeneous group of tumours, which are often clinically silent, thus presenting a considerable diagnostic and therapeutic challenge. Since 70% of NEN patients present with metastatic disease, these tumours are commonly associated with a poor outcome. 1 Therefore, circulating biomarkers which facilitate early diagnosis and hence improve survival are critical. Ideally, such biomarkers would also distinguish between stable and progressive tumours to guide imaging and treatment.
NEN often secrete chromogranins into the circulation which can be measured to provide information on diagnosis, treatment monitoring and disease recurrence. Chromogranins, particularly chromogranin A (CgA), are used as general NEN biomarkers, although they are not always elevated in NEN patients. Furthermore, false-positive results may occur, whereby circulating CgA is elevated in patients without a NEN. Such limitations in the diagnostic accuracy of current NEN biomarkers have led to calls for more reliable circulating biomarkers. 2 Cocaine- and amphetamine-regulated transcript (CART) is a recently identified NEN biomarker. We discuss its role in NEN diagnosis, with reference to chromogranins, as the most commonly used circulating NEN biomarker.
Chromogranins
Neurons and neuroendocrine cells contain membrane delimited stores of peptide hormones, biogenic amines and neurotransmitters that appear electron-dense on transmission electron microscopy. These dense-core secretory vesicles, present throughout the neuroendocrine system, store and release chromogranins. Chromogranins are a group of acidic, soluble secretory proteins. The most widely studied chromogranin is CgA, which was first isolated from chromaffin cells of the adrenal medulla.
3
CgA is a single polypeptide chain of 439 amino acids and 10 dibasic cleavage sites. Chromogranin B (CgB), isolated from a rat prohormone convertase 12 (PC12) phaeochromocytoma cell line, is a larger single polypeptide chain of 657 amino acids containing 15 dibasic cleavage sites.
4
In humans, the CgA gene is localized on chromosome 14q32 and CgB is localized to chromosome 20pter – p12.
5
Chromogranins are pro-proteins, with multiple recognition sites for endopeptidases, including the serine endopeptidases, PC1 and PC2.
6
Both CgA and CgB undergo post-translational processing, generating several products (Figure 1). The antibodies used in assays which measure circulating chromogranins are developed using fragments and not the whole chromogranin molecule.
Representation of chromogranin A and B peptides. Below each full length representation are the processed functional peptides with their amino acid number position. Dashed lines indicate the sites of dibasic peptides where processing occurs. Both chromogranins have a disulphide bridge (S–S) located at the N-terminal end.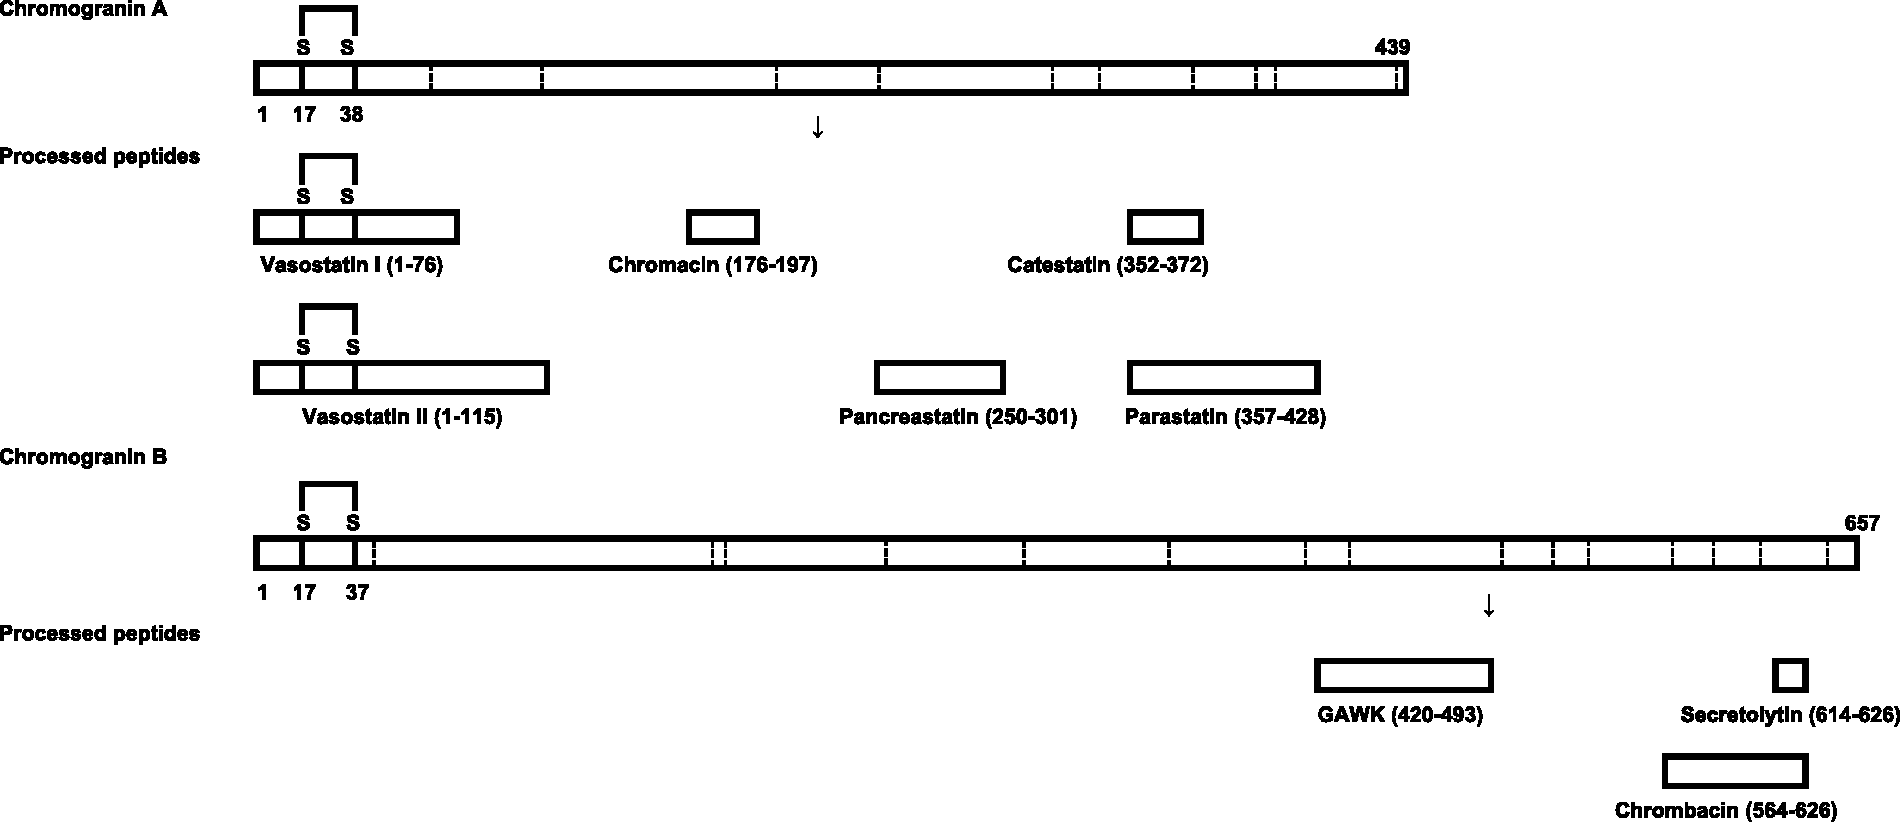
Functions of chromogranins
Intracellularly, chromogranins contribute to the overall biogenesis of vesicle formation and facilitate the sorting of other regulated secretory proteins. Down-regulation of CgA expression by antisense RNA in PC12 cells reduces secretory granules and reduces the number of secretory granule proteins in these cells, with CgA restoring granules and secretory granule protein levels. 7
Processing of chromogranins gives rise to multiple bioactive peptides. The peptides formed include the vasodilator vasostatin (human CgA 1–76), the catecholamine release inhibitor catestatin (human CgA 352–372) 3 and the dysglycemic peptide pancreastatin (human CgA 250–301) (Figure 1). Pancreastatin regulates glucose metabolism in cells and isolated organs by inhibiting glucose-stimulated insulin release from pancreatic islet cells, it also inhibits glucose uptake by adipocytes and hepatocytes.8–10 CgA has been investigated considerably more than CgB, although fragments of CgB have been attributed bacteriolytic effects and in the regulation of calcium signalling. 11
CART
CART was first characterized as an mRNA transcript up-regulated in the rat brain following administration of psychostimulants in 1995. 12 However, 14 years previously, the first 30 amino acids of a peptide known as somatostatin (SST)-like peptide was isolated from ovine hypothalamus and partially sequenced. 13 This partially sequenced peptide was an N-terminal portion of the peptide CART (55–102) and indicated that CART was translated into a protein product. A complete analysis of the CART cDNA revealed that it was highly conserved between rats and humans, with 95% homology at the deduced amino acid sequence. 14
CART structure and processing
CART is highly conserved between species suggesting an important physiological role. In the rat, CART mRNA is alternatively spliced to produce two CART mRNA forms. One lacks 39 nucleotides in the coding region. Thus, CART is expressed as a precursor of either 116 or 129 amino acid residues. There is a predicted signal sequence of 27 amino acid residues which is cleaved to produce a mature CART protein of either 102 (long form) or 89 (short form) amino acids
12
(Figure 2). However, only the short form is found in humans.
14
In humans, the CART gene is located to chromosome 5q13–14.
15
Representation of the CART peptide. preproCART contains a 27-amino acid signal sequence which is cleaved to produce the mature peptide. This is further processed at dibasic amino acids, indicated by the dashed lines. K and R are the single amino acid abbreviation for lysine and arginine, respectively.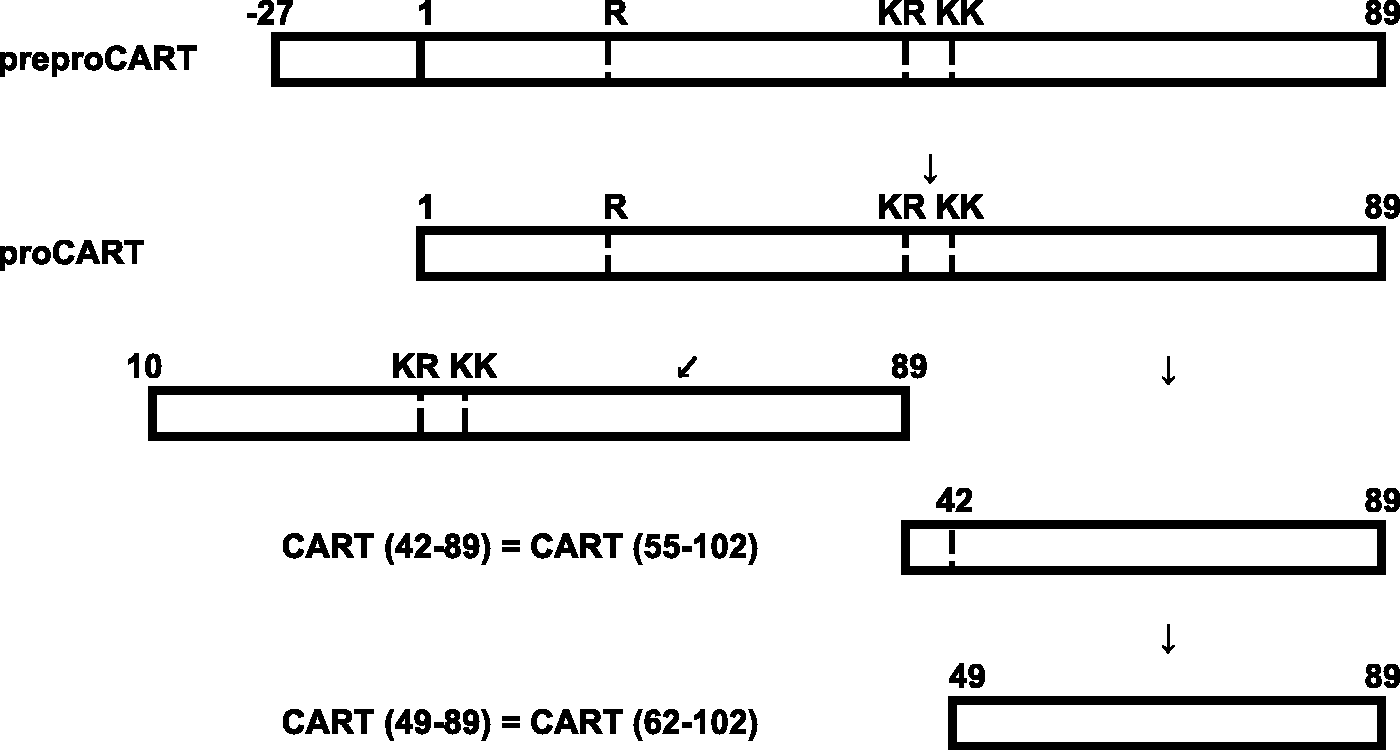
CART peptides have been analysed in the rat hypothalamus, pituitary and adrenal glands. CART (42–89) and CART (49–89) are expressed in the hypothalamus. The anterior pituitary lobe contains only CART (42–89), while the posterior pituitary lobe contains only CART (49–89). CART (1–89) and CART (10–89) are both detected in the adrenal gland, and both exist in forms with or without a post-translational modification of about 80 mass units. Interestingly, there is no evidence of a translation product from the long splice variant. 16
Both CART (1–102) and CART (1–89) are substrates for the PC2 and PC1/3 in vitro and in vivo. 17 PC1/3 is more potent than PC2 in generating the intermediate form, CART (33–102) and CART (1–27), from long pro-CART and is exclusively responsible for generating the intermediate form CART (10–89), from the short precursor. In contrast, PC2 is much more efficient than PC1/3 in generating CART (55–102) and CART (62–102). The biological activity of CART peptides resides in CART fragments (55–102) and (62–102) with CART (55–102) being more extensively studied than any other fragment. 18
CART distribution
CART mRNA and peptides are found in a number of locations in the central nervous system and the periphery. CART mRNA is expressed at particularly high levels in the hypothalamus, where it has been proposed to be the third most abundant tissue-specific mRNA.19,20 Immunocytochemistry studies have identified CART peptides in pancreatic islet SST-producing cells in adult rats, 21 in myenteric neurons throughout the rat gastrointestinal tract and in rat antral gastrin cells. 22 CART peptides are expressed in normal rat pancreatic tissue and high amounts are expressed in rat pancreatic glucagonomas. 23 There is little data on CART distribution in the human gut, but it has been found in human intra-pancreatic neurons and in islet cells during foetal development, and to co-localize with insulin in human insulinomas. 24 Interestingly, a recent large study demonstrated CART-immunoreactivity in 80% NEN tumour specimens originating from thyroid, stomach, ileum, pancreas and rectum. 25 There is only one study which compares human tissue CgA-immunoreactivity and CART-immunoreactivity. The samples, obtained from three family members with well-differentiated neuroendocrine carcinoma, had strong CgA-immunoreactivity for all three patients with scattered CART-immunoreactivity in two patients. 26
Functions of CART
Evidence suggests that the CART system plays a role in feeding, stress, reward and reinforcement and endocrine regulation.
CART-immunoreactivity is localized to hypothalamic regions involved in the regulation of energy homeostasis, including the ventromedial hypothalamus, dorsomedial nucleus, lateral hypothalamus, arcuate nucleus and the paraventricular nucleus. 27 Early studies of CART have thus investigated its role in appetite regulation. In rats, central administration of CART (55–102) powerfully inhibits food intake. Furthermore, administration of antibodies against CART peptides increased feeding, suggesting an anorectic role for CART. 28 Central administration of CART (55–102) induced c-Fos expression in hypothalamic regions involved in appetite and neuroendocrine control. 29
The anorectic effects of CART (55–102) may be secondary, however, to effects on behaviour and motor function. Central administration of CART (55–102) causes loss of co-ordination and compromises overall motoric competence. 29 More recent rodent studies of the effects of CART on energy balance dispute its anorectic role have shown CART to increase food intake.30,31
CART mRNA and peptides have been localized in the paraventricular nucleus, anterior pituitary and the adrenal glands19,27 suggesting that CART plays a role in mediating the stress response. Corticotrophin-releasing factor (CRF) increases CART expression in cultured anterior pituitary cells, and peripheral CRF injection in rodents increases serum CART and adrenocorticotrophic hormone. 32 In addition, CART increases CRF mRNA levels and CRF release from hypothalamic explants.32,33 Interestingly, CART mRNA and CART-immunoreactivity are reduced in the arcuate nucleus of adrenalectomized rats, and this effect is reversed with corticosterone, 34 suggesting a role for CART in the negative feedback regulation of the hypothalamic–pituitary–adrenal (HPA) axis.
Sympathetic tone, exercise and heart failure
It has long been known that the circulating concentration of CgA varies with sympathoadrenal activity. Standing and exercise will result in a modest rise in circulating CgA concentrations which peak 2–15 min after starting activity.35,36 Therefore, blood samples should be taken from patients at rest. Given the association of CgA with sympathetic tone it is perhaps not surprising that CgA concentrations are also elevated in patients with heart disease and CgA concentrations were associated with a higher risk of mortality. 37 However, the use of CgA measurement does not provide any additional prognostic information to existing heart failure biomarkers. 38 No studies have investigated circulating CgB or CART concentrations in exercise or human heart failure, although increased plasma concentrations of CgB have been measured in the post-myocardial infarction heart failure mouse model. 39
Serum versus plasma measurement
Although CgA can be measured in either serum or plasma, there are conflicting results as to whether the sample type makes a difference to the concentration measured. In six healthy volunteers, no difference in CgA concentrations was found in samples collected using various anticoagulants (heparin, EDTA or fluoride/oxalate), or none at all (serum sample). 40 Furthermore, a strong positive correlation (r = 0.9858) between serum and plasma samples was found in samples taken from 40 patients with carcinoid. 41 In other studies, however, higher concentrations of CgA have been measured in plasma compared to serum in two different commercially available kits (Cis-Bio and Alpco).42,43 A possible explanation for this difference is the formation of CgA aggregates in the presence of free calcium ions, which may be prevented by EDTA present in the plasma collection tube. 44 Given the conflicting reports, it is recommended that a laboratory using a CgA assay should establish a detailed collection protocol and reference range.
There are no published comparisons on serum and plasma measurements for CgB and CART.
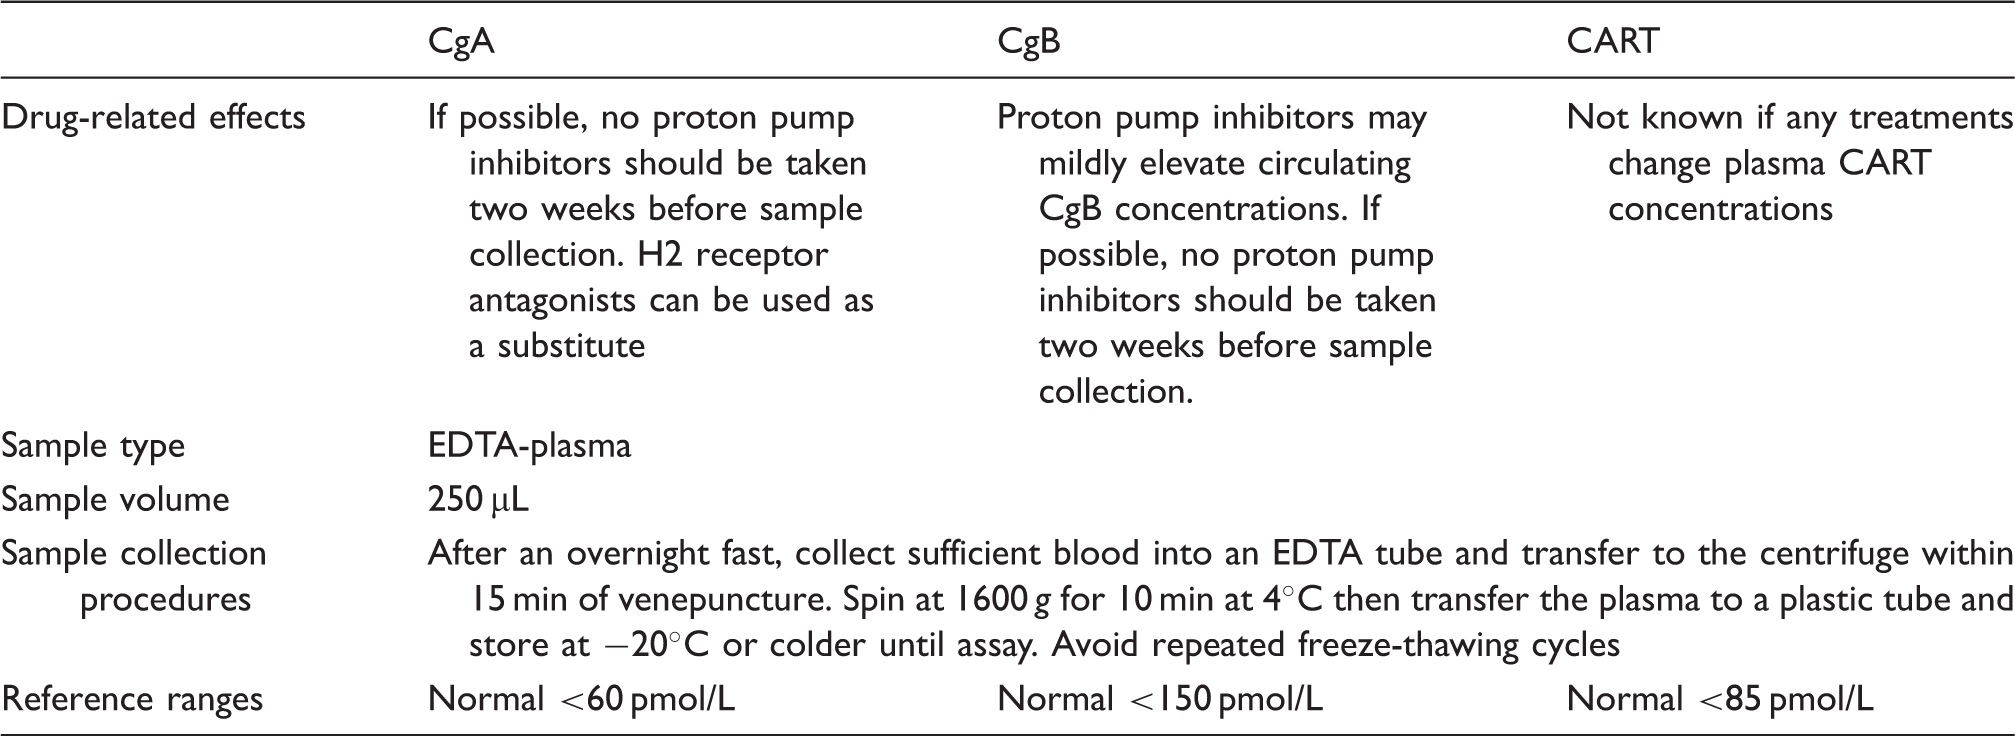
In vitro stability of plasma CgA, CgB and CART
Sample collection requirements for CgA, CgB and CART measurement.
Circulating variation
Sex and age variation
There are conflicting reports as to whether there are sex differences in CgA concentrations. Three studies have found no difference,37,47,48 one study measuring significantly higher concentrations in men 49 and another study measuring significantly lower concentrations of CgA in men compared to women. 50 All studies used different CgA assays which may account for the conflicting results.
There is also uncertainty as to how circulating CgA concentrations change with age. One study observed no significant difference in CgA concentrations between healthy subjects under and over 50 years of age. 51 Another study observed small increases in CgA concentrations with increasing age. 49 Since renal function decreases with age and circulating CgA is renally cleared, it is likely that small increases in CgA concentrations with age may reflect renal impairment. 46
There have been no published studies investigating sex and age variation on circulating CgB concentrations. There are two reports on the effects of age and sex on circulating CART concentrations in humans. In a small study of healthy controls, plasma CART concentrations were higher in men than women and this difference was more prominent in hypothyroid patients. For all controls and thyroid patients, plasma CART concentration increased with age. 52 A subsequent larger study in healthy subjects found no significant difference in circulating CART levels in men and women. 46
Food intake
The effects of feeding on CgA are also conflicting. While one study observed no difference in concentrations of healthy subjects after an 800 kcal meal, 53 three other studies measured higher concentrations in post-prandial healthy subjects and NEN patients with peak concentrations circulating between 60 and 120 min post-prandially.54–56
No studies have reported on CgB fasting and non-fasting concentrations. Fuel availability has been suggested to play a role in modulating CART levels, as 24 h food restriction prevents any daily variation in CART levels in the periphery and brain. 57 Furthermore, food restriction has been shown to decrease CART mRNA expression in the hypothalamus of mice. 28 However, in humans, there was no significant difference in plasma CART concentrations after consuming a 560 kcal meal in 12 healthy volunteers. 46 Plasma CART concentrations were found to be significantly higher in anorexia nervosa patients compared to healthy subjects. 58 Furthermore, for anorexic and recovered anorexic patients, there was a significant inverse correlation with plasma CART and body mass index.
Biological variation
In humans, the adrenal medulla contains the largest amount of CgA-immunoreactivity, with significantly smaller amounts found in the pituitary, pancreas, stomach and small intestine. Selective suppression of the pituitary hormones and adrenalectomy did not significantly reduce circulating concentrations of CgA, but treatment with the ganglionic blocker trimethaphan resulted in a 25% reduction of concentrations after 60 min.53,59
The biological variation of circulating CgA concentrations has been extensively investigated. The first report examined 44 healthy controls and found an overall mean day-to-day variation of 18%. 47 Subsequent studies have since reported similar magnitudes of variation, with mean day-to-day variations ranging from 10.4% 60 to 29% 51 for healthy controls, and mean variations observed in NEN patients ranging from 22% 61 to 29%. 56 Once the analytical and within-subject variation had been considered, the overall critical difference required for a significant change in serial concentrations was calculated to be between 38.4% and 42.6% depending upon the concentration measured. 62 As daily variations as high as 113% have been observed for NEN patients, 56 it may be necessary to determine a patient’s CgA variation before using the biomarker for management and monitoring to enable proper interpretation of results.
Circulating CART peptides were first measured in rats. 23 Diurnal changes in circulating CART peptide concentration have been investigated in the rat and the rhesus macaque. Daily variations in circulating CART concentrations in rats and rhesus macaques parallel the respective rhythm of circulating corticosteroids, suggesting that glucocorticoids may be involved in the regulation of circulating CART peptide. 63 Adrenalectomy reduces circulating CART concentrations in rats by 70% and abolished its diurnal rhythm, a reduction which can be reversed by administration of corticosterone. 57 In humans, plasma CART concentrations have been measured in five healthy volunteers throughout the day (0900 (fasting), 1200, 1500 and 1800 h) and no significant variation was observed. 46
SST analogues and acid suppressant treatment
SST analogues are an effective treatment to relieve symptoms from NEN. 64 SST reduces circulating concentrations of CgA.51,65 The reported effects of SST analogues on CgA concentrations are variable. Infusing 0.5 mg/h of SST for 4 h reduced CgA concentrations significantly after 1 h, reaching a nadir after 2 h 59 ; and infusing 0.5 mg/h of octreotide for 4 h reduced CgA concentrations in healthy subjects, patients with gastric carcinoid type I and patients using proton pump inhibitors (PPIs). Reduction was significantly lower after 1 h and reached a nadir 2–3 h after commencing octreotide infusion. 54 However, another study of octreotide administration to 38 NEN patients resulted in three unresponsive patients, four demonstrating a less than 30% decrease in CgA concentration and a 30–70% decrease in the remainder. 66
PPIs increase circulating CgA concentrations. Short-term PPI treatment of 30 mg/day results in a significant rise of about 2.5-fold in either plasma or serum CgA concentrations when measured by three different commercially available CgA kits. 42 This increase is significantly higher with increased doses of PPI. 67 Serum CgA concentration approximately doubled following medium-term PPI use (90 days), 68 and approximately trebled following long-term PPI administration (six to more than 12 months). 69 Discontinuation of PPI resulted in significant decreases of serum CgA after five days, 67 and continued to decline with a half-life of 4–5 days. 42 H2 receptor antagonists are not associated with an increase in circulating CgA concentrations and therefore, it is recommended that they are used in place of PPIs prior to measurement of CgA.69,70
There have been no studies investigating the affect of SST analogue treatment on circulating concentrations of CgB or CART. A single case study has reported decreasing circulating CgB concentrations in a carcinoid patient over 7 months before a subsequent rise in levels. 71
Circulating concentrations of CgB may vary with PPI treatment. 72 Plasma concentrations of CgA and CgB have been compared in 29 patients treated for more than 3 months with the PPI omeprazole. The study found that 26 of the patients had elevated CgA while only one to two patients had mildly elevated plasma CgB depending on the CgB assay used. 73 The study did not, however, specify the diagnosis of the patients or measure pre-treatment concentrations of CgA and CgB. To date, no studies have measured circulating CART concentrations in relation to antacid treatment.
Renal failure
The majority of filtered low molecular weight (MW) (<68 kDa) proteins are reabsorbed by the renal tubules. After reabsorption, these proteins are then further processed in the proximal tubular cells. Thus, a rise is observed in the blood concentration of many low MW proteins following a decline in renal function.74,75 Elevations in circulating concentrations of other peptide tumour markers have been found in impaired renal function. 76
Chronic renal failure results in a rise in plasma CgA concentration. 77 In particular, renal failure resulting in serum creatinine concentrations above 884 µmol/L can result in plasma CgA concentrations similar to those found in NEN patients. 40 This makes interpretation of plasma CgA results impossible in patients with chronic kidney disease. In patients with advanced renal failure (specified as a glomerular filtration rate (GFR) <20 mL/min), CgA concentrations increased by 22-fold when compared to patients with normal renal function (GFR >100 mL/min). 78
It has been reported that CgB, unlike CgA, is not raised in patients with renal failure, although the clinically more useful CgB (439–451)-LI assay was more affected than CgB (312–331)-LI assay by impaired renal function.73,79
A recent comparison of plasma CgA, CgB and CART concentrations in 107 subjects with GFRs ranging from normal to <15 mL/min found that CgA and CART plasma concentrations were more affected than CgB by decreasing renal function. The highest concentrations of CgA and CART were found in subjects with end stage renal failure and did not exceed 500 pmol/L for either analyte suggesting that concentrations above this may be caused by NENs. 80
Liver failure
CgA concentrations are elevated in patients with liver failure, although the elevation observed is modest compared to those caused by impaired renal function. 40 The occurrence of larger molecular forms of CgA levels in patients with liver disease suggests that the liver metabolizes CgA. 81 Serum CgA concentrations measured using three different assays in 11 patients with liver cirrhosis were elevated in 46–64% of cases. 82 Concentrations of CgA in patients with liver cirrhosis were marginally higher than CgA concentrations in chronic hepatitis but both significantly higher than concentrations in healthy subjects. 83
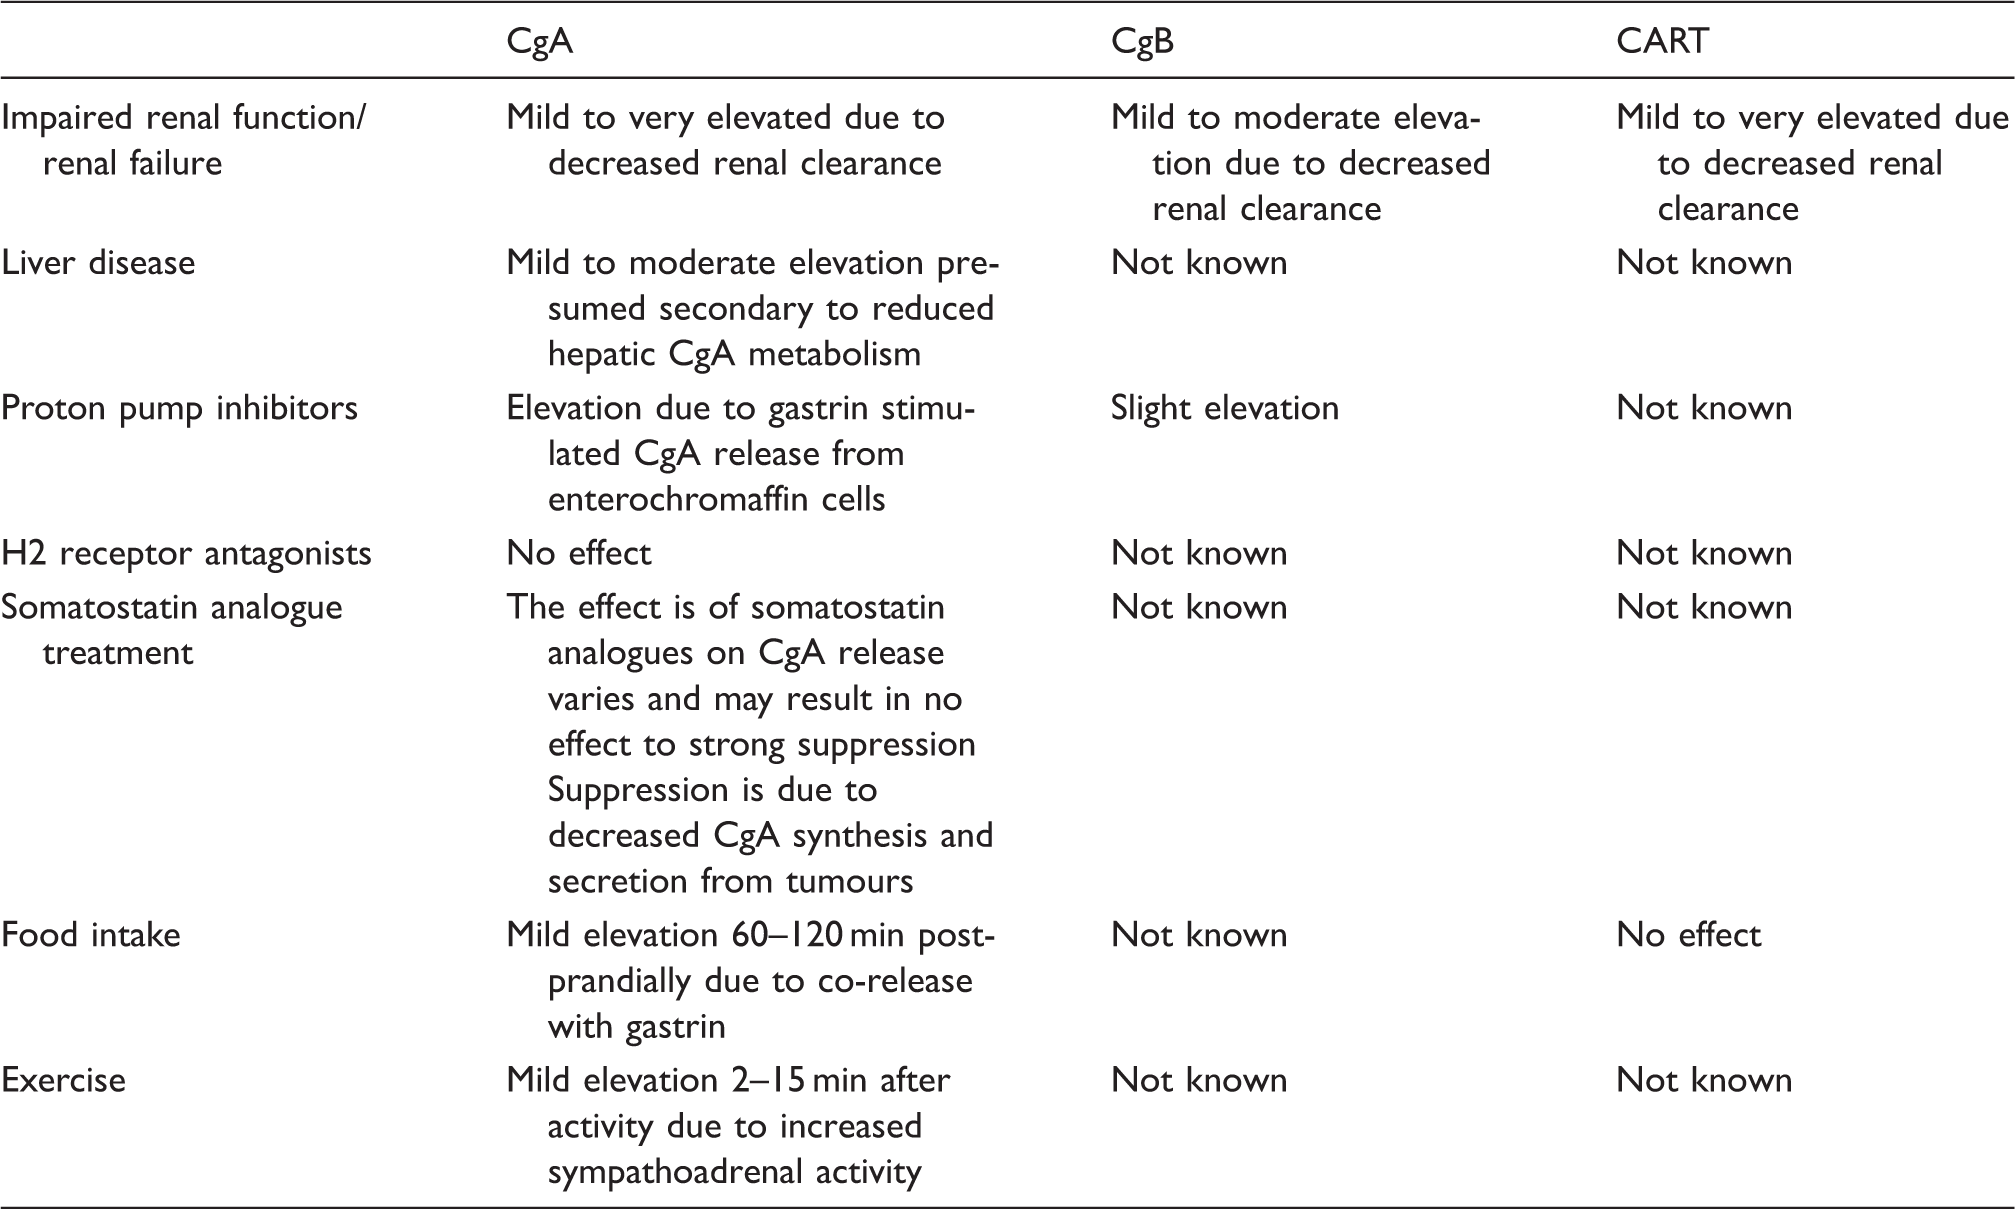
Conditions and treatments which alter circulating CgA, CgB and CART concentrations.
Diagnostic use of CgA, CgB and CART
The importance of CgA in diagnosis and prognosis with NENs has been investigated for over 20 years. 84 Plasma CgA has been proposed as the most reliable NEN marker for indicating progressive disease. 85 Circulating concentrations of CgA are elevated in a variety of NENs, such as phaeochromocytoma, 77 NENs of the gastrointestinal tract, lung and ovary,86,87 CgA is also elevated in non-functioning NENs that are not associated with secretion of a particular hormone, and hence do not present with any clinical syndrome.88–90 Elevated circulating concentrations of pancreastatin have also been found in patients with a range of NENs, including NENs arising from the gastrointestinal tract,91–95 neuroblastoma and ganglioneuroma. 96 Assays specific for the pancreastatin fragment only have been advocated for detecting NENs that have metastasized to the liver. 97
CgB may also be used as a general NEN biomarker. Using an antiserum directed against CgB (439–451), elevated circulating concentrations were measured in patients with gastroenteropancreatic NENs and phaeochromocytomas. 45 Elevated CgB concentrations have been detected in some NEN patients when CgA is not raised. 73 Plasma concentrations of CgB and its C-terminal fragment (GAWK) are elevated in patients with functioning pancreatic NEN. 45 In addition, measurement of both CgA and CgB in combination has been shown to increase detection of neuroendocrine tumours, although it was not determined if the increase was statistically significant. 73
Comparison of the sensitivity and specificity of CgA, CgB and CART in detecting NEN.
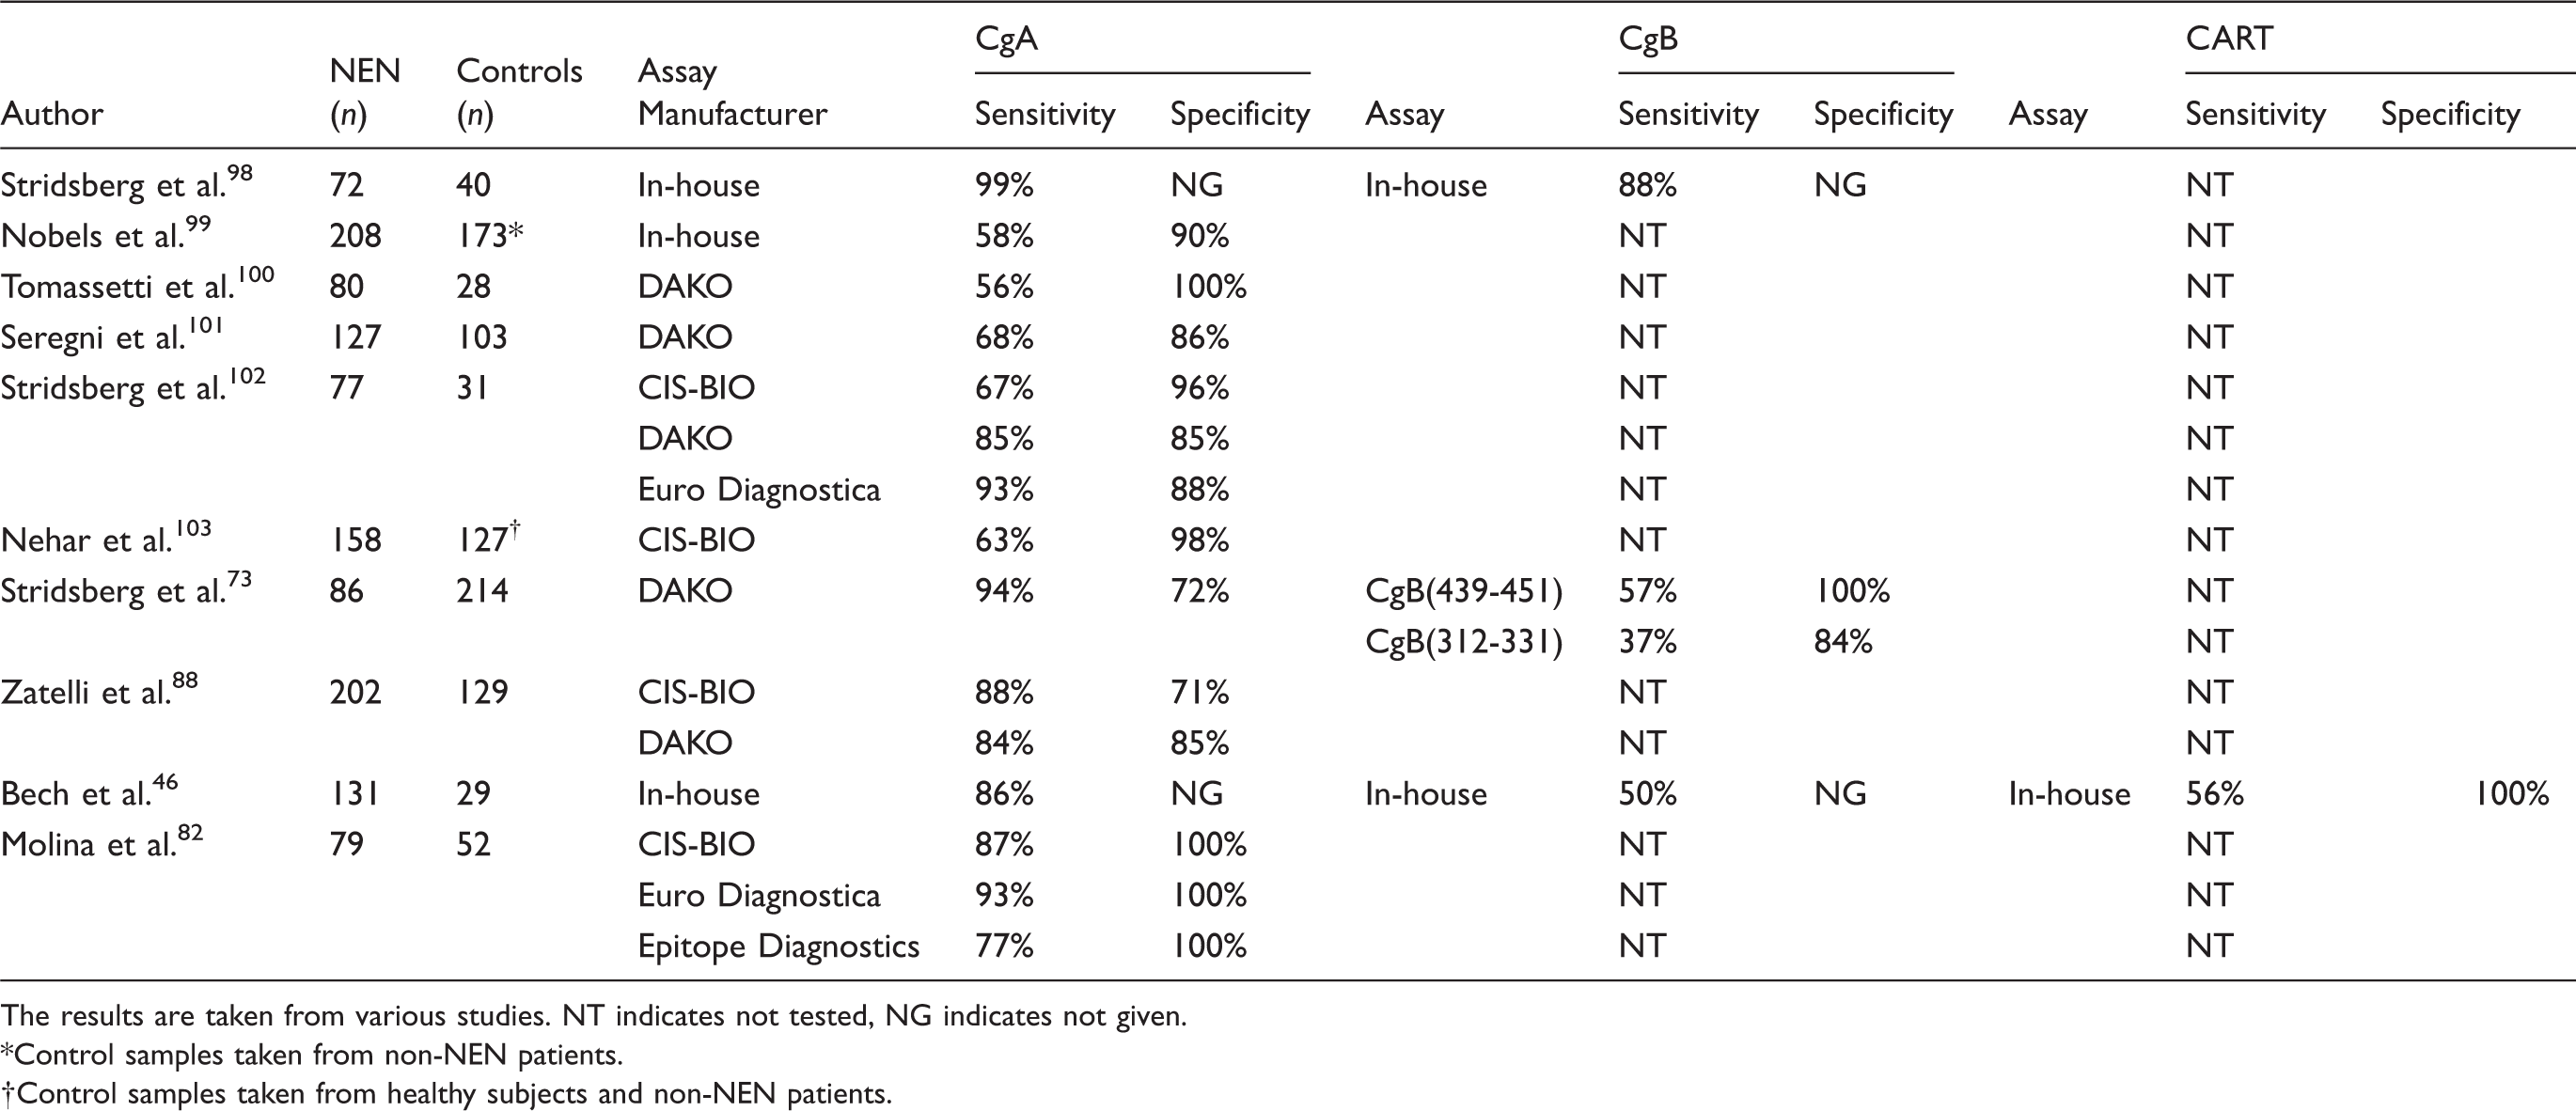
The results are taken from various studies. NT indicates not tested, NG indicates not given.
Control samples taken from non-NEN patients.
Control samples taken from healthy subjects and non-NEN patients.
There has only been one study to date investigating circulating concentrations of CART in NEN patients. 46 Comparing plasma concentrations of CgA, CgB and CART in 131 patients with a range of NENs, CgA was the most sensitive of the three biomarkers, with the sensitivity of CgB and CART being comparable. However, there were differences in tumour marker sensitivity between the different subtypes of NEN with CgA detecting 94% of all midgut and unknown primary NENs, while CART measurement was elevated in 95% of all progressive pancreatic NENs. The overall sensitivity for CgB was 50%
CgA, CgB and CART in non-NEN
High circulating CgA concentrations have been identified in a range of non-NEN tumours. This finding is attributed to the occurrence of tumour neuroendocrine differentiation.106,107 Using different CgA assays, elevated circulating CgA has been detected in patients with carcinoma of the pancreas, liver, ovary, prostate, colon and breast and colon.103,105,108–113 When metastatic non-NEN CgA concentrations were compared with non-metastatic non-NEN CgA concentrations, no significant difference was found. 82 Although circulating CgA is elevated in some non-NEN tumours, it is unlikely that CgA is more sensitive than traditionally used biomarkers. For instance, CgA measurement was not as sensitive as the breast carcinoma biomarker cancer antigen (CA) 15.3 109 or the prostate biomarker prostate-specific antigen (PSA). 110 Furthermore, there was no significant difference in circulating CgA concentrations between patients with prostate cancer and benign prostatic hyperplasia. 111
Data on circulating CgB and CART concentrations in patients with non-NEN are scarce. Elevated plasma CgB was found in five of 63 patients with hepatoma, four of eight patients with pancreatic adenocarcinoma 45 and three of 22 patients with prostate carcinoma. 112 Elevated plasma CART (>150 pmol/L) has been described in patients with pancreatic, bowel and prostate cancer. 46
Histological studies have identified CgA-immunoreactivity and CgB-immunoreactivity in prostate carcinoma. In prostate carcinoma tissue, the incidence of CgA-immunoreactivity found ranged from 10% to 100% and CgB-immunoreactivity ranged from 32% to 80%.107,113,114 A comparison of tissue immuoreactivity and serum concentrations for CgA and CgB in 22 patients with prostate carcinoma revealed a positive correlation for CgA and no correlation for CgB. 112
To date, there have been no histological studies investigating CART-immunoreactivity in non-NEN tumours.
Tumour burden, prognostic indication and monitoring
The behaviour of tumours can be unpredictable and biomarkers, if adequately monitored, can be used to establish changes in tumour progression. 113 Given the possible variation that occurs in circulating biomarkers, it is necessary to first establish a baseline concentration so that treatment and recurrence may be monitored. 115
Several studies have shown that circulating concentrations of CgA correlate with tumour burden and extent of metastases.89,95,103 However, high circulating CgA concentrations have been measured in gastrinoma patients despite the small primary tumour size and absence of metastases, possibly due to CgA secretion from G cells.89,116 Whilst one study observed no correlation with extra-hepatic tumour burden, 117 another study showed high circulating CgA concentrations in patients with diffuse disease compared to local or hepatic disease. 118 Circulating CgB concentrations have been shown to correlate with phaeochromocytoma tumour burden. 79 Currently, it is unknown whether circulating CART concentrations correlate with tumour burden.
The prognostic use of CgA has been investigated in several NEN subtypes including gasteroenteropancreatic NEN and in non-functioning pancreatic NENs.86,117,119,120 In all these studies, increasing plasma CgA concentrations were associated with worse survival rates.
A study comparing the prognostic value of tissue CgA-immunoreactivity and CgB-immunoreactivity in medullary thyroid carcinoma found that lower tissue CgB-immunoreactivity was associated with a significantly worse survival, while no significant difference was observed with CgA-immunoreactivity. 121 However, an elevated circulating CgB concentration at the time of diagnosis was associated with a significantly worse survival rates than a normal concentration of CgB. Furthermore, the median survival was lower when compared with an elevated CgA result at diagnosis, suggesting that CgB may be a more useful prognostic indicator. 122 One explanation for a worse survival with low tissue CgB-immunoreactivity yet elevated circulating CgB concentrations is an increased release of CgB from NEN secretory granules into the circulation, resulting in less CgB available in the cell for staining.
The prognostic value of circulating CART concentrations has not been studied. However, high CART expression in tumour samples from small bowel carcinoid patients was associated with reduced survival compared to low or no CART peptide expression. 26
In patients with gasteroenteropancreatic NEN, a high level of concordance has been observed between tumour burden and circulating CgA concentrations suggesting a role for CgA in detecting disease recurrence. 103 The best evidence for the role of CgA in NEN monitoring is provided by a study comparing CgA, urinary 5HIAA and radiological measurements in patients with a midgut NEN. Of all the tools used, elevated plasma CgA was the first to indicate disease recurrence. 87 No studies have investigated the CgB or CART in NEN disease recurrence. Elevated plasma CgB concentrations have been shown to return to normal in one patient with a phaeochromocytoma and four patients with a vasoactive intestinal peptide tumour (VIPoma) after tumour resection. 45 Therefore, it seems possible that disease recurrence may be accompanied by plasma CgB elevation.
Conclusion
Although CgA is widely used for diagnosis, prognosis and monitoring of NEN, it has several limitations including many non-specific causes of elevation and considerable inter-assay variation. CgB may be used as an alternative in patients taking PPIs or with chronic kidney disease. CART may be a useful NEN biomarker. However, further studies are required to evaluate its utility in NEN diagnosis and prognosis.
Footnotes
Acknowledgements
This article was prepared at the invitation of the Clinical Sciences Reviews Committee of the Association for Clinical Biochemistry.
Declaration of conflicting interests
None declared.
Funding
This research received no specific grant from any funding agency in the public, commercial or not-for-profit sectors.
Ethical approval
Ethical approval not required with regard to the content of this review.
Guarantor
SRB.
Contributorship
The authors contributed equally to the article.