
Abstract
The human and rodent sodium iodide symporters (NIS) have recently been cloned and are being investigated as potential therapeutic and reporter genes. We have extended this effort by constructing an internal ribosomal entry site (IRES)-linked human NIS (hNIS)-enhanced green fluorescent protein (eGFP) hybrid reporter gene for both nuclear and optical imaging. A self-inactivating retroviral vector, termed pQCNIG, containing hNIS-IRES-eGFP dual reporter gene, driven by a constitutive CMV promoter, was constructed and used to generate RG2-pQCNIG cells and RG2-pQCNIG tumors. 131I-iodide and 99mTcO4-pertechnetate accumulation studies plus fluorescence microscopy and intensity assays were performed in vitro, and gamma camera imaging studies in RG2-pQCNIG and RG2 tumor-bearing athymic rats were performed. RG2-pQCNIG cells expressed high levels of hNIS protein and showed high intensity of eGFP fluorescence compared with RG2 wild-type cells. RG2-pQCNIG cells accumulated Na131I and 99mTcO4– to a 50:1 and a 170:1 tissue/medium ratio at 10 min, compared with 0.8:1.2 tissue/medium ratio in wild-type RG2 cells. A significant correlation between radiotracer accumulation and eGFP fluorescence intensity was demonstrated. RG2-pQCNIG and RG2 tumors were readily differentiated by in vivo gamma camera imaging; radiotracer uptake increased in RG2-pQCNIG but declined in RG2 tumors over the 50-min imaging period. Stomach and thyroid were the major organs of radionuclide accumulation. The IRES-linked hNIS-eGFP dual reporter gene is functional and stable in transduced RG2-pQCNIG cells. Optical and nuclear imaging of tumors produced from these cell lines provides the opportunity to monitor tumor growth and response to therapy. These studies indicate the potential for a wider application of hNIS reporter imaging and translation into patient studies using radioisotopes that are currently available for human use for both SPECT and PET imaging.
Introduction
The sodium iodide symporter (NIS) is a transmembrane glycoprotein that mediates the active transport of iodide into the thyroid (basolateral membrane of thyroidal cells) and other tissues, including gastric mucosa, salivary glands, lacrimal glands, choroid plexus, kidney epithelial cells, placenta, and lactating mammary glands [1–5]. The molecular characterization of NIS started with the cloning and characterization of the NIS gene in 1996 [6–9]. The regulation of NIS transcription and posttranslational modifications of NIS, the identification of spontaneous NIS mutations that result in a congenital iodide transport defect and hypothyroidism, the development of anti-NIS antibodies to study NIS cellular localization, as well as the roles of NIS in thyroid cancer and thyroid autoimmune disease have been examined and recently reviewed [10,11].
The cloning and characterization of the NIS gene also provided the opportunity to use the human NIS gene (hNIS) diagnostically and therapeutically [12]. These applications are based on the ability of hNIS to transport and concentrate radioactive iodide (123I–, 124I–, 131I–) [13–18] and other radiolabeled anions (99mTcO4– [13–15,19], 76Br– [17], 99mReO4–) [13,14]. In addition to the ability to image normal thyroid function and to evaluate thyroid tumors for endogenous hNIS expression and possible targeted radiotherapy [20–25], hNIS has the potential to serve as a reporter gene for human studies. More importantly, the substrate for the hNIS reporter gene product is simply iodide, eliminating the need for complicated radiochemical syntheses. It has already been shown that the hNIS gene can be successfully transferred into cultured cells and small animal tumor tumors and that the symporter function of the gene product is preserved [26–30].
In this report we describe the construction and assessment of a dual reporter vector for radionuclide (hNIS) and fluorescence (eGFP) imaging in animals. The dual reporter (hNIS-IRES-eGFP) facilitates studies in both cell cultures and small animals by including a fluorescence component into the reporter. Our longer term, future objective is to further develop the hNIS component of the reporter for human application.
Materials and Methods
Cell Culture
RG2 rat glioma cell line was kindly provided by Dr. D. Bigner (Duke University Medical Center, Durham, NC). RG2 cells were grown and maintained in modified Eagle's medium (MEM, [Gibco, Carlsbad, CA]) supplemented with 10% calf serum, 100 U/mL penicillin, and 100 U/mL streptomycin. Cells were cultured in 100-mm dishes until 60–80% confluence and were then used for transduction experiments and later biological studies.
GPG293 transient retroviral producer cells were obtained from Dr. Richard C. Mulligan [25] and cultured in Dulbecco's modified Eagle's medium (DMEM) (Gibco) supplemented with 10% calf serum, 2 mM
Construction of hNIS-IRES-eGFP Dual Reporter Retroviral Vector
Figure 1 schematically shows the construction of the pQCNIG retroviral vector. Briefly, the full-length human sodium iodide symporter (hNIG) cDNA (M48) was obtained from the retroviral vector bearing hNIS cDNA (kindly supplied by Dr. Uwe Haberkorn) [31]. The open reading frame for hNIS protein was obtained with flanking SalI (5′) and BamHI (3′) restriction sites by polymerase chain reaction (PCR) amplification. The PCR product was digested with SalI and BamHI, and ligated to the SalI-BamHI fragment from the multiple cloning site of pIRES2-eGFP (Clontech, Mountain View, CA). The resulting recombinant plasmid was digested with EcoRI and XbaI. EcoRI-XbaI fragment containing hNIG-IRES-eGFP with a blunted end (3′) was ligated to the EcoRI-EcoRV fragment of the pQCXIX retroviral vector (Clontech). The resulting retroviral vector, termed pQCNIG, contains a constitutive CMV promoter and IRES-linked hNIS-eGFP reporter genes.
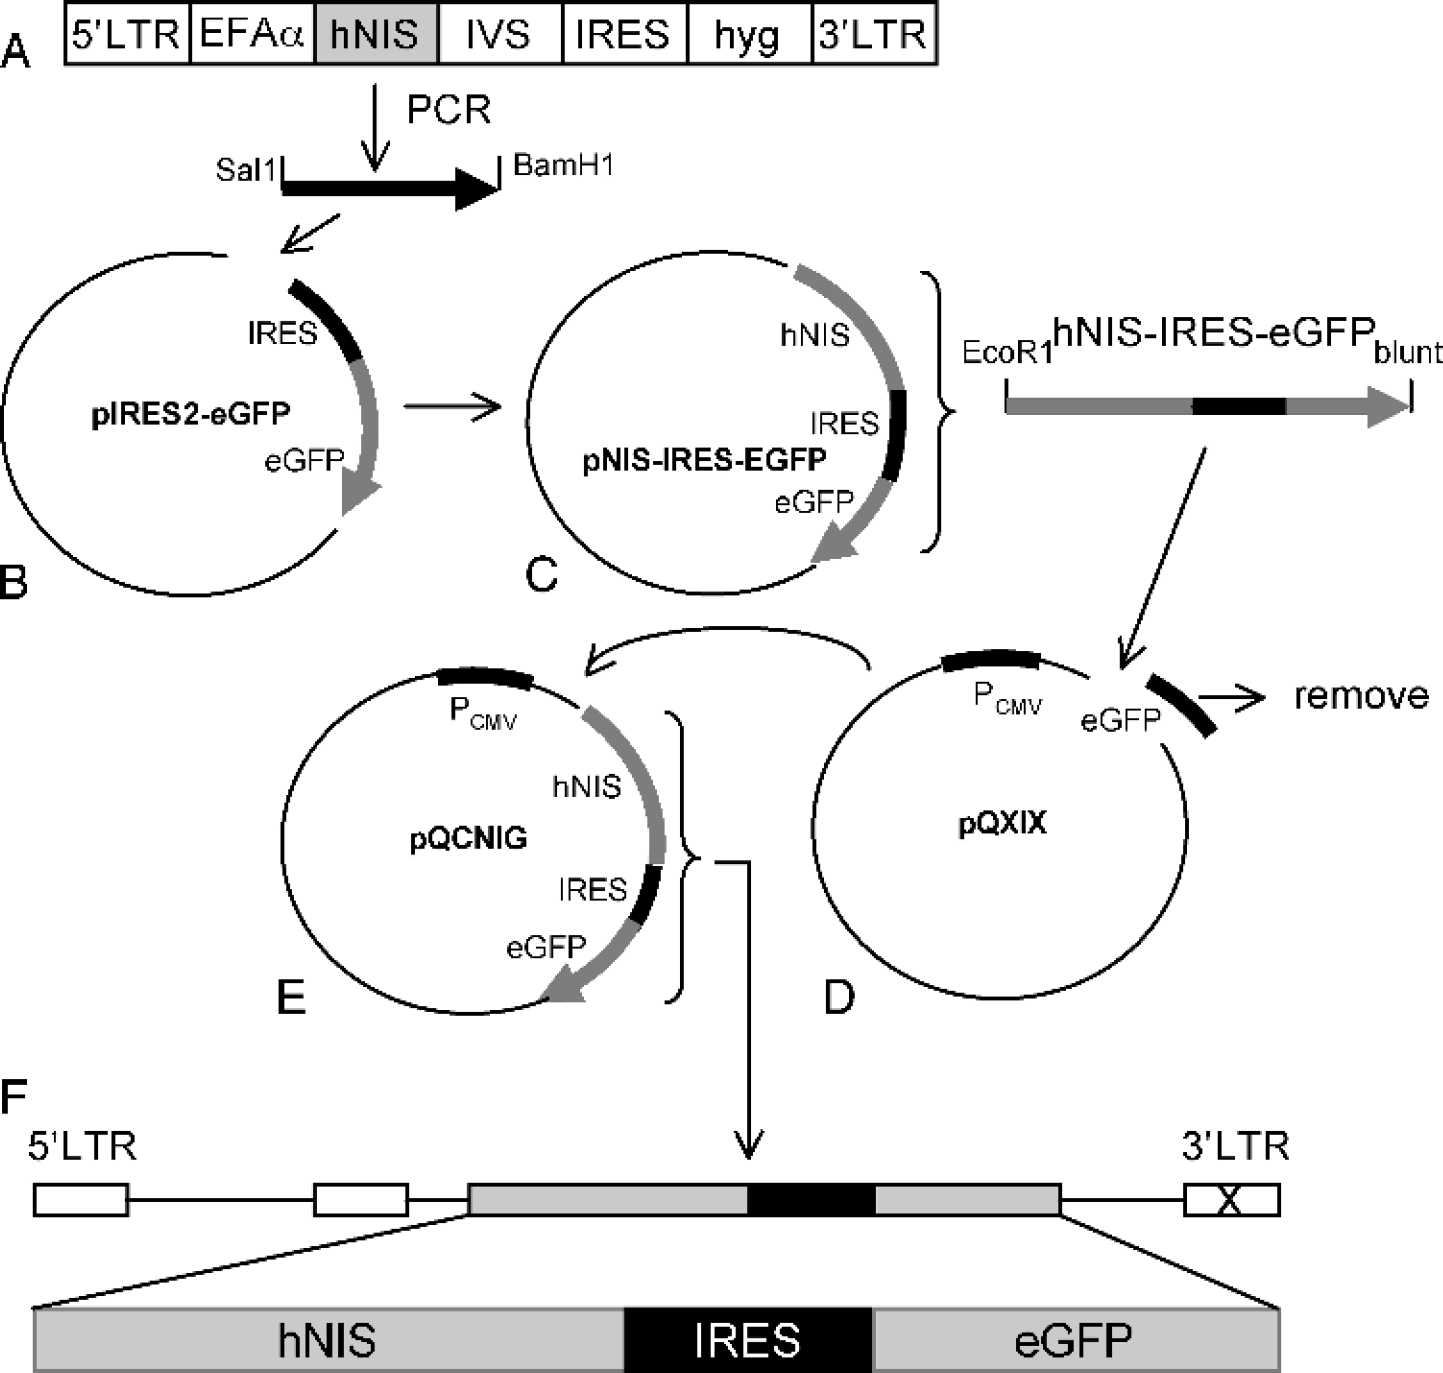
Construction of the hNIS-IRES-eGFP dual reporter retroviral vector. hNIS incorporating Sal1 and BamH1 sites was obtained by PCR amplification from the M48 vector (a), and subcloned into pIRES2-eGFP (b) downstream of the CMV promoter to generate pNIS-IRES-eGFP (c). The hNIS-IRES-eGFP fragment was taken by digestion with EcoR1 and Xba1 and subcloned into the EcoR1-EcoRV site of pQCXIX, a self-inactivated retroviral vector (d), to generate pQCNIG (e). The resulting pQCNIG vector contains a constitutive CMV promoter and two IRES-linked reporter genes, hNIS-eGFP (f).
Tumor Cell Line Transduction
For the establishment of cells constitutively expressing hNIS and eGFP proteins, RG2 cells were transduced with the pQCNIG retroviral vector. Briefly, pQCNIG was transfected into GPG293 transient retroviral producer cells using Lipofectamine (Invitrogen, Carlsbad, CA). Twenty-four hours after transfection of the producer cells, supernatants were collected and passed through 0.45-μm pore-size cellulose acetate filters (Millipore Corp., Bedford, MA). Wild-type RG2 cells were plated at a density of 3 × 10⁶ cells in a 100-mm dish (Costar, Corning, NY) and equilibrated for 24 hr. The culture medium was replaced with supernatant (10 mL) from transfected GPG 293 cells, 8 μg/mL polybrene (Sigma-Aldrich, St. Louis, MO) was added, and the cells were incubated overnight at 37°C. The cells were then expanded in regular culture medium for 6–8 days and prepared for subsequent fluorescence-activated cell-sorting (FACS) analysis and cell sorting. In addition, subclones of the transduced cells were obtained for subsequent analysis and use.
Flow Cytometric Analysis (FACS) and Cell Line Establishment
After 6–8 days of bulk culture, transduced and nontransduced RG2 cells were detached from the tissue culture flask (0.05% trypsin and 0.02% EDTA) and resuspended in MEM. The cells were recovered by centrifugation (400 × g, 5 min) and the pellet was resuspended in an appropriate volume of ice-cold PBS containing 10% fetal calf serum (~2.5 × 10⁶ cells/mL) and passed through a 40-μm mesh to remove debris and cell aggregates. The preparation was subjected to flow cytometric analysis using FACSVantage (Becton Dickinson, San Jose, CA) and then sorted with an INNOVA 70–4 argon laser tuned to 488 nm excitation beam and 510 nm emission to obtain eGFP-positive (eGFP+) cells. Data were processed with CellQuest software. eGFP+ cells were identified by their high fluorescence intensity compared with eGFP-negative (eGFP–) population. The FACS plot analysis revealed a population of eGFP+ cells that was well separated from the eGFP– population. The sorting gate was positioned well into the eGFP+ cells to minimize contents of eGFP– cells in the preparation. The sorted eGFP+ RG2 cells (RG2-pQCNIG) were collected under sterile conditions and expanded in regular tissue culture medium. The eGFP expression in the population of sorted RG2-pQCNIG cells was checked by FACS analysis. A minimum of 10,000 events was collected and GFP signals were detected with a 530/30-nm band-pass filter. Subclones were processed similarly and the expression level of the reporter was stratified in terms of mean eGFP fluorescence intensity as measured by FACS. The RG2-pQHNIG cells were maintained at 37°C in an incubator with 5% CO2 and 95% O2 gas mixture. Cells were carried in 100-mL flasks with MEM medium supplemented with 10% fetal bovine serum, 100 U/mL penicillin, and 100 U/mL streptomycin. Cellular medium was changed twice a week and the cells were subcultured by trypsinization every 5–7 days.
Fluorescence Microscopy
Subcellular localization of the eGFP protein in transduced tumor cells was visualized by fluorescence microscopy using a Nikon Eclipse T-100 microscope (Morrel, Melville, NY) and similar excitation and emission parameters as described above for FACS.
Immunocytochemistry
Localization of hNIS protein in RG2-pQCNIG cells was determined by immunocytochemical analysis. Cells were fixed with cold acetone on glass slides and permeabilized with 4 mM sodium deoxycholate for 10 min. After incubation with 10% normal goat serum, anti-human NIS mouse antibody (Chemicon, Temecula, CA) was added to samples for overnight incubation at 4°C. Slides were then washed with TBS-T buffer and biotinylated antimouse goat antibody was added for 1 hr. After washing with TBS-T buffer three times, the slides were incubated with a soluble ABC complex in TBS-T for 1 hr and washed with TBS-T three times. Chromogen substrate containing 25 mg DAB and 10 μL 30% H2O2 in 50 mL 0.1 M Tris buffer (pH 7.5) was added to the cells for a maximum of 20 min (staining intensity was visually controlled). After washing with water for 5 min, slides were dehydrated, cleared, and mounted.
Cell Membrane Preparation
Following transduction and sorting, cell membranes were prepared from RG2-pQCNIG cells by a modification of a previously described procedure [32]. Briefly, cells plated on 100-mm dishes were washed with PBS, harvested, and resuspended in buffer A [250 mM sucrose, 10 mM HEPES (pH 7.5), 1 mM EDTA, 10 μg/mL leupeptin, 10 μg/mL aprotinin, and 1 mM phenylmethylsulfonyl fluoride]. The cells were homogenized in a ground glass homogenizer in 1 mL buffer, and centrifuged twice at 500 × g for 15 min at 4°C. After centrifugations, 100 μL of 1 M Na2CO3/mL buffer A was added to the supernatant and incubated at 4°C for 45 min with continuous shaking. An additional centrifugation at 100,000 × g was performed for 15 min, and the pellet was resuspended in an appropriate volume of buffer B [250 mM sucrose, 10 mM HEPES (pH 7.5), and 1 mM MgCl2].
Western Blotting
Polyacrylamide gel electrophoretic separation of proteins was carried out using 10% Bis-Tris precast gels (8 × 8 cm, 0.5 mm thick, Bio-Rad, CA) according to the manufacture's instructions, with 6 μg protein sample in each lane after heating at 95°C for 5 min. Separated proteins were transferred onto PVDF membranes at 30 V for 12 hr. After blocking with 5% nonfat milk for 1 hr, the membrane was incubated with the purified rabbit antibody against hNIS (Chemicon) at a final dilution of 1:3000 for 1 hr at room temperature, and with the secondary antibody (peroxidase-conjugated goat antimouse IgG, Amersham Pharmacia Biotech, Little Chalfont, UK) at 1:5,000 dilution for 1 hr. Peroxidase-bound protein bands were visualized using the ECL method (Amersham Pharmacia Biotech).
Na131I and 99MTcO4− Uptake Experiments
In vitro uptake
Iodide and pertechnetate uptake was measured by using a modification of methods previously described [33]. Briefly, RG2-pQCNIG and RG2 wild-type cells [~(5–10) × 105/mL × 20 mL] were seeded onto 15-cm dishes. Following a 24-hr incubation period at 37°C with 5% CO2, the medium was aspirated and the cells were washed with PBS (pH 7.4). Iodide uptake was initiated by adding 15 mL of MEM containing 0.01 μCi/mL Na131I (NEN-Perkin Elmer, Shelton, CT; specific activity >5 Ci/mg, 185 GBq/mg) and 0.1 μCi/mL 99mTcO4– (Nuclear Diagnostic Products, Rockaway, NJ; specific activity ~1Ci/mg, 37 GBq/mg). For the time course assays, cell incubations (37°C, 5% CO2) with Na131I and 99mTcO4 were arranged from 5 to 120 min. Cells were harvested and centrifuged after the desired incubation periods. Cell and medium measurements of radioactivity were made using a gamma counter (Autogamma 5000 Series Gamma Counter, Packard Instrument Company, Downer's Grove, IL) set up for dual 99mTcO4– and Na131I counting. All experiments were done in triplicates and repeated at least twice. Cell-to-medium radioactivity concentration ratios (cpm/g cells ÷ cpm/mL medium) were calculated.
In vivo imaging.
Six athymic rnu/rnu rats (NCI, Bathesda, MD) bearing RG2-pQCNIG and RG2 wild-type tumors in opposite shoulders were studied. Each animal received 200 μCi of 131I-iodide by dorsal penile vein injection and dynamic planar imaging on a large field-of-view gamma camera (Forte, ADAC, Milpitas, CA) was performed as follows: four frames (3 min per frame), three frames (4 min/frame), and two frames (12 min/frame). Similarly, 6 RG2-pQCNIG and RG2 tumor-bearing rnu/rnu rats received 300 μCi of 99mTcO4– by dorsal penile vein injection and were imaged dynamically using the same acquisition sequence.
For 131I imaging, the gamma camera was fitted with a high-energy, high-resolution (HEHR) collimator, and a photopeak energy window of 364 keV + 10% was used. For 99mTc imaging, a low-energy, high-resolution (LEHR) collimator and 140 keV + 10% photopeak energy window were used. Region-of-interest (ROI) analysis was performed to determine the numbers of image counts in the RG2-pQCNIG and RG2 wild-type tumors as well as various normal organs that were visualized; all ROIs were drawn manually. No correction for attenuation and scatter was performed and all images were normalized to 3-min frames.
Statistics
Values are the mean ± SD of these experiments where noted. Statistical significance between experimental values was determined by t testing, and differences were considered significant at p < .05.
Results
Vector Construction and Transduced RG2-pQCNIG Cells
A retroviral vector (pQCNIG) encoding both hNIS and eGFP genes was constructed from a shuttle plasmid, p-hNIS-IRES-eGFP (Figure 1). RG2 cells were transduced by exposure to the pQCNIG retroviral vector; transduced RG2-pQCNIG cells were monitored for eGFP expression by both direct fluorescence microscopy and FACS analysis (Figure 2A). The FACS profile and fluorescence microscopy of the bulk culture of RG2 cells 6 days after transduction shows that ~30% of cells were transduced.
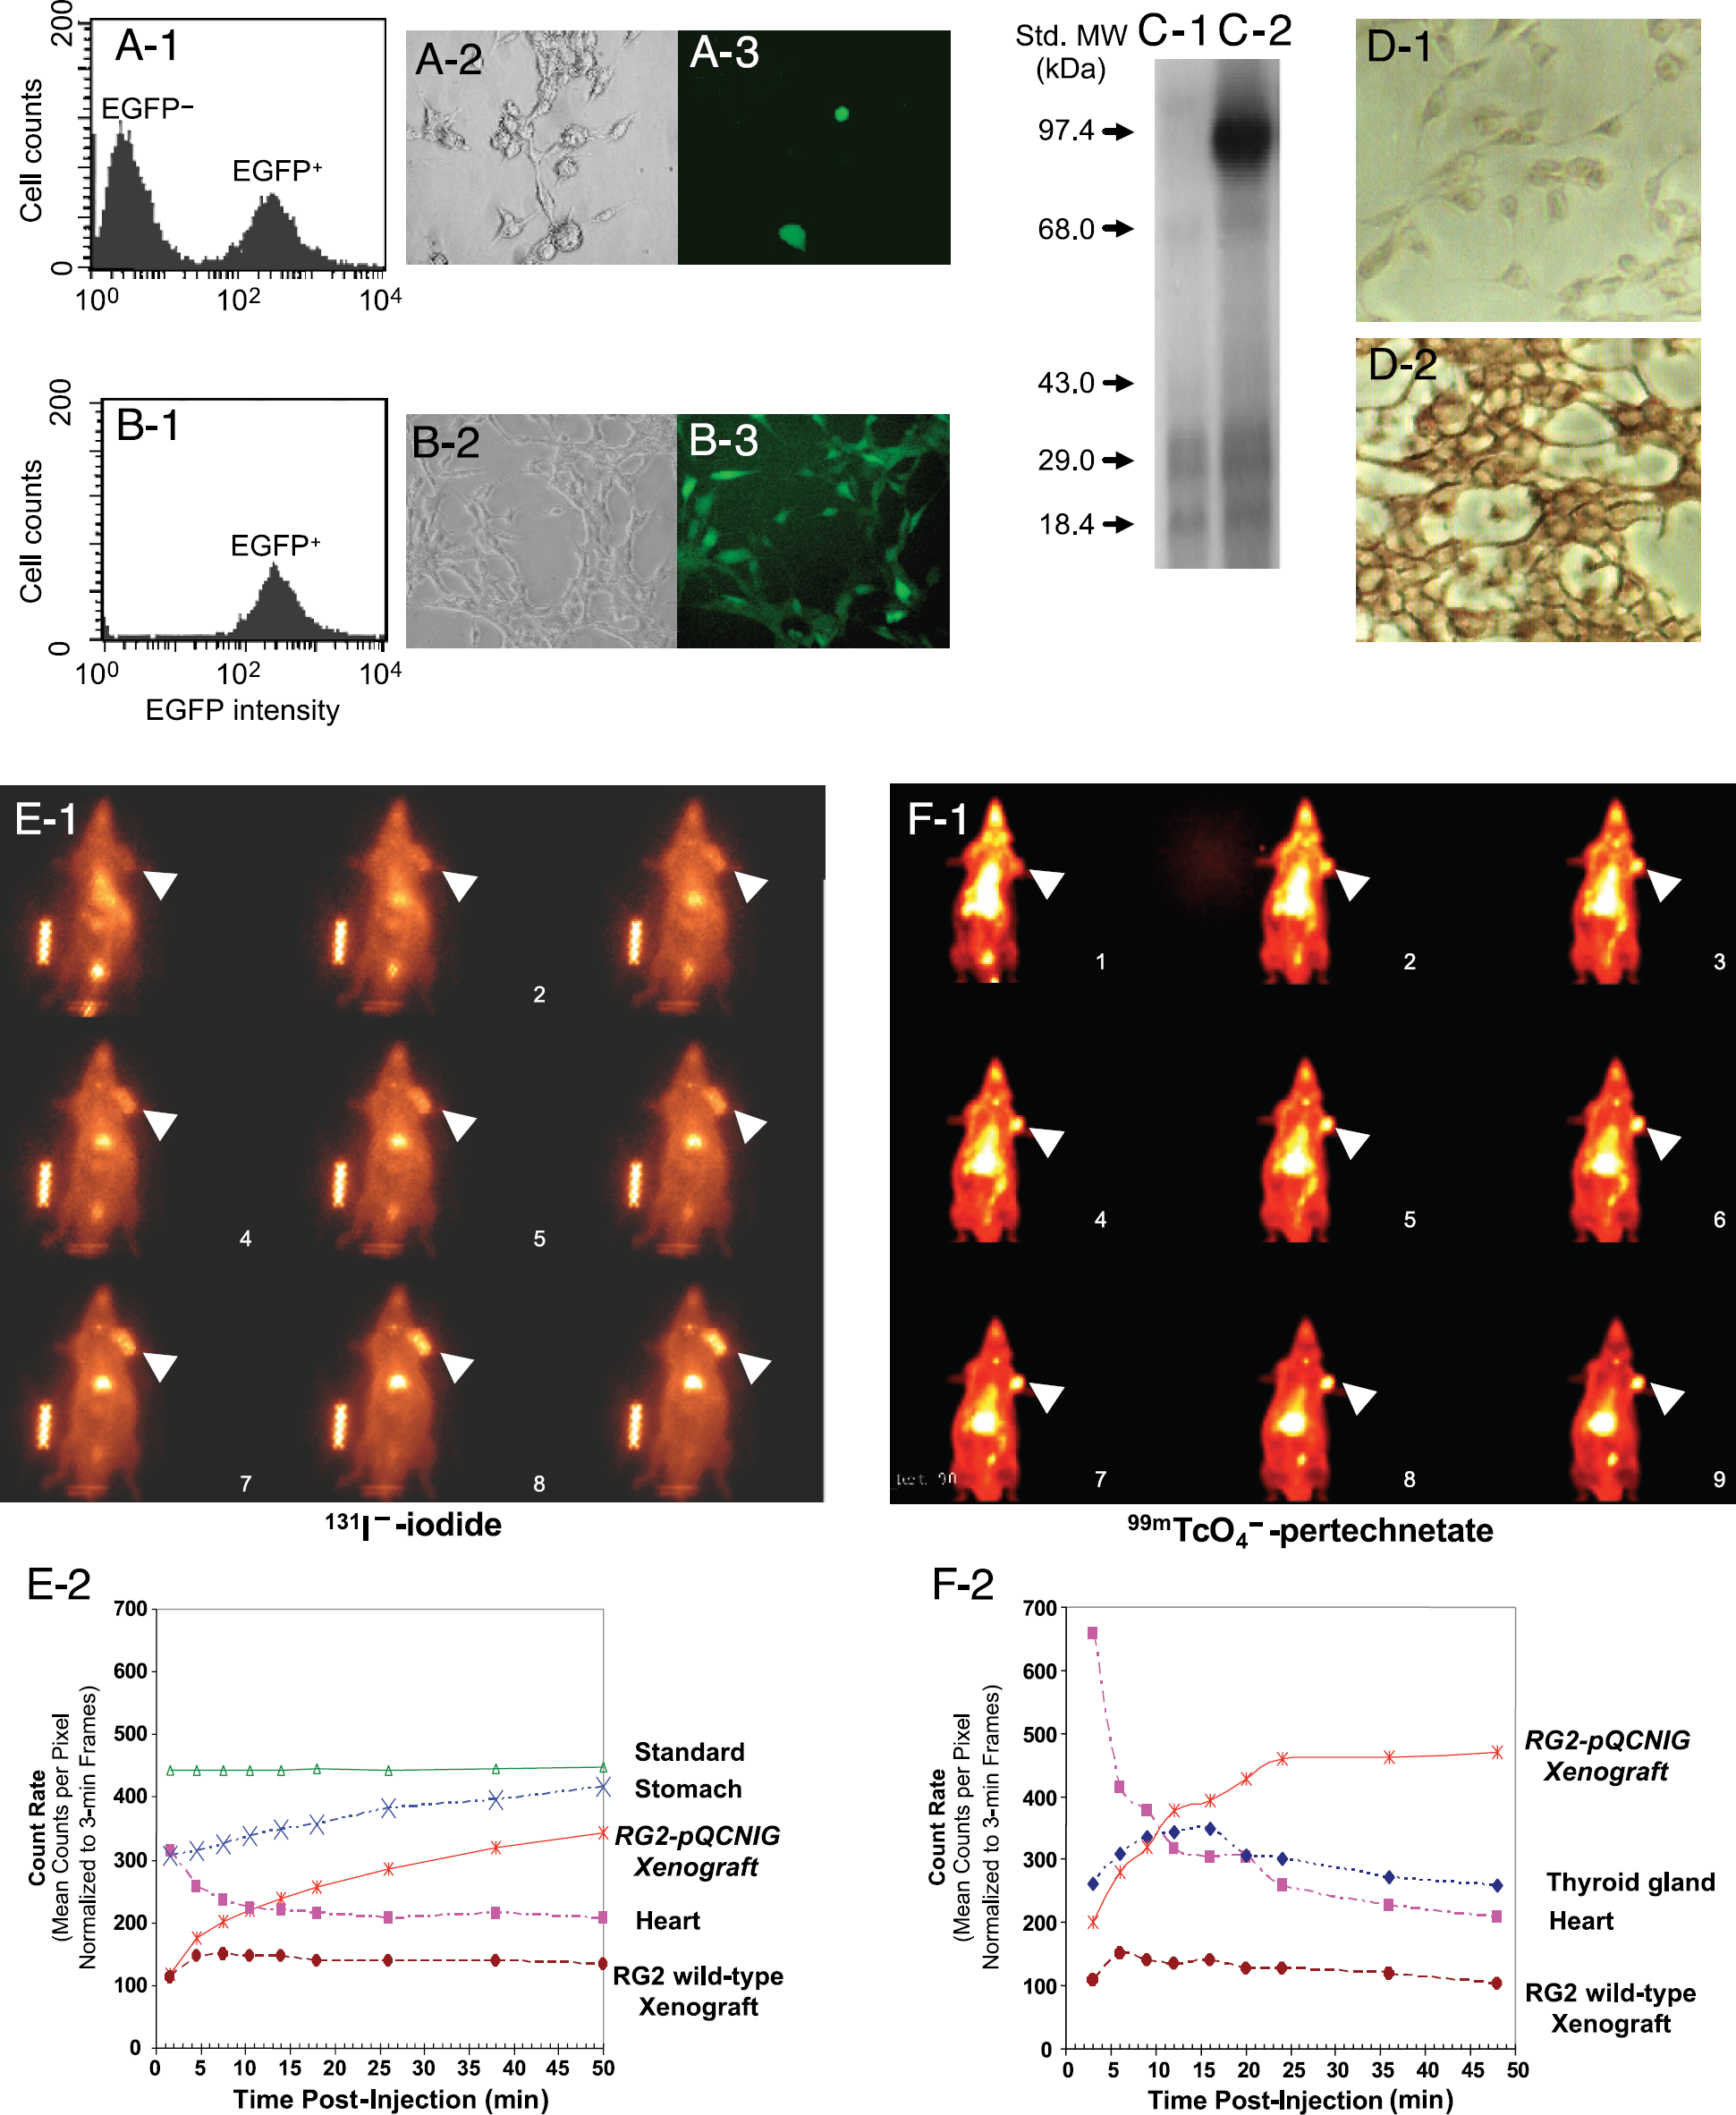
Fluorescence, immunoblot and immunocytochemical analysis. (A-1) Histogram of eGFP fluorescence of transduced RG2 cells before sorting. Note the existence of both eGFP– and eGFP+ cells. (A-2) Phase contrast image shows the cells before sorting. (A-3) Fluorescent image shows the eGFP+ cells in the same region of A-2 before sorting. (B-1) Histogram of eGFP fluorescence of the RG2-pQCNIG cells immediately after sorting. Note the existence of eGFP+ cells only. (B-2) Phase contrast image shows the cells after sorting. (B-3) Fluorescent image shows the eGFP+ cells in the same region of B-2 after sorting. (C) Western blot analysis of hNIS in the membranes of wild-type RG2 (lane 1) and RG2-pQCNIG cells (lane 2). (D) Immunocytochemical analysis of hNIS in wild-type RG2 cells (D-1) and RG2-pQCNIG cells (D-2). Dynamic gamma camera images. 131I-Iodide and 99mTcO4– pertechnetate accumulation in RG2-pQCNIG and RG2 wild-type tumors and different organs of the body (A and C, respectively). Arrows identify the RG2-pQCNIG tumor in each image (the wild-type RG2 tumor is located in the opposite left shoulder). Images 1–9 correspond to the nine postinjection times shown in the time-activity plots (B and D). It should also be noted that two different animals are shown in A and C; the RG2-pQCNIG tumor in C was one-fifth the volume of that shown in A.
RG2-pQCNIG cells were selected using FACS based on eGFP expression. Following FACS sorting, >95% of cells were eGFP+ (Figure 2B-1). Most of the cells appeared healthy and were easily visualized by fluorescence microscopy (Figure 2B-3). To determine if the cells were capable of further growth, they were plated and cultured for expansion. A continuous high level of eGFP expression has been observed for more than 18 months.
hNIS Protein Expression in RG2-pQCNIHG Cells
RG2-pQCNIG cells, following FACS selection, were positive for hNIS protein expression, whereas RG2 wild-type cells were negative for symporter expression (Figure 2C and D). The cellular membrane fraction of RG2-pQCNIG cells demonstrated hNIS expression by Western blot analysis (Figure 2C). The majority of hNIS proteins were detected in the 90-kDa range using a mouse monoclonal antibody that recognizes amino acids 468–643 of hNIS (C-terminus). The localization of hNIS protein in RG2-pQCNIG cells was also assessed by immunocytochemical analysis (Figure 2D). Strong plasma membrane-associated hNIS-specific immunoreactivity was visualized in transduced cells, and weak intracellular staining was also observed. Only background levels of staining were observed in wild-type RG2 cells stained with hNIS antibody.
131I-Iodide and 99mTc-Pertechnetate Uptake in RG2-pQCNIG Cells
The accumulation of 131I– and 99mTcO4– radioactivity in RG2-pQCNIG cells was rapid; high tracer levels were reached in 10 min (Figure 3A and B, respectively). Cellular levels of radioiodide in RG2-pQCNIG cells were 40- to 50-fold above medium concentration, and pertechnetate values were 130- to 160-fold above that in the medium. The cell-to-medium uptake ratio was close to 1 in wild-type RG2 cells for both iodide and pertechnetate. Efflux of 131I– and 99mTcO4– from RG2-pQCNIG cells occurred after 10 min and there was a readjustment of uptake levels that stabilized at ~80% of the maximal value between 40 and 120 min.
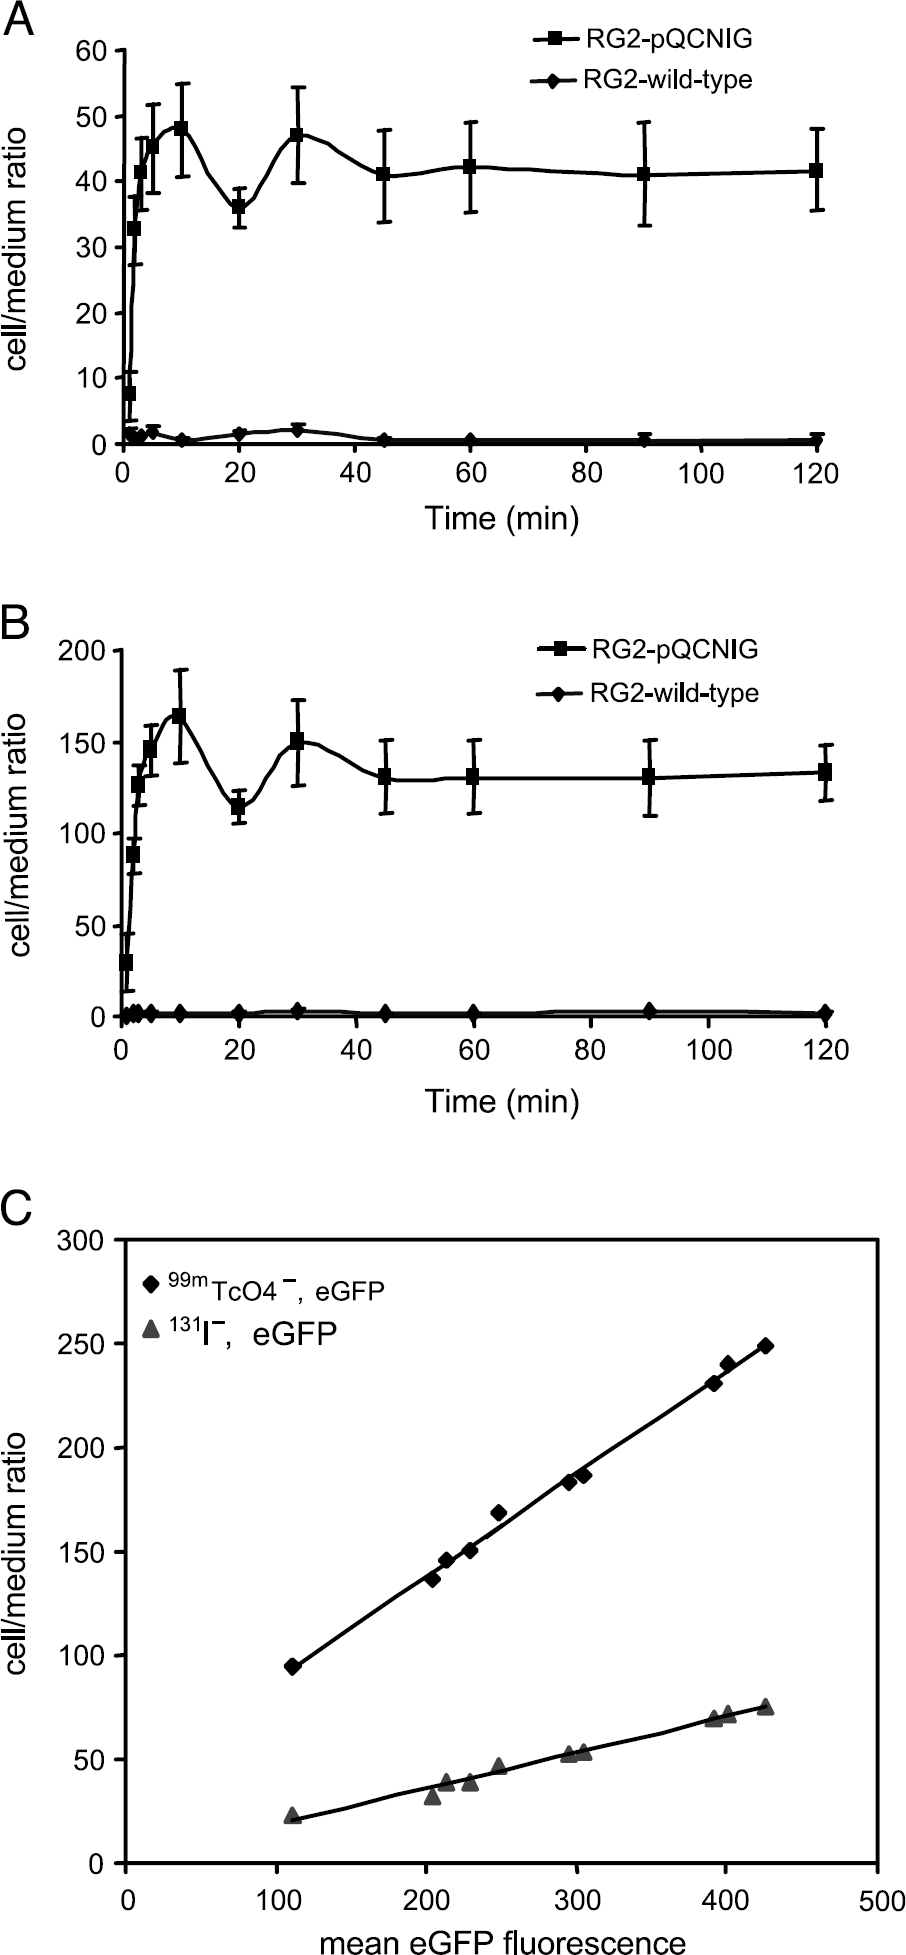
Kinetics of iodide and pertechnetate uptake in wild-type RG2 and RG2-pQCNIS cells. (A) Cell/medium ratio of 131I-iodide. B) Cell/medium ratio of 99mTcO4– pertechnetate. Values are the mean ± SD (n = 6; units are dpm/g cell ÷ dpm/mL medium). Relationship between radiotracer uptake and eGFP fluorescence. (C) Different clones (n = 10) of RG2-pQCNIG cells were compared. The 131I-iodide (▴) and 99mTcO4– pertechnetate (♦) cell/medium radioactivity concentration ratio versus mean eGFP fluorescence is plotted. For 131I-iodide, the regression equation was y = 0.024× + 0.89, R2 = .888; for 99mTcO4– pertechnetate, the regression equation was y = 0.066× + 4.6, R2 = 0.943.
Correspondence of Radiotracer Uptake and eGFP Fluorescence in Different RG2-pQCNIG Clones
The correspondence between radiotracer accumulation and fluorescence for the two reporter genes, hNIS and eGFP, was assessed in tissue culture assays. Ten different RG2-pQCNIG clones, expressing a wide range of reporter protein levels, were selected based on FACS analysis and used for radiotracer uptake experiments. The relationship between radiotracer (131I– and 99mTcO4–) accumulation and eGFP fluorescence was linear over a broad range (Figure 3C).
Gamma Camera Imaging of Radiotracer Accumulation in RG2-pQCNIG Tumors
Sequential gamma camera images of Na 131I (Figure 2E-1) and 99mTcO4– (Figure 2F-1) accumulation in RG2-pQCNIG and RG2 wild-type tumors were obtained at different times in two different sets of animals (n = 6 animals per set). The images from representative animals are shown in Figure 2E-1 and F-1. ROI radioactivity measurements corresponding to different organs visualized in these images were also obtained (Figure 2E-2 and F-2). As visualized in the images and demonstrated in the time-activity curves, there was a clear difference between RG2-pQCNIG and RG2 tumor accumulation of 131I– and 99mTcO4–. The stomach accumulated the highest levels of radioactivity. It should be noted that the RG2-pQCNIG tumors and stomach continued to accumulate radioactivity, whereas radioactivity levels in the RG2 wild-type tumors decreased and paralleled that obtained over the heart.
Discussion
In this study, we constructed a self-inactivating retroviral vector that mediates the constitutive expression of two reporter proteins, hNIS and eGFP. The rationale for developing this vector was to obtain both an optical (fluorescence) and radiotracer (nuclear) imaging readout of reporter expression. Both reporter genes are under the transcriptional control of a single promoter (CMV) within a bicistronic unit that includes a type II internal ribosomal entry site (IRES). The immediate-early promoter of CMV is a strong promoter for enhancing the expression of transgenes in eukaryotic cells, and it was used in this construct [34]. The IRES element enables translation initiation within the bicistronic mRNA, thus permitting gene coexpression by cap-dependent translation of the first cistron and cap-independent, IRES-mediated translation of the second cistron [35]. We used a type II IRES element from the 5′ untranslated region of encephalomyocarditis virus (EMCV) because of its apparent lack of tissue specificity relative to other IRES types [36]. We previously showed that the expression and imaging of HSV1-tk can be used to monitor the expression of a second gene under the transcriptional control of a single promoter within a bicistronic unit similar to that described above [37]. The presence of hNIS protein in transduced RG2-pQCNIG cells was confirmed by Western blot analysis and immunocytochemistry; eGFP expression was confirmed by FACS and fluorescence microscopy. eGFP expression in transduced cells is stable both in vitro and in vivo, and long-term dynamics of eGFP-positive cell fractions in a mixed population can be used to monitor the biological effects of a transduced gene. Selection of cells with the highest eGFP fluorescence by FACS sorting can enrich the population. Thus, eGFP provides a useful marker for gene transfer by retroviral vectors and extends the range of applications for retroviral transduction.
The dual reporter facilitates comparative, multimodality studies in vitro and in vivo. We show that following retroviral transduction and FACS selection of transduced RG2-pQCNIG cells, high levels of iodide and pertechnetate uptake and eGFP expression are achieved in comparison to wild-type RG2 cells. We also show that a tightly coupled relationship between radiotracer accumulation and mean eGFP fluorescence is maintained over a wide range of expressions levels in different RG2-pQCNIG subclones. The relationship between radiotracer accumulation and eGFP fluorescence was of potential concern because the retroviral insertion site in the genome could affect transgene expression levels in the cells [38]. Insertion of the transgene into a region of low transcriptional activity may result in decreased expression and/or transcript stability. Indeed, we found a range of expression levels in different subclones of RG2-pQCNIG cells, although this could also reflect, in part, the number of transgenes inserted into the cell genome. Nevertheless, we found a constant relationship between radiotracer accumulation and eGFP fluorescence intensity over a broad range of expression levels. Our data indicate that the pQCNIG vector can transduce RG2 cells with relatively high efficiency, and following FACS sorting and selection, a stable culture of RG2-pQCNIG cells can be obtained that maintains a high expression of the hNIS and eGFP transgenes over a long period (> 18 months).
The eGFP component of the reporter provides a fluorescence readout and the opportunity for cell-based in vitro imaging, FACS analysis and sorting of transduced cells, in situ eGFP imaging in postmortem tissue sections as well as noninvasive fluorescence imaging in living animals. The use of cell-based fluorescence imaging is well established and is widely used (see recent reviews [39,40]). More recent interest has extended to the development of whole-body transcutaneous fluorescence imaging for imaging reporter gene expression in small living animals [41,42]. Our applications have included cost-effective in vitro assays to validate the function and sensitivity of specific-inducible reporter systems, including the localization of transduced cells and/or the expression of inducible reporter systems (e.g., expression of p53) in tissue sections at the microscopic level by in situ fluorescence imaging [43,44].
Pertechnetate accumulation was higher than iodide in RG2-pQCNIG cells in culture and in animals bearing RG2-pQCNIG tumors. These results are similar to that reported by Van Sande et al. [13], who showed similar kinetic profiles for the accumulation of three different anions (pertechnetate, perrhenate, and iodide) in FRTL5 cells, which exhibit similar transport properties as thyroid cells, and in hNIS-transduced COS-6 cells. The magnitude of uptake in the two cell lines was: perrhenate > pertechnetate > iodide. In contrast, a recent study by Kang et al. [14] reports the opposite order of radiotracer uptake (iodide > pertechnetate > perrhenate). The differences between the studies of Kang et al. [14], Van Sande et al. [13], and that reported here do not appear to be due to differences in specific activity of the tracers. It should be noted that our study involved dual-isotope, paired uptake studies in the same cells.
The potential for using hNIS as a reporter gene in human studies is well recognized. Constitutive reporter gene expression provides a valuable tool for noninvasive, repetitive imaging to monitor somatic gene transfer and gene transfer vectors. It is now possible to assess the location, magnitude, and duration of transgene expression [45–47]. Similarly, it is now possible to monitor the trafficking, localization, proliferation, and clearance of adoptively transferred cells [48]. In addition, it is now possible to assess for endogenous transcription factors and the activity of specific signaling pathways based on the level of reporter gene expression. This is accomplished by using inducible promoters that are activated by specific transcription factors to regulate the level of reporter gene expression [43,44].
The advantages of hNIS as a reporter gene in patient studies include the following. First, it is a human gene and the gene product should not activate an immune reaction. Second, endogenous hNIS expression is limited to specific tissue (largely thyroid, stomach, and to a lesser degree others mentioned above). Third, several radiotracers already approved for clinical use are available for both gamma camera (123I–, 131I–, 99mTcO4–) and PET (124I–) imaging studies. Fourth, the hNIS reporter can be coupled with other reporters for combined constitutive and inducible multireporter assays. Disadvantages of hNIS as a reporter gene include the endogenous hNIS expression in stomach, thyroid, and other tissues, which could limit the sensitivity and specificity of reporter assays in these and adjacent tissues; the rapid clearance/washout of iodide and pertechnetate from hNIS-expressing cells and tissue as medium and blood levels fall; and the lack of a drug-induced suicide gene potential. Despite these limitations, it is likely that hNIS will become an important and widely used reporter gene in future human study.
Footnotes
Acknowledgments
This work was supported by NIH grants P50 CA86438, R24 CA83084, and PO1 CA59350 and DOE grant FG03-86ER60407. We thank Steven Larson (Memorial Sloan-Kettering Cancer Center) for his help and generous support.