
Abstract
Radiolabeled annexin V may provide an early indication of the success or failure of anticancer therapy on a patient-by-patient basis as an in vivo marker of tumor cell killing. An important question that remains is when, after initiation of treatment, should annexin V imaging be performed. To address this issue, we obtained simultaneous in vivo measurements of tumor burden and uptake of radiolabeled annexin V in the syngeneic orthotopic murine BCL1 lymphoma model using in vivo bioluminescence imaging (BLI) and small animal single-photon emission computed tomography (SPECT). BCL1 cells labeled for fluorescence and bioluminescence assays (BCL1−gfp/luc) were injected into mice at a dose that leads to progressive disease within two to three weeks. Tumor response was followed by BLI and SPECT before and after treatment with a single dose of 10 mg/kg doxorubicin. Biodistribution analyses revealed a biphasic increase of annexin V uptake within the tumor-bearing tissues of mice. An early peak occurring before actual tumor cells loss was observed between 1 and 5 hr after treatment, and a second longer sustained rise from 9 to 24 hr after therapy, which heralds the onset of tumor cell loss as confirmed by BLI. Multimodality imaging revealed the temporal patterns of tumor cell loss and annexin V uptake revealing a better understanding of the timing of radiolabeled annexin V uptake for its development as a marker of therapeutic efficacy.
Introduction
Tumors are genetically and metabolically diverse and can be resistant to the cytotoxic effect of any single or combination of anticancer drugs. Cytotoxic therapy has the potential to cause severe and irreversible side effects, including death, and ineffective therapy negatively impacts the patient's survival. Early and definitive assessment of the efficacy of a specific anticancer therapy would greatly enhance the quality of life of these patients as well as improve overall disease management. However, the early prediction of therapeutic efficacy has been difficult due to the lack of generally applicable, early markers of therapeutic response. At present, success of chemotherapy is measured by gross evaluation of changes in tumor size after weeks of treatment, during which time a nonresponding tumor may continue to grow while the patient unnecessarily suffers from the side effects of chemotherapy. Serial biopsies in breast cancer patients have suggested that the response to therapy correlates with early posttreatment increases of the tumor apoptotic index (percent of apoptotic cells determined by TUNEL assay) after a single dose of chemotherapy [1,2]. Because performing TUNEL, or other assays, on biopsies is not practical and in vivo TUNEL assays are not possible, in vivo imaging with radiolabeled annexin V as an in vivo marker of cell death [3] may be of value as an early noninvasive measure of chemotherapeutic response [4–8].
The first clinical imaging study to use 99mTc-annexin V was performed by Belhocine et al. [9] in a population of 15 patients with lymphoma, metastatic breast carcinoma, or lung carcinoma undergoing primary chemotherapy. This study showed that serial annexin V imaging to assess a cancer patient's response to treatment was possible and safe [9]. Increased tumor uptake of 99mTc-annexin V was observed within the first 3 days after initiation of chemotherapy in 7 of the 15 patients entered in the study. The enhanced 99mTc-annexin V uptake in these patients ranged from 50% to 200% as compared to baseline scans. All of the subjects who demonstrated increased uptake showed an objective clinical response weeks to months later. Six out of the 8 patients without increased annexin V uptake showed no response to treatment and died within 6 months. The only two subjects with breast cancer in the study showed complete and partial response to Taxol, despite the lack of significant uptake of annexin V after chemotherapy. It is possible that breast cancer patients respond to Taxol with different rates of cell loss or different peak times of annexin V uptake compared with other tumors and treatment protocols in the study.
In our study we sought to better define the dynamics of annexin V uptake and tumor cell loss early after initiation of treatment using the syngeneic murine lymphoma model, BCL1. The BCL1 lymphoma was genetically engineered to express firefly luciferase (luc) and green fluorescent protein (gfp) as a fusion protein (BCL1gfp/luc [10,11]) to enable selection of transduced cells via flow cytometry and to directly visualize tumor growth and response to therapy in this orthotopic model using in vivo bioluminescence imaging (BLI) [12]. In the previous study, flow cytometry was used to demonstrate that BLI is an extremely accurate indicator of tumor burden in this model of lymphoma for measurements in spleen and liver [10].
After therapy, small-animal single-photon emission computed tomography (SPECT) was used to image 99mTc-annexin V uptake intravenous administration of the tracer. A biphasic temporal distribution of annexin V uptake was observed in this model: a narrow peak shortly after the initiation of therapy and prior to significant loss of tumor cell signal and a later peak that correlated with the acute phase of tumor cell death as observed by BLI. This multimodality approach enabled us to assess tumor growth and response to therapy sequentially, and revealed that 99mTc-annexin V imaging could be a sensitive early measure of tumor response to chemotherapy when performed at the appropriate time after its initiation.
Materials and Methods
Animals
Female BALB/c mice were obtained from the breeding facility of the Department of Comparative Medicine, Stanford University. All mice were used between 6 and 12 weeks of age. Care of all experimental animals was in accordance with institutional guidelines and approved protocols.
BCL1 Lymphoma
BCL1 lymphoma cells (kindly provided by Samuel Strober, Stanford University) were modified to stably express luciferase and GFP by retroviral transduction as described [10]. Orthotopic tumors were initiated in 6–9-week-old BALB/c mice by injection of 5 × 10³ BCL1 gfp/luc tumor cells intravenously. Mice were monitored for tumor burden by BLI.
In Vivo Bioluminescence Imaging
Mice were anaesthetized with ketamine (100 mg/kg i.p.) (Fort Dodge, IA) and xylazine (10 mg/kg i.p.) (Butler, Columbus, OH) and an aqueous solution of luciferin (150 mg/kg i.p.) (Xenogen, Alameda, CA) was injected 15 min prior to imaging. Animals were placed into the light tight chamber of the imaging system (IVIS, Xenogen) and imaged as previously described [10]. Integration times were adjusted for tumor burden and are indicated in the figures. Data are reported as counts per unit integration time; variables on the imaging system that would affect light collection, other than integration time, were not changed from image to image to ensure that the temporal image data were internally consistent.
Doxorubicin Treatment
BLI enabled us to assess tumor burden prior to treatment such that the drug studies could be initiated using animals that displayed consistent signal intensity matched for tumor burden. Mice with matched BLI signals were treated with doxorubicin (HCl injection, USP from GenasiaSicor Pharmaceuticals, Irvine, CA) at a dose of 10 mg/kg i.p. Percent signal reduction following chemotherapy was calculated according to the formula: % initial tumor burden = [posttreatment signal intensity – background signal intensity] × 100/[signal intensity immediately prior to treatment – background signal intensity]. Background signal was determined by imaging five BALB/c animals, matched for sex and age that were tumor free.
In Vitro Toxicity Assay
BCL1−gfp/luc cells were thawed and cultured overnight in cRPMI in flat-bottom 96-well plates at a density of 5000 cells/well. The following day, doxorubicin was added at the indicated concentrations. Triplicate samples were plated for each condition. Measurements of cell metabolic state and viability were determined by adding luciferin and measuring luciferase activity in a live cell assay (expressed as photons per second).
Annexin V Labeling
Recombinant human mutant annexin V-117 was produced and purified as described [13]- This protein contains a built-in site for technetium labeling at the N-terminus. Tin/glucoheptonate reagent was prepared as a lyophilized powder stored under argon; each vial contained 5 mg sodium glucoheptonate, 128 μg sodium gentisate, and 128 μg SnCl2·2H2O. Fifty to 100 μL 99mTcO4 (5–20 mCi) in deoxygenated 0.9% NaCl was added to 2.5–5 μL of tin/glucoheptonate reagent immediately followed by the addition of 50 μL protein. After 60 min incubation at room temperature, the reaction product was purified by gel filtration on a Sephadex G-25 column (PD-10 column, Pharmacia, Piscataway, NJ) equilibrated and eluted with phosphate-buffered saline, pH 7.4. This procedure routinely provided 88–94% incorporation of 99mTcO4, corresponding to specific activity of 50–200 μCi/μg.
Biodistribution of 99mTc-Annexin V in Tumor-bearing and Control Mice
Matched tumor-bearing mice were treated with 10 mg/kg doxorubicin and 0.5 to 1.0 mCi of radiolabeled annexin V was injected via the tail vein 1 hr before each time point to allow identical times of circulation of the tracer. At each indicated time point (post initiation of chemotherapy), mice were sacrificed and organs were harvested, weighed, and counted using a Packard Cobra II gamma counter (Packard Instrument, Meriden, CT) and a technetium-99m energy window (a lower level of 120 keV and an upper level of 170). Standards of 1% of injected activity (1 mL of a 100-mL dilution of injected dose) were prepared and counted along with each subgroup of animals. Data were recorded as %-injected dose per organ (ID/organ), and the % ID/gram of tissue corrected for background and radioactive decay.
Autoradiographs
At 1 hr after injection of 1 to 2 mCi of radiolabeled annexin V, mice were sacrificed and their spleens were immediately harvested. Coronal frozen sections (60 μm thickness) were prepared with a cryostat and placed on phosphor storage screen for 24 hr (Phosphoimager: SI system, Molecular Dynamics, Mountain View, CA). After exposure, the phosphor screen images were read out with a laser digitizer at a resolution of 50 μm per pixel. ROI analysis of radiotracer activity was performed using Image Quant Software version 5.1 (Molecular Dynamics).
Small-animal SPECT
SPECT images were obtained with the LumaGEM™ system (Gamma Medical Instruments, Los Angeles, CA) using a 1-mm pinhole collimator, 64 × 64 imaging matrix for the projection data (and 643 for the reconstructed data), 30 sec per step, 3° per step, for a 360° rotation (scan time = 60 min per exam). Animals received 1 to 2 mCi of 99mTc-labeled annexin V (5–10 μg per mouse of protein intravenously), 1 hr prior to acquisition of the SPECT. The studies were reconstructed and 0.6-mm-thick slices in the axial, frontal, and sagittal planes centered on the spleen were obtained in control as well as in doxorubicin-treated mice.
Statistical Methods
Statistical analyses were performed using paired Student's t test as indicated in the figures.
Results
The response of the BCL1 lymphoma to doxorubicin was first assessed in culture using luciferase activity as a measure of cell metabolic activity and viability. Because the luciferase reaction is ATP dependent, the measured bioluminescence is a direct reflection of cell metabolism and viability. BCL1gfp/luc cells were exposed to different doses of doxorubicin. The bioluminescent signals from BCL1−gfp/luc cells began to decrease at 9 hr posttreatment at the highest doses of doxorubicin (75–200 ng/mL) (Figure 1). Lower doses of doxorubicin led to loss of signal in a time- and dose-dependent manner, showing evidence of significant cell death at 48 hr posttreatment over the entire range. Signal intensity in untreated cultures remained the same over the course of 48 hr since BCL1gfp/luc cells do not proliferate in culture, and only grow in vivo [14]. At higher doses (μg/mL), BCL1gfp/luc cells die as soon as 5 hr posttreatment (data not shown). These data demonstrated that the time of cell death following exposure to doxorubicin in culture is highly dose dependent. Although chemotherapy is usually given at highest tolerable doses, it is difficult to predict the exact concentration of a drug within the tumor in vivo, which can vary depending on factors such as tissue site, tumor size, and vascularity [15].
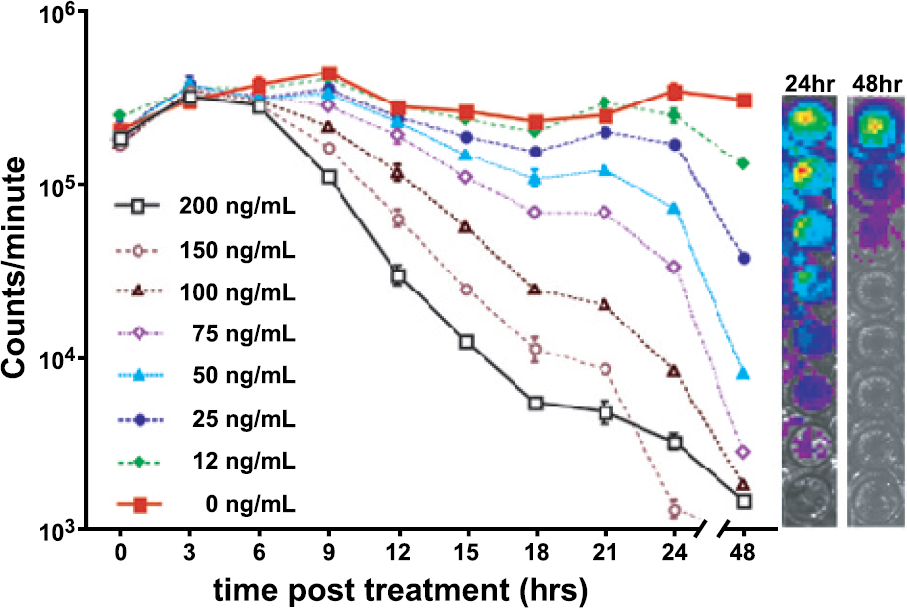
Bioluminescent measurement of cellular response to doxorubicin. Cells were plated in 96-well plates and the time course of tumor cell response was assessed by measuring the bioluminescent signal from cultures treated with doxorubicin at the indicated concentrations. On the right are two examples of bioluminescent signals from treated cell cultures imaged at 24 and 48 hr after addition of the drug.

Evaluation of tumor regression post doxorubicin treatment by serial BLI. (A) Representative example of tumor regression in a single mouse over 4 days. (B) Quantitation of tumor regression as measured by BU: n = 4 in each group. Small insert: correlation between tumor burden measured by BLI and spleen weight (g) (r = .854 as calculated by the formula shown in insert).
The in vivo response of BCL1gfp/luc tumor cells, following exposure to doxorubicin, was measured in tumor-bearing mice via BLI. The small insert in Figure 2B demonstrates the linear correlation found between tumor burden as measured by spleen weight (g) and signal intensity (counts/sec) by BLI (r = .854). In this dataset, there was a single outlier data point, at a spleen weight of 0.543 g, which when removed dramatically improved the correlation (r = .945). In another study of this model where tumor burden was measured by flow cytometry and BLI, the correlation between these two measurements was excellent (r = .98) [10]. Mice were imaged immediately before chemotherapy (10 mg/kg doxorubicin) to assess the initial tumor burden, and then at selected time points thereafter as indicated in Figure 2 to reveal response to treatment. Control tumor-bearing animals that did not receive chemotherapy were imaged along with treated animals. Independent of the initial tumor burden, detectable loss of bioluminescent signal was observed first between 10 and 16 hr posttreatment in vivo with massive tumor cell loss within 24 hr (20% and 10% initial tumor burden at 24 and 32 hr posttreatment, respectively) and complete loss of tumor signal within 4 days (Figure 2B). The signal in untreated animals increased over the duration of the study indicating continued cell growth in vivo.
To identify the time of peak annexin V uptake into the tumor after therapy, we measured the tissue distribution of 99mTc-annexinV at different times posttreatment or in untreated tumor-bearing and naive mice. Mice treated with a single injection of doxorubicin (10 mg/kg i.p.) showed a biphasic increase of annexin V uptake defined by an early peak between 1 and 5 hr after treatment, and a second longer sustained rise from 9 to 24 hr after therapy (Figure 3). Both the early peak and the later increase showed about twice the annexin uptake seen in controls (untreated tumor-bearing and naive mice) and were statistically significant with p < .01 in comparison to naive mice. The annexin V uptake did not occur in a gradually increasing manner, and it became insignificant at 48 hr (p < .19), although tumor eradication was not complete at that time (see Figure 2). This might reflect the rapid clearance of cells with an inversion of phosphatidyl serine (PS) by macrophages [16] and stresses the importance of early annexin V imaging before tumor cell death and clearance of PS expressing cells by macrophages.

Time course of 99m-annexin V biodistribution following doxorubicin treatment. Mice were treated with doxorubicin for the indicated time. One hour before each time point 99m-annexin V was injected intravenously. Indicated organs were removed and level of annexin uptake was measured by scintillation counting in gamma counter. Controls are tumor-bearing mice that did not receive doxorubicin (0 hr) and tumor-free animals (naïve). The indicated p values were obtained by comparing each time point with the annexin uptake in naïve mice using paired t-test analysis and values are as follows. Significant differences were observed at 1 hr (p < .012) and 9 hr through 24 hr. The p values for this time range were: 9 hr: p < .001; 12 hr: p < .006; 15 hr: p < .004; 18 hr: p < .004; 20 hr: p < .0001; 22 hr: p < .015; 24 hr: p < .002 There were no differences observed at the time of treatment (p < .444) or at the following times posttreatment: 3 hr (p < .966), 5 hr (p < .269), 7 hr (p < .506) or 48 hr (p < .187). Annexin uptake was not dependent on tumor size.

99mTc-annexin V uptake as seen by SPECT and autoradiography. Left: BLI left lateral image of a tumor-bearing mouse; Middle: sagittal small-animal SPECT image from the corresponding mouse; Right: autoradiographs of a representative frozen section of diseased spleen from the corresponding mouse. (A) Control, tumor-bearing animal that was left untreated. (B) Tumor-bearing animal 5 hr post doxorubicin treatment. (C) Tumor-bearing animal 20 hr post doxorubicin treatment. Movies of 3-D SPECT data are available online (See http://sci3.stanford.edu/lab/annexinv.html).
To assess the potential of 99mTc-annexin V as an imaging agent for the noninvasive assessment of treatment-induced cell death in vivo, we performed small-animal SPECT in naive controls as well as in doxorubicin-treated and untreated tumor-bearing mice. High uptake was observed in the kidneys and in the liver as a result of the renal-hepatic clearance of the tracer [17,18]. This, however, did not interfere with the detection of increased uptake of 99mTc-annexin V in dying lymphoma cells within the spleen. Tracer uptake was clearly seen in the spleen at 5 hr (the early peak in this experiment) and 20 hr after doxorubicin treatment (Figure 4B and C, middle panel). No significant uptake was observed in either untreated tumor-bearing mice (Figure 4A) or tumor-free treated controls (data not shown). 99mTc-annexin V uptake by the tumoral nodules in the spleen seen in the tomographic images was also visualized in autoradiographic studies of this organ performed right after the SPECT image acquisition (Figure 4A and B, right). Additionally, we were able to detect signal from treated metastatic lesions present in the thymus (Figure 5).
Discussion
Our data suggest that annexin V uptake may be useful as an early marker of therapeutic response. However, it appears that the posttherapy timing of 99mTc-annexin V imaging may be critical. In the present study, performed in an orthotopic mouse lymphoma model after a single dose of doxorubicin, two peak time points were observed rather than a gradual increase and decrease of annexin V uptake. Importantly, both time points in our animal model were associated with a 50–300% increase in average annexin V uptake over controls; values that agree well with those observed by SPECT imaging following injection of radiolabeled annexin V in treated cancer patients [19]. The “early” peak occurred between 1 and 5 hr and was followed by a trough or nadir of activity and a second longer sustained rise in annexin V uptake in treated tumors manifesting from 9 to 24 hr, both in the spleen and thymus. These results not only demonstrate the importance of timing but also demonstrate that the increase of annexin V uptake into the tumor is not simply cumulative. The early peak of annexin V uptake, however, was variable and occurred at several different time points within a range (between 1 and 5 hr) in repeated experiments. One intriguing possible cause for the early peak is the apoptosis of tumor endothelial/vascular smooth muscles cells; a process that necessarily precedes the loss of actual tumor cells following treatment with a variety of chemotherapeutic agents including doxorubicin [20,21]. As only tumor cells express luciferase in our model, one would not expect to see a decrease in tumor burden by BLI as the tumor vasculature involutes prior to the loss of tumor cells some 5 to 12 hr later.

Metastatic lesions present in the thymus as detected by BLI and 99mTc-annexin V imaging. (A) Thymic signal as it appears in BLI obtained in the frontal plain and the corresponding parasagittal, left anterior oblique, small-animal SPECT image 5 hr after administration of 10 mg/kg of doxorubicin i.p. Black bars represent the “coned down” area from the BLI image as mapped onto the SPECT image. (B) Quantitation of 99cTc-annexin V uptake by scintillation counting of removed thymic tissue. Controls = tumor-free animals 5 hr after treatment with 10 mg/kg of doxorubicin. Doxorubicin-treated (5 hr after i.p. injection of 10 mg/kg) tumor-bearing animals were grouped judged by detectable BLI signal in the thymic area. Legend for SPECT movies (online only): Small-animal SPECT images were obtained with the LumaGEM system (Gamma Medical Instruments, Los Angeles, CA) using a 1-mm pinhole collimator, 64 by 64 imaging matrix for the projection data (and 643 for the reconstructed data), 30 sec/step, 3° per step, for a 360° rotation (scan time = 35 min/exam). Animals received 1 to 2 mCi of 99mTc-labeled annexin V (5–10 g/kg of protein), 1 hr prior to the start of imaging. Note the marked increase in splenic uptake of annexin V 5 hr after doxorubicin treatment as compared with the untreated tumor bearing mouse (See http://sci3.stanford.edu/lab/annexinv.html).
The observation in this study, and in others, that luciferase activity in BLI is generally a reliable marker of tumor burden [22,23], suggests that the outlying data point was simply anomalous and it does not significantly alter the dataset. Because the metabolic status of the tumor may affect the BLI signal, this tumor may have gone into metabolic crisis at a different rate than others in the study. Because luciferase activity is inextricably linked to cellular metabolism, it is conceivable that the metabolic status of a tumor can change without a change in overall volume. At very high tumor volumes (4–5 times normal spleen weight), several factors such as hypoxia or necrosis within the tumor may lead to BLI measurements that underestimate the actual tumor burden. The reason for this data point has not been fully resolved.
Chemotherapeutic drugs, such as doxorubicin, can exert their cytotoxic effects through a variety of different mechanisms (including activation of the CD95 death-signaling pathway [24], DNA intercalation, inhibition of topoisomerase II, and altered p53 expression [25]), which “hit” at different phases of the cell cycle. This may be accompanied by an early decrease in the bioluminescent signal prior to actual tumor cell loss, around the time of the early peak of PS exposure. We did not observe an early loss of BLI signal, although it is possible that the observed increase in luciferase activity early after onset of chemotherapy (see Figure 2B discussed below) could have obscured the loss of the signal originating from only a subpopulation of cells.
One last major possible explanation for these early transient increases in annexin V uptake might not be necessarily related to commitment to tumor cell or tumor vessel death but to a preapoptotic “stressing” of tumor cells causing the transient exposure of phosphatidylserine. Recent studies by us, and others, have demonstrated that reversible exposure of PS can occur upon certain stimuli and may or may not be followed by apoptosis [26–28]. The annexin V uptake at 9–24 hr postchemotherapy correlates with the acute phase of cell death observed by BLI. These data demonstrate the importance of the “right timing” when imaging chemotherapy-induced cell death in tumors with 99mTc-annexin V. The kinetics of tumor cell death may vary when considering different cancers and therapies. This might be due to factors such as tumor accessibility and the mechanism of tumor cell death, and therefore, optimal imaging times may vary for each therapeutic regimen and possibly for different tumor types.
We consistently observed an initial increase of luciferase signal early after the onset of chemotherapy (3–10 hr). The change in signal intensity observed in cell culture occurred in the presence and absence of drug and is likely due to cell growth. Because the BCL1 cells do not proliferate in culture and only grow in mice, cells are thawed just before for each experiment and the initial increase may reflect recovery to full metabolic activity. The in vivo observations cannot be similarly explained since increases were only observed in the treated groups. It is unlikely that the observed increases in bioluminescent signal were a result of an increase in tumor mass. Luciferase is an indicator of metabolism since its activity is tied to the metabolic activity of the cells that express this enzyme. Therefore, the most likely explanation for the early rise of activity is that signal increases due to metabolic changes associated with treatment; changes in membrane permeability, ATP elevation due to a stress response, degradation of membrane integrity and loss of subcellular compartmentalization, transient changes in transcription or possibly other mechanisms.
It remains to be determined whether multiple posttreatment annexin V scans will improve our assessment of therapeutic efficacy. Recent data with human lymphoma cell cultures treated with Taxol at clinically relevant drug concentrations (1–20 nM) demonstrated that the onset of apoptosis ranged from 8 hr, in wild-type tumors, up to 24 hr with mutant cell lines [19]. These results suggest that human lymphomas treated with conventional doses of chemotherapy have similar kinetics of cell loss as our murine BCL1 lymphoma model. To have the best chance of imaging chemotherapy-induced apoptosis, it appears that, at least for human lymphomas, the tracer needs to be administered during the first 6 to 12 hr after start of treatment followed by imaging 4 to 6 hr later as the clearance of tracer from the circulation is delayed by a factor of 4 to 6 in humans compared to mice. A second scan may also be necessary to detect cells with mutations that may delay the onset of apoptosis [29]. Defining the optimal imaging times using multimodality approaches that reveal temporal changes in tumor burden and relevant markers of cell death holds great potential for advancing the tools for outcome measures and understanding effective therapies. Moreover, such approaches may have the potential to improve the treatment of cancer patients by allowing early definitive assessment of the efficacy of tumor cell killing, providing the opportunity to optimize and individualize anticancer therapies.
Footnotes
Acknowledgments
We thank Bonny Bell for excellent technical assistance. These studies were funded, in part, through grants from the NIH (CA88303, CA92862, CA86312), the BioX Research Fund and Child Health Initiative at Stanford University, and unrestricted gifts from the Mary L. Johnson and Hess research funds.