
Abstract
In vivo imaging of bioluminescent reporters relies on expression of light-emitting enzymes, luciferases, and delivery of chemical substrates to expressing cells. Coelenterazine (CLZN) is the substrate for a group of bioluminescent enzymes obtained from marine organisms. At present, there are more than 10 commercially available CLZN analogs. To determine which analog is most suitable for activity measurements in live cells and living animals, we characterized 10 CLZN analogs using Renilla luciferase (Rluc) as the reporter enzyme. For each analog, we monitored enzyme activity, auto-oxidation, and efficiency of cellular uptake. All CLZN analogs tested showed higher auto-oxidation signals in serum than was observed in phosphate buffer or medium, mainly as a result of auto-oxidation by binding to albumin. CLZN-f, -h, and -e analogs showed 4- to 8-fold greater Rluc activity, relative to CLZN-native, in cells expressing the enzyme from a stable integrant. In studies using living mice expressing Rluc in hepatocytes, administration of CLZN-e and -native produced the highest signal. Furthermore, distinct temporal differences in signal for each analog were revealed following intravenous or intraperitoneal delivery. We conclude that the CLZN analogs that are presently available vary with respect to hRluc utilization in culture and in vivo, and that the effective use of CLZN-utilizing enzymes in living animals depends on the selection of an appropriate substrate.
Introduction
The use of in vivo bioluminescence imaging (BLI) for real-time measurements of biological function in living cells and animals has been described in many areas of research, including studies of infectious disease (viral, bacterial, and fungal), cancer, gene therapy, drug development, immunology, and stem cells [1–8]. Three luciferase proteins, isolated from bacteria (Lux), firefly (Photinus pyralis, Fluc), and sea pansy (Renilla reniformis, Rluc), have been used as reporters in cell-based assays and, more recently, have been employed for in vivo studies. Each of these enzymes requires a different chemical substrate for light production, and only for Lux have the enzymes for substrate biosynthesis been coexpressed in labeled cells. Therefore, for FLuc and RLuc, which have been used to label mammalian cells and fungi, the substrates need to be administered exogenously [1,9]. The use of different substrates for these luciferases allows the activities to be separated biochemically, providing the opportunity to look at separate processes in the same animal or group of animals [10,11]. FLuc and its substrate,
Rluc catalyzes the oxidative decarboxylation of CLZN, producing blue-green light with a spectral peak of 480 nm. The reaction requires only O2 [12,13], unlike Fluc, which also requires ATP as an energy source and Mg2+. Rluc has been successfully expressed in mammalian cells without any apparent signs of cytotoxicity. A modified rluc gene has been optimized for expression in mammalian cells and is commercially available (hrluc; Promega, Madison, WI). Optimization of the hrluc coding sequence included the use of codons that are preferentially used by mammals, and by eliminating any potential binding sites for mammalian transcription factors. These modifications have resulted in significantly higher levels of transcription in mammalian cells in culture. Rluc is a useful reporter protein for cell culture assays and has potential for in vivo measurements due to its unique substrate that allows for differentiation from Fluc activity as well as its lack of cofactor requirements, which offers versatility in assay development [14].

Structures of the CLZN analogs. The 10 analogs used in the study have different substitutions at two positions, R1 and R2. The core structure is shown on the top left, with the R groups listed in the table. CLZN-e differs in structure from the other analogs by the presence of an extra ring in the core structure and is shown on the top right.
In cell culture, constitutive expression of RLuc has been used as an internal control for expression studies where Fluc is used to report regulated expression patterns [15,16]. Rluc has also been used as the bioluminescent donor in bioluminescence resonance energy transfer (BRET, also known as chemiluminescent and luminescent resonance energy transfer, CRET and LRET, respectively) studies of protein-protein interactions and shift wavelength of emission [17–19]. In vivo measurements of Rluc activity were first demonstrated using tumor cells implanted subcutaneously with CLZN being injected intravenously prior to imaging. In this study, Fluc activity could be distinguished from Rluc in the same host animal by sequential injection of the appropriate substrates followed by imaging with a sensitive cooled charge-coupled device (CCD) camera [14]. Subsequently, hRluc has been used in living subjects as a split reporter gene for measuring protein-protein interactions [20].
Rluc is one of several luciferases from marine organisms that utilize CLZN to produce luminescence. Aequorin, the luciferase from the jellyfish Aequorea, requires the presence of calcium ions to catalyze the CLZN oxidation in the photoprotein complex, which has allowed the use of aequorin-CLZN as an extremely sensitive method to monitor intracellular free calcium levels [21,22]. CLZN is able to penetrate the mammalian cell membrane and diffuse throughout the cytosol [23,24], although the mechanism of membrane transport is not clear. Toxic effects of CLZN in cells has not been demonstrated; it is likely, however, that there are effects on cell physiology given its properties as an antioxident [25]. Dubuisson et al. [25] have reported that native CLZN and synthetic methyl-CLZN (CLZN-m) could protect cells from oxidative stress. Moreover, the cytotoxicity of CLZN, but not CLZN-m, was observed at concentrations more than 2 × 10⁻⁵ M (equal to 8.5 μg/mL) in rat hepatocytes [25].
The efficiency of light emission in the Rluc-CLZN system varies depending on which CLZN analog is used (Figure 1). Shimomura et al. [26] have synthesized more than 25 CLZN analogs and examined the specificity and light intensity of each analog using recombinant Rluc protein. Only two analogs (−e and −v) had higher efficiencies than that of the native substrate. CLZN-e and -v produced luminescence at intensities 7.5 and 6.4 times higher than that from native CLZN. CLZN-e showed a bimodal spectrum with peaks at 418 and 475 nm. CLZN-v showed a red-shifted spectrum with a peak at 512 nm, due to its additional conjugated double bond [27]. Longer wavelengths of emission are of interest for BLI because red light is not absorbed by mammalian tissues to the extent of shorter wavelengths (blue or green). There is a dramatic increase in light transmission through mammalian tissues above 600 nm given that blue-green light is strongly absorbed by hemoglobin [28].
In this study, we characterized 10 different CLZN analogs for their use in BLI for both cell culture and in vivo studies. Different media, routinely used to propagate mammalian cells, demonstrated different levels of auto-oxidization of CLZN analogs. In addition, we found that light output was different for different analogs in intact cells, cell lysates, and animals. In living animals, the route of CLZN administration, interperitoneal or intravenous, leads to different kinetics of light output. The reaction conditions used in live cell assays and animals to assess Rluc–CLZN bioluminescence determine the background levels and the signal intensities; therefore, optimization in a given model is necessary.
Materials and Methods
CLZN Analogs and Luciferase Expression Plasmids
Native CLZN and its semisynthetic analogs designated, -f, -h, −hcp, −fcp, −cp, −n, −i, −ip, and −e (Biotium, Hayward, CA; Figure 1) were dissolved in methanol to a concentration of 1 mg/mL for use as stock solutions, stored at −70°C, and diluted in phosphate buffer (without calcium and magnesium) immediately prior to use. A plasmid containing the humanized RLuc DNA (phRluc-CMV) was purchased from Promega. The Fluc expression construct, pcDNA-fLuc, was constructed by inserting the Fluc coding sequence (BglII/BamHI fragment of pGL3; Promega) into the BamHI sites of pcDNA 3.1 (–) (Invitrogen, Carlsbad, CA).
Generation of hRluc Reporter Stable Cell Lines
HeLa (human cervical carcinoma) and C6 (rat glioma) cells were obtained from American Type Culture Collection (ATCC, Manassas, VA) and maintained according to ATCC instructions. To generate a plasmid where Rluc was expressed similarly to Flue, a DNA fragment containing the coding sequence for hRluc was cut out of the vector phRluc-CMV using the restriction enzymes, NheI and XbaI, and cloned into NheI/XbaI-digested pCDNA3.1(–) (Invitrogen). The resulting plasmid, containing the neomycin resistance gene (neor) and hRluc behind the immediate early promoter from human cytomegalovirus (CMV), was transfected into cells using Lipofectamine 2000 (Invitrogen). Positive clones were selected in Geneticin (100 μg/mL) and identified by light emission as detected by the IVIS Model 100 (Xenogen, Alameda, CA).
Low-light imaging was performed using the IVIS, which consists of a cooled integrating CCD camera mounted on a light-tight specimen chamber (dark box), a camera controller, a camera cooling system, and controlled using a computer. Grayscale reference images were obtained with low-light illumination and bioluminescent output was then acquired in complete darkness. The data are represented as pseudocolor images of light intensity (blue—least intense, red—most intense) superimposed over the grayscale reference images. Light output from specified regions of interest (ROIs) were quantified as the total number of photons emitted per second using LivingImage (v2.12, Xenogen) and Igor imaging analysis software (v.4.02A, WaveMetrics, Lake Oswego, OR).
Cultures of positive clones were expanded over a period of 7 to 15 days. For cryostorage, the cells were prepared according to standard protocols of being slow cooled in freezing medium at - 70°C for overnight, and then were maintained in liquid nitrogen.
Measurement of Auto-Oxidation of CLZN Analogs
CLZN analogs (final concentration of 2.4 μM) were added into 50 μL of different growth media in the absence of cells onto wells of 96-well black microtiter plates (Greiner Bio-one, Germany) to prevent light reflection from well to well. Luminescent signals were measured immediately after substrate addition and monitored over a period of 30 min using the IVIS or a single tube luminometer.
Measurements of Rluc Activity in Live Cell and Cell Lysate Assays
In live cell assays, HeLa and C6 cell lines, constitutively expressing Rluc, were grown in 96-well plates with growth medium [Dulbecco's Modified Eagle's Medium (DMEM) containing 10% fetal bovine serum (FBS)]. Cells not expressing Rluc were used as controls. At 80% to 90% confluency (˜3 × 10⁴ cells/well), growth medium was replaced with phosphate-buffered saline (PBS) containing one of the CLZN analogs (to a final concentration of 2.4 μM). Bioluminescent signals were then immediately determined using the IVIS.
Cell lysates were prepared fresh for each Rluc activity measurements. Cells (1 × 10⁶) expressing Rluc were lysed in 1 mL of Passive Lysis Buffer (PLB, Promega) for 30 min at 37°C as recommended by the manufacturer. Twenty microliters of diluted lysate (1:100) were mixed with 100 μL of CLZN solution (final concentration of 1 μM) and the light intensity was measured every 10 sec for 2 min in a single tube luminometer or every 5 min for 30 min using the IVIS.
Luminometry was performed in a Sirius single tube luminometer (Berthold Detection Systems, Germany). Reaction conditions were determined by testing serial dilutions of lysate and various concentrations of CLZN. Twenty microliters of lysate were mixed with 100 μL of 1 μM CLZN and resulting light output was measured every 10 sec for 2 min and expressed as relative light units (RLU) per cell.
In Vivo Liver Transfection
FVB mice (6- to 8-week-old males) were obtained from Charles River Laboratories (Wilmington, MA) and maintained under strict adherence to Stanford University institutional guidelines. In vivo transfection of cells in mouse livers were performed using the hydrodynamic method as described previously [29,30]. Briefly, the plasmid DNA was diluted in phosphate buffer (without Mg2+, Ca2+) in a volume of 1 mL/10 g body weight (BW) and was rapidly (within 10 sec) injected into the tail veins of mice using a 3-mL syringe fitted with a 27-gauge needle. The amount of DNA injected ranged from 0.1 to 5 μg per mouse.
For measurements of light output from both reporters, a mixture of the two plasmids containing 1 μg each of Rluc and Fluc vectors was injected into mice via the tail vein. Twenty-four hours posttransfection, CLZN-native (1 mg/kg BW) was administrated intravenously and Rluc signals were measured 1 min after injection by BLI. Two to four hours later, when the Rluc signal diminished to background levels,
BLI of Rluc Activity in Mice
Twenty-two to twenty-four hours post liver transfection, mice were anesthetized by intraperitoneal injections of 100 to 150 μL 2,2,2-tribromoethanol/10 g BW (Avertin, 25 mg/mL, Aldrich Chemical, Milwaukee, WI). CLZN analogs were then administrated into anesthetized mice, intraperitoneally or intravenously, at a dose of 1 mg/kg BW just prior to BLI [2]. Light output was acquired using the IVIS for 1 to 60 sec depending on signal intensity. Following imaging, animals were kept warm and allowed to recover. Light intensity was determined from an ROI corresponding to the liver region in a ventral view of the animals and expressed as photons/sec/ROI.
Measurements of Renilla Luciferase Activity in Liver Homogenates
Liver tissue from mice that had been transfected using the phRluc-CMV plasmid, and from normal controls were collected and homogenized in PLB (0.2 g liver/mL) using Tissue Tearor (Model 985-370, Biospec Product, Bartlesville, OK). The tissue lysates were kept on ice for no more than 2 hr prior to measurements. Rluc activity was determined from a mixture of 20 μL diluted lysate (1:1000) and 100 μL of 1 μM CLZN using either a single tube luminometer or using the IVIS and was expressed as RLU/g liver tissue or photons/sec/g liver.
Statistical Analysis
Analysis of variance (ANOVA) was performed to determine the statistical significance. A p value of less than .05 was considered to be significant. Slopes of light intensity kinetics were calculated by linear regression.
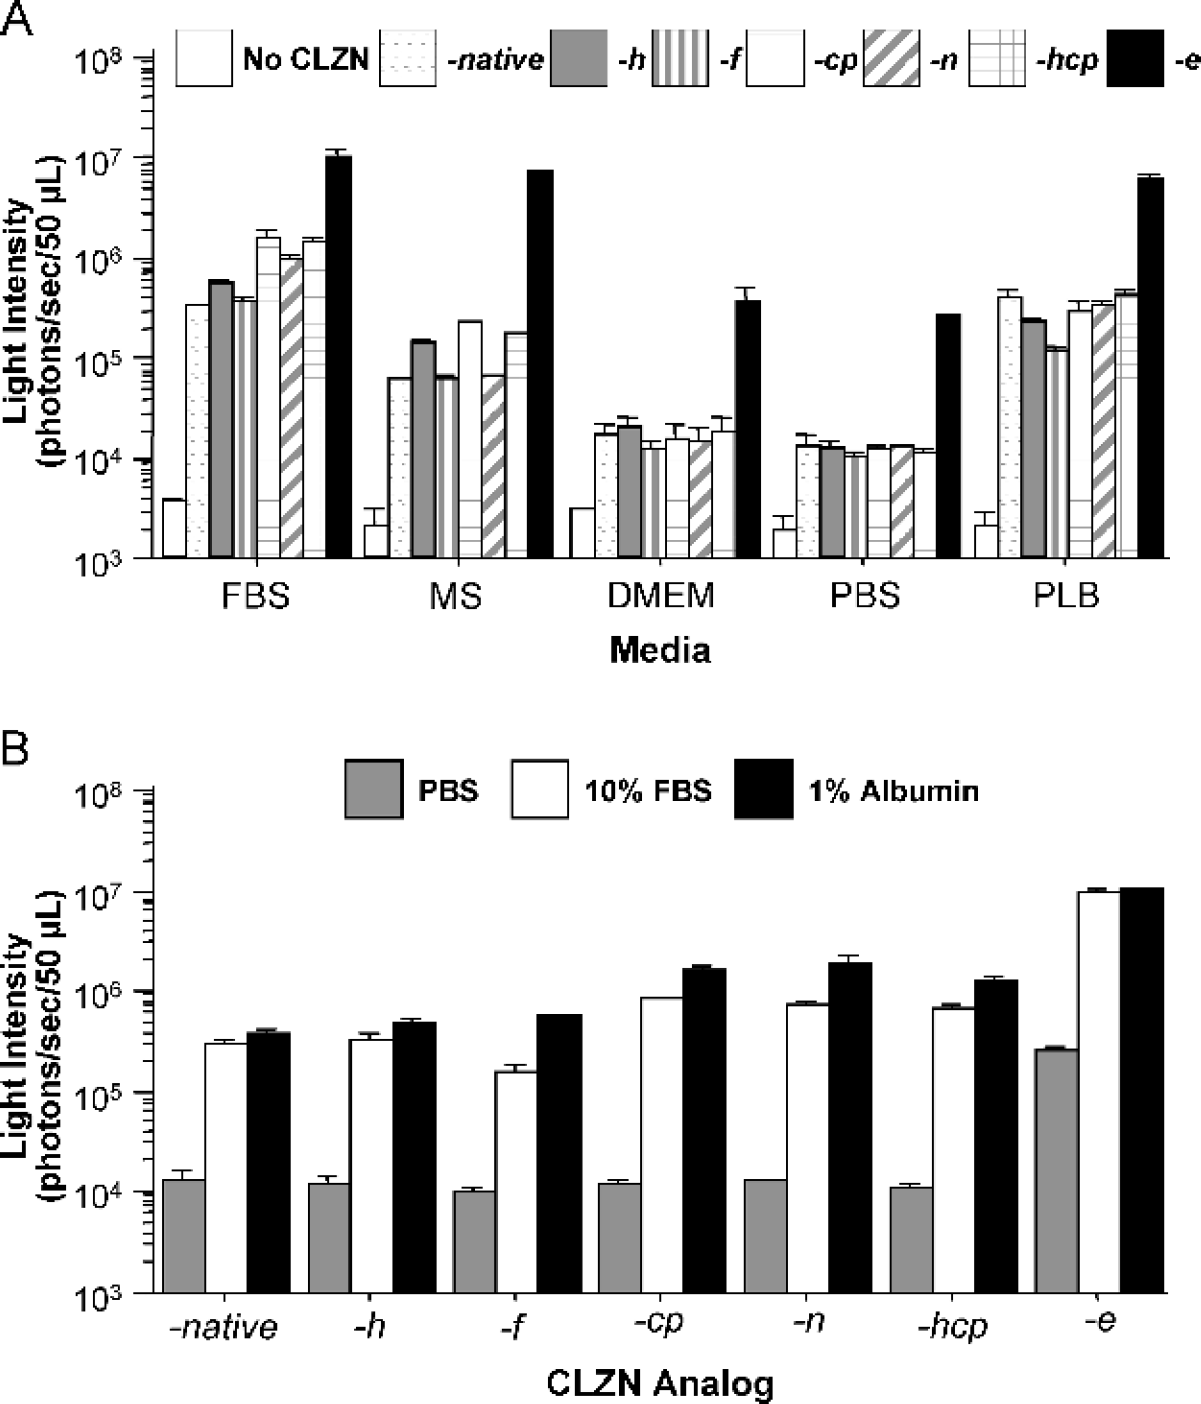
Comparison of autoluminescence intensity from CLZN analogs in different media. Light emission (photons/sec/50 μL of medium) was measured after the addition of each CLZN analog (−native, −h, −f, −cp, −n, −hcp, −e) to each medium. Integration times were 1 min. (A) The autoluminescence from FBS, MS, DMEM, PBS, and PLB are shown. (B) Measurements of autoluminescence from CLZN analogs in PBS or in media containing 10% FBS or 1% albumin were determined. All values are shown as mean ± SD (n = 4).
Results
Auto-Oxidation of CLZN Analogs in Different Media
CLZNs contain an imidazopyrazine structure and are therefore unstable and prone to oxidation, especially in solution [26]. If significant amounts of CLZN were auto-oxidized (enzyme-independent oxidation) in cell culture medium or in the circulation and tissues of mice, then less CLZN substrate would be available to the luciferase-expressing target cells. More importantly, the emitted auto-luminescence would interfere with Rluc luminescent signal. Therefore, we evaluated the levels of auto-luminescence for each substrate under conditions that would be used in live cell assays and in living animals.
When auto-luminescence was measured from the various CLZN analogs, we found that the presence of serum from different species in the assay medium resulted in a significant increase in luminescent signal, with the highest signals obtained in the presence of FBS (Figure 2A and Table 1). The signals were 30- to 100-fold higher than those obtained in wells containing PBS or DMEM in the absence of serum (p = .001). The recommended luciferase assay buffer, PLB (1 ×, Promega), produced background autoluminescence that was equivalent to that observed in the presence of mouse serum (MS). Therefore, for all subsequent measurements of Rluc activity in live cells, growth medium was replaced with either PBS or DMEM in the absence of any sera.
In addition, among the analogs tested, CLZN-e had the greatest signals due to auto-oxidation, producing up to 1 × 10⁷ photons/sec/well in FBS and 2.6 × 10⁵ photons/sec/well in PBS without serum. The intensities were approximately 24- and 14-fold higher than that of CLZN-native in serum and PBS, respectively (Figure 2A).
Because many components in the serum could activate the auto-oxidation of CLZN, we considered albumin as a prime candidate and assayed light production in media containing albumin. Autoluminescence in media containing 1% albumin was measured and compared with that from CLZN in PBS containing 10% FBS (which contains an equivalent amount of albumin). Similar intensities were measured from both solutions (Figure 2B), suggesting that albumin alone can auto-oxidize CLZN and may be the primary catalyst.
Comparison of CLZN Analogs for Measurements of Rluc Activity in Mammalian Cells
To determine the photon yield of each analog and their availability to intracellular Rluc, HeLa and C6 cell lines were used in both live cell and cell lysate assays (Figure 3, HeLa cell data shown only). Of the 10 analogs tested, three (−ip, −i, −m) produced lower bioluminescent signals than the native substrate (data not shown). CLZN-e showed a significant higher emission rate (7.5 × 10⁴ ± 6.18 × 10³ photons/sec/cell, p < .001), which was 8-fold higher than that of CLZN-native (9.4 × 10³ ± 2.8 × 10³ photons/sec/cell). Two other analogs (−f, −h), also demonstrated significantly greater signals (4-fold, p < .001). For all analogs, peak signals were observed 1 min after CLZN addition, with the exception of -n (peak at 10 min) and -hcp (peak at 5 min) (Figure 3A and Table 1). Control cells produced negligible signals (2.90 ± 0.55 photons/sec/cell).
Properties of CLZN Analogs in Cells and Mice

Data are expressed as fold activity relative to that of native CLZN.
4.38 × 10⁵ photons/sec/50 μL.
1.79 × 10⁵ photons/sec/50 μL.
5.06 × 10⁵ photons/sec/ROI (ROI = whole body).
4.08 × 10⁵ photons/sec/ROI (ROI = whole body).
9.4 × 10⁵ photons/sec/cell.
3.26 × 10³ RLU/cell (luminometer).
1.95 × 10⁵ photons/sec/ROI (ROI = liver region).
6.5 × 10⁹ RLU/g liver (luminometer).
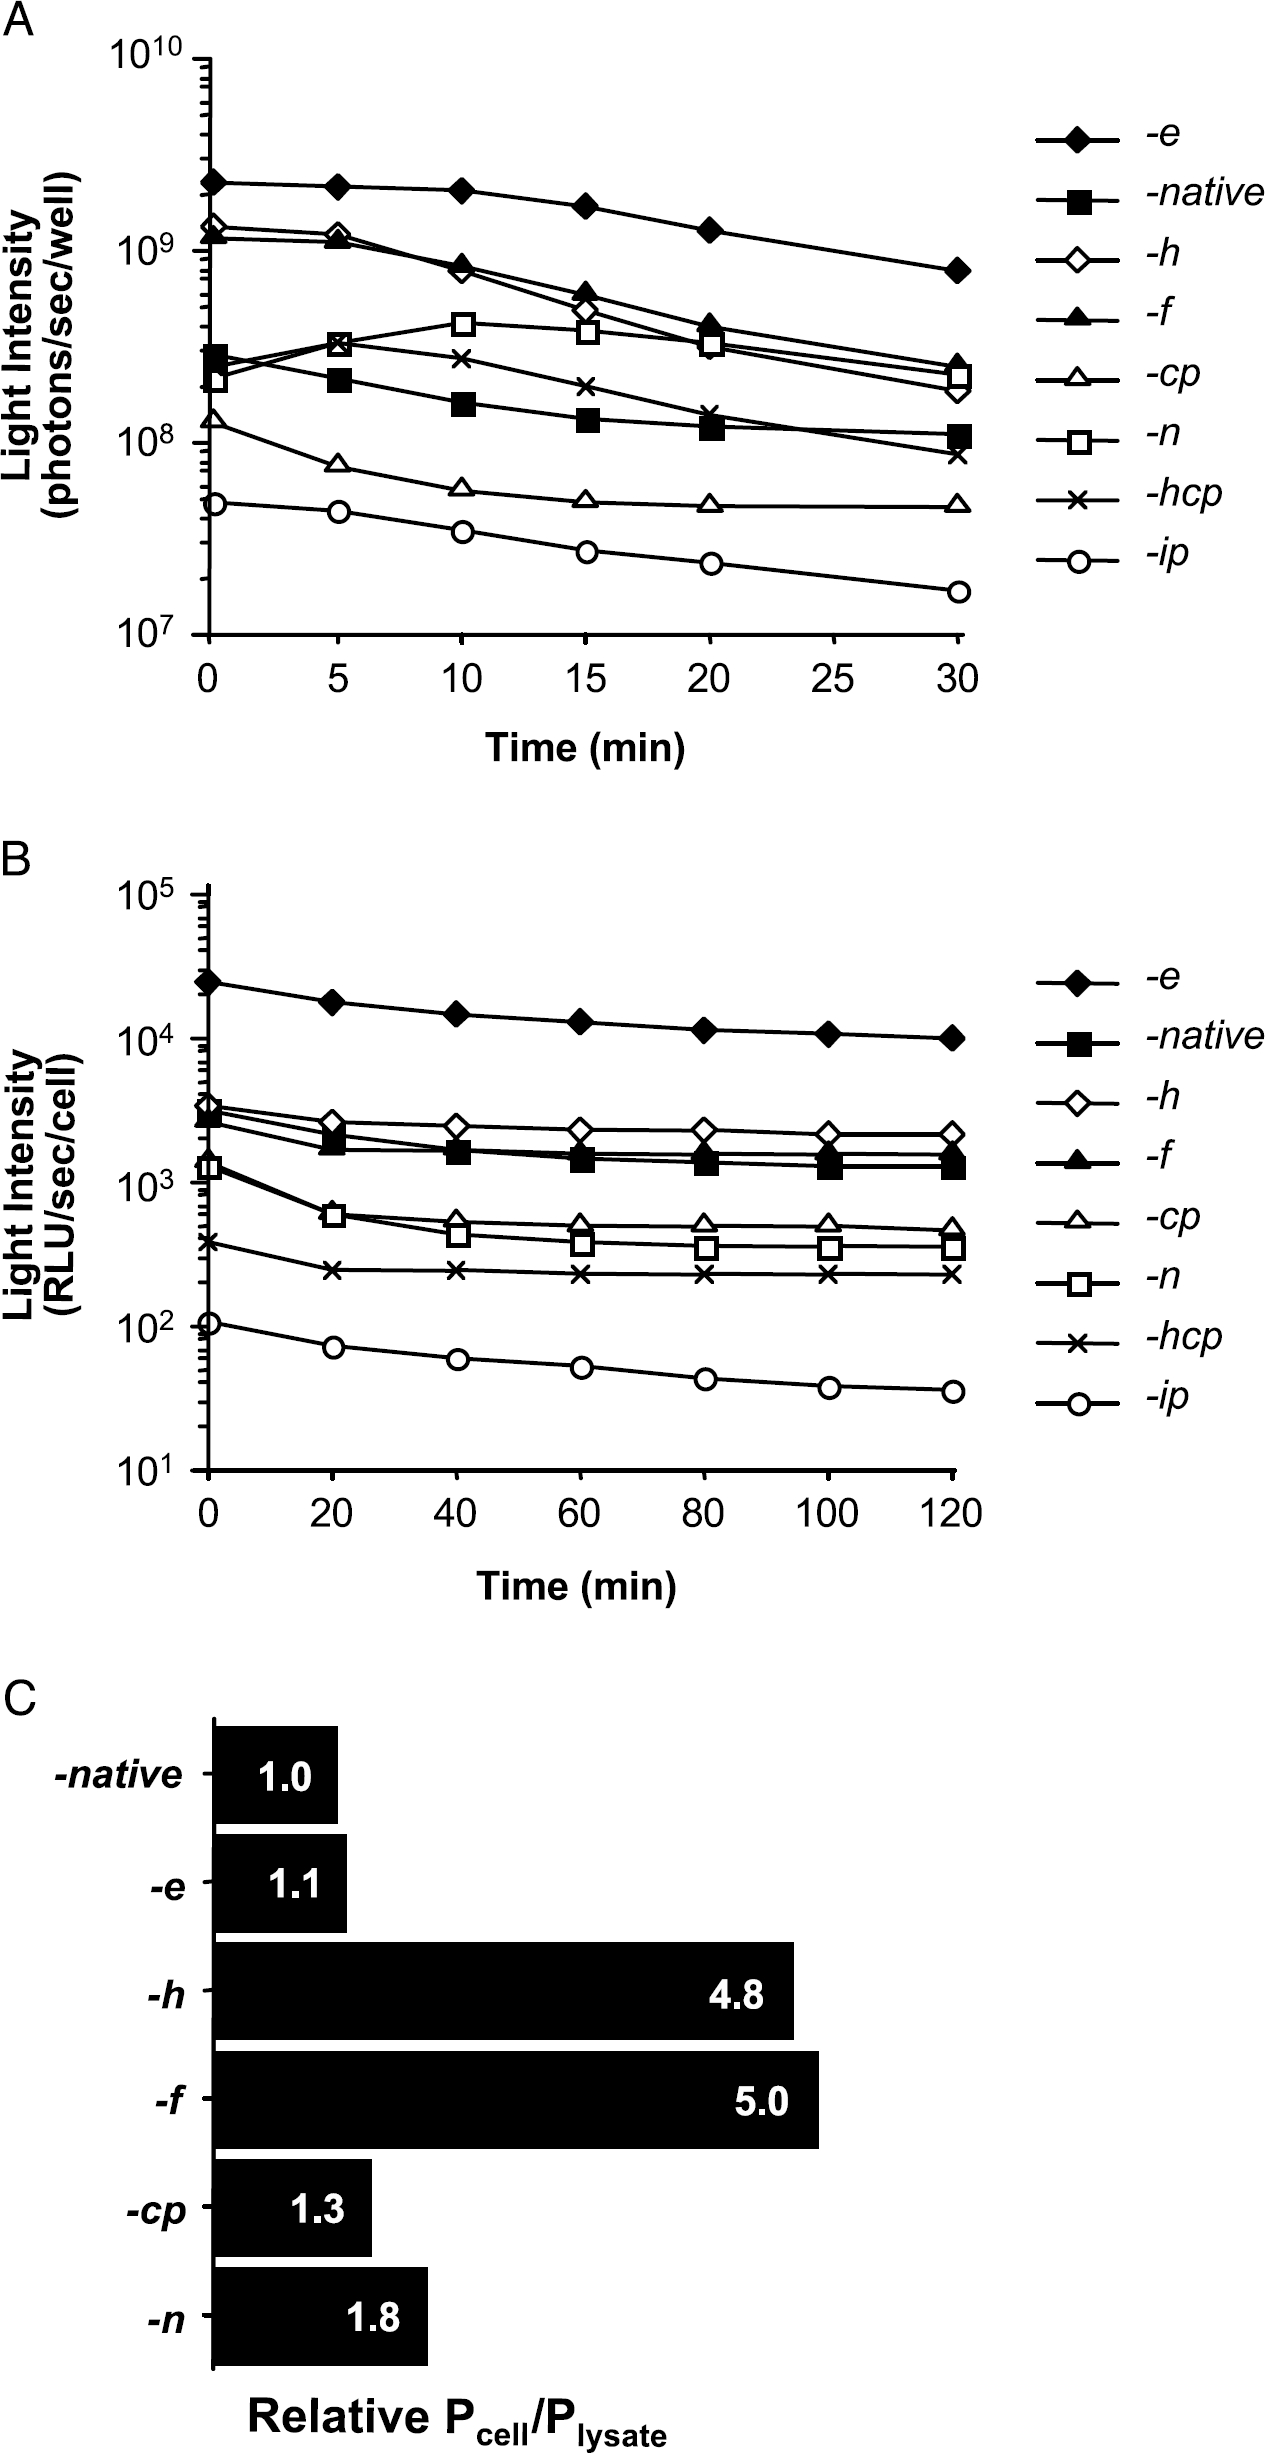
Comparison of Rluc activity with CLZN analogs in mammalian cells. (A) Light intensity from live HeLa cells after the addition of CLZN analogs (−e, −native, −h, −f −cp, −n, −hcp, −ip) was measured in 96-well plates using the IVIS, and are expressed as total photons emitted per sec per 3 × 10⁴ cells/well (mean, n = 4). (B) Light intensity of cell lysates was measured by single tube luminometer following addition of various CLZN analogs (−e, −native, −h, −f −cp, −n, −hcp, −ip) and expressed as relative light units (RLU) per cell (mean, n = 3). (C) The ratio of relative photons/cell (Pcell) to photons/lysate (Ulysate) was determined and plotted. For various CLZN analogs (−native, −e, −h, −f −cp, −n), the ratio of light intensity measured from live cell assays to that from cell lysate assays after 1 min was normalized and compared with the CLZN-native value.
To determine if the live cell measurements reflected the levels of Rluc, activity measurements were also made in cell lysates using the various CLZN analogs. Measurements could not be made immediately after addition of substrate using the IVIS due to the time required for configuration of the detector (approximately 1 min). Therefore, the IVIS was used for measurements over a time interval of 1 to 30 min. A single tube luminometer was used for measurements of time intervals from 1 sec to 2 min after substrate addition. The relative magnitude of signal from each CLZN analog in each instrument was similar, confirming data acquisition by either instrument was comparable. Single tube luminometer measurements of CLZN showed that the light intensity peaked within 10 sec and decreased gradually over time. Of all the analogs tested, CLZN-e was observed to produce the greatest signal (p < .001). Surprisingly, -h and f showed similar intensities to that of CLZN-native and was different from that observed in the live cell assays (Figure 3B and Table 1).
In order to determine the efficiency of substrate availability within cells, we calculated the ratio of the initial light intensity from live cell assay to cell lysate assay (Pcell/Plysate) 1 min post-CLZN addition. These ratios were then normalized to the ratio found with the CLZN-native analog and varied from one analog to the other. In addition, when both HeLa and C6 cells were tested, results were similar: Pcell/Plysate from CLZN-h, f were 4-to 5-fold higher than -e and -native (Figure 3C).
Background Signals from CLZN-Native and −e In Vivo
The observation that autoluminescence of CLZN in the presence of serum produced significant signals suggested that background signals from CLZNs in animals may present problems when reporter gene expression levels are low. We tested the background signals for the -native and -e analogs by injecting them into untreated wild-type mice via intraperitoneal or intravenous routes. For both routes of administration, background signals were only observed ventrally (images not shown). Signals obtained at 1 min post-injection varied among the analogs. CLZN-e displayed much more intense signals (7.6 × 10⁷ ± 5.9 × 10⁶ photons/sec ip and 1.5 × 10⁷ ± 7.7 × 10⁶ photons/sec for iv) than CLZN-native (5.0 × 10⁵ ± 7.4 × 10⁴ photons/sec ip and 4.1 × 10⁵ ± 3.5 × 10⁴ photons/sec iv). Following intraperitoneal injections, signals emanated primarily from the abdominal region and persisted above the background (2.2 × 10⁵ ± 2.1 × 10⁴ photons/sec/mouse) for more than 40 min. In contrast to intravenous injections of CLZN-e, signals were observed initially over the whole body, then localized to the neck and abdominal region, and diminished to background within 20 min (Figure 4).
Expression of Rluc in Murine Liver and Temporal Analyses of Rluc Activity Following Intraperitoneal or Intravenous Injections of CLZN Analogs
After hydrodynamic transfection using the plasmid hRluc-CMV (at a concentration of 5 μg/mouse), Rluc activity was highly expressed in mouse liver at 22 to 24 hr after administration of various CLZN analogs. Temporal analyses were performed to determine the time of peak light emission in vivo. In animals that received CLZN-native (1 mg/kg BW; administrated either intraperitoneally or intravenously), signals were localized to a region over the liver (Figure 5A). However, a different temporal pattern and rate of light production was observed between the two routes of delivery [slope for intravenous injections was 0.083 log(photon/sec)/min, and 0.015 log (photon/sec)/min for intraperitoneal injections; Figure 5B]. Light intensity from the intravenously injected group peaked immediately after CLZN injection and then rapidly declined over 30 min. In contrast, peak light production by intraperitoneal injection was reached after 2 to 3 min and was relatively stable for about 10 min. In addition, light produced within the first min of intravenous injection was more than 10-fold greater than that by intraperitoneal injection.

Background signals from CLZN-native and −e in vivo. Representative images are shown of wild-type FVB mice injected with CLZN-native or −e via intraperitoneal or intravenous routes. Pseudocolor bioluminescent images were superimposed over grayscale reference images of mice. All images were collected at 1 min after CLZN administration unless otherwise indicated.
A dose response of the native CLZN was then evaluated for each route of administration at four concentrations (0.1, 0.5, 1.0, and 4.0 mg/kg BW; Figure 5C). Signal intensity was observed to be dose-dependent with highest overall signals produced by intravenous administration. Decreases of signal intensity were similar when the same route of administration was used (data not shown).
To determine whether quantitative measurements of Rluc activity can be made when the reporter is expressed in deep tissues (e.g., liver) using CLZN concentrations that are below the levels that would saturate the enzyme, in vivo liver transfections were performed using different amounts of hRluc plasmid DNA (0.2, 1.0, and 5.0 μg/mouse) to vary the hRluc levels. Although higher concentrations of transfected DNA produced higher signals, the difference was not significant (p > .05). However, the slopes of signal loss were slightly different [slope for 0.2 μg DNA is 0.055 log(photon/sec)/min; slope for 1 μg DNA is 0.078 log(photon/sec)/min; and slope for 5 μg DNA is 0.083 log(photon/sec)/min; Figure 5D].
Dual Expression of Rluc and Fluc Activities in the Liver
We found that both Rluc and Fluc activities can be measured within the same liver and the expression of Rluc or Fluc could be distinguished by injecting CLZN and
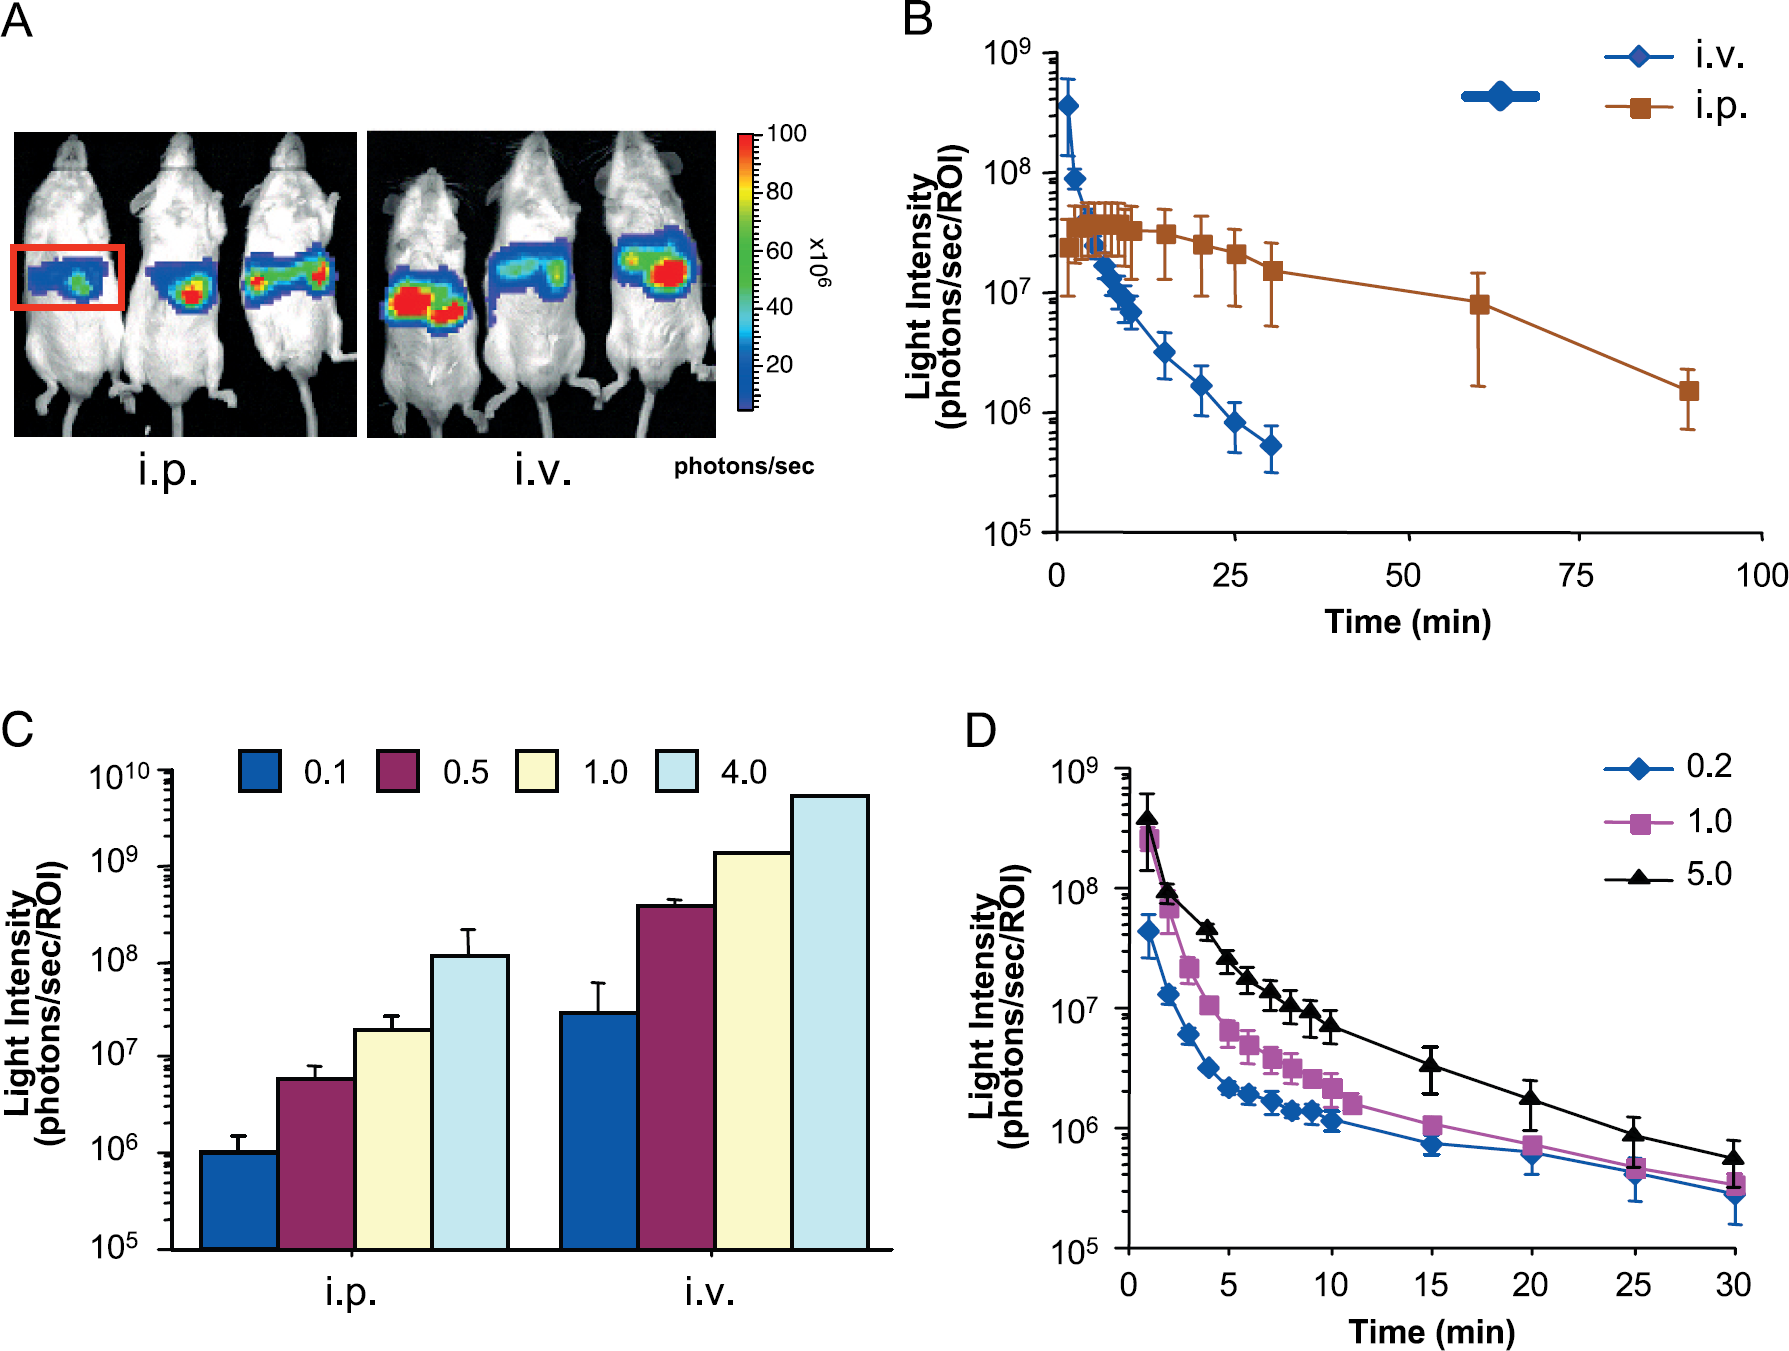
Temporal expression of Rluc in mice after hydrodynamic transfection and administration of CLZN-h by intraperitoneal or intravenous routes of injection. (A) Rluc activity was measured in mice transfected with a plasmid that encodes hRluc (5.0 μg/mouse). Images were acquired 24hr after intraperitoneal or intravenous injections of CLZN-h. A representative ROI (red box) is shown. (B) Comparison of light output kinetics (mean ± SD photons/sec/ROI, n = 3 measurements for each time point) from an ROI corresponding to the region over the liver following intraperitoneal or intravenous injections of CLZN-h. Measurements were made over 30 and 90 min. (C) Dose response for CLZN-h. Various concentrations of CLZN-h were injected intraperitoneal or intravenously into transfected mice and total flux from livers was compared at 1 min after CLZN-h administration (n = 4). (D) The effect of hRluc plasmid dose on in vivo light intensity. Three concentrations (0.2, 1.0, and 5.0 μg/mouse) of hRluc-CMV plasmid were used to transfect cells in the liver (n = 4 mice for each concentration) and light intensity was plotted over 30 min.

Comparison of CLZN analogs in living mice and liver tissue expressing Rluc. (A) The light output was determined for each analog in mice. Mice were first transfected with the phRluc-CMV plasmid (5.0 μg/mouse) and then injected intravenously with CLZN analogs (−e, −native, −h, −f −cp, −n). Mean light intensities (photons/sec/ROI, ROI = region over the liver, n = 4 for each time point) were collected using the IVIS over a period of 15 to 20 min. (B) Comparisons of CLZN analogs in homogenates of Rluc-transfected liver were performed using a luminometer Mean light intensity (RLU per g liver) was determined (n = 3 for each time point) over a 120-min period following the addition of CLZN analogs (−e, −native, −h, −f −cp, −n). (C) Comparison of auto-oxidation and Rluc activity was assessed in liver homogenates. Light intensity (mean ± SD RLU/g liver) from liver homogenates of mice without transfection (n = 3) or after hRluc transfection (n = 3) was analyzed using a luminometer 10 sec after addition of CLZN analogs (−e, −native, −h, −f −cp, −n).
Comparison of CLZN Analogs in Living Mice and Tissues
To compare the light production from CLZN analogs in vivo, six analogs (−e, −native, −h, −f, cp, and -n) were selected, based on the live cell assay results, for injection into Rluc-transfected animals. Each analog was administrated intravenously into mice and Rluc activity measured by BLI. For all analogs, light production from the region over the liver was maximal within the first minute of administration and decreased at similar rates [roughly 0.080 log(photons/sec)/min], except for CLZN-n, which decreased at a much slower rate [0.049 log(photons/sec)/min]. Of the analogs tested, CLZN-e and -native produced the greatest signal intensities, averaging 6.1 × 10⁹ and 1.95 × 10⁹ photons/sec, respectively. Rluc activity was weaker after administration of CLZN-h, f, and -cp, being approximately 1/5 ofthat observed with the -native analog (Figure 6A and Table 1).
Using the luminometer to make measurements of lue activity in tissue homogenates, very low background signals were detected from the Rluc control liver homogenates (without transfected hRluc plasmid) (˜3.0 × 10⁷ RLU/g liver) (Figure 6B). Consistent with the in vivo data, CLZN-e gave the strongest signal in the liver homogenates (˜ 3.1 × 10¹⁰ RLU/g liver, p < .001). However, Rluc activity was similar between -native, −f, and -h analogs (Figure 6C and Table 1). Using the IVIS, measurements from liver homogenates and living animals with CLZN-native, as the substrate, were compared. Rluc activity from liver homogenates (2.43 × 10¹¹ photons/sec/g liver) using 1 μM CLZN was more than 100-fold greater than that measured from whole body (1.95 × 10⁹ photons/sec collected from liver region, each liver was roughly 1 g).
Discussion
In this study, we investigated various CLZN analogs for use as substrates by the Rluc reporter system both in live cell cultures and in animals. Measurements made in live cells and animals were validated using measurements in cell lysates and tissue homogenates. We found significant differences in signals among the CLZN analogs as well as different patterns of activation following delivery via intraperitoneal and intravenous routes to living mice. These differences indicate that for quantitative and reliable measurements of Rluc activity, it is essential that rigorous standards be used as shown by studies with Fluc. Detection of a signal in the absence of standardization and without considering the properties of light transmission through tissues can lead to inaccurate measurements for any optical reporter or tracer.
All CLZN analogs tested produced background luminescence in the absence of enzyme in cell culture media, especially those containing serum, due to the auto-oxidation of CLZN analogs. CLZNs are generally unstable even in their solid state and in solutions, where they are significantly oxidized within 2 to 3 hr at 0 to 25° C [26]. Because signals due to auto-oxidation could interfere with measurements of Rluc activity, especially when Rluc expression levels are low, these assays should be performed only in PBS or DMEM. Because 1% albumin produced similar auto-luminescence signals as 10% FBS, albumin is a likely contributor to CLZN oxidation. This is consistent with the report that the solvent cage of albumin can bind to CLZN and produce bioluminescence [21]. Similar effects could be present in other buffers as well and they should be rigorously tested before use in the Rluc-CLZN system.
Among the 10 analogs tested in cell culture and 6 analogs in living animals, CLZN-e, -native, −h, and -f produced the greatest signals. Two analogs, -h and −f, showed the most promising signals in live cell assays in PBS, and CLTN-native may be the most appropriate analog for use in mouse experiments—at least for hRluc expression in the liver. CLZN-e is the most recent commercially available analog and according to the manufacturer's report, its initial light intensity is more than seven times higher than that of CLZN-native [27]. This is corroborated by our results where we found that the -e analog produced as much as 6- to 7-fold higher signal intensity than did the -native analog in cell studies, and a 3- to 4-fold greater signal production in the liver studies. However, -e appeared to be more readily oxidized and produced the greatest auto-luminescence signal in all media we tested as well as mice. Furthermore, the signal-to-noise ratio (SNR) will depend on the Rluc expression levels and assay conditions. In our cell culture and animal models, the Rluc-mediated signals were 100-to 1000-fold greater than those due to auto-oxidation, which did not contribute significantly to the overall signal. However, in cases where reporter gene expression may be low, the noise due to auto-oxidation could interfere with the assay.
Because light output from the bioluminescence reaction will depend on substrate availability, the permeability of the cell membrane to CLZN can directly affect the measurement of Rluc activity in living cells. Although it is widely accepted that CLZN-native and its analogs can sufficiently permeate through various cell membranes [31,32], thorough studies have yet to be performed. Permeability may vary considerably for different cell types and substitution groups on the CLZN analogs. CLZN availability has been shown to be the rate-limiting step in intracellular aequorin reactions due to its slow diffusion into Drosophila oocytes [22]. The membrane permeability of CLZN analogs has been measured in killifish eggs and CLZN-e is found to be poorly permeable. In contrast, the -f analog is reported to have the highest permeability [33]. In our study using HeLa and C6 cells, we observed a difference in Pcell/Plysate values from the analogs tested. If the Rluc catalytic reaction is assumed to be the same in live cells and cell lysates, the difference of Pcell/Plysate values should reflect an analog's intracellular availability. Assays with CLZN-h and f showed higher Pcell/Plysate values, possibly an indication of higher influx or lower efflux. Because bioluminescence assays have typically been performed in cell lysates, very little is known about the mechanisms of influx or efflux of CLZN and its derivatives in live cells. However, with the development of imaging strategies that employ in vivo reporters, it has become imperative that these processes be evaluated. In a recent study, it was reported that CLZN shares structural properties with compounds that are substrates for the multidrug resistance (MDR1) P-glycoprotein (Pgp) [34]. This study supported the hypothesis that Pgp mediates the efflux of CLZN. They further demonstrated that CLZN-native, −f, −h, and -hcp were transported by Pgp, whereas CLZN-n and -cp were not [34]. In addtion to Pgp, many aspects, including other membrane transporters, sequestration of substrate within cells and potentially auto-oxidation within cells, might also contribute to the variation of CLZN intracellular availability. All of these need to be addressed specifically in future studies.
Here, we employed a nonviral hydrodynamic liver transfection technique where up to 50% of hepatocytes can be transfected by plasmid DNA after injection into the tail vein of mice [29,30]. In this model, signals from RLuc expressed in the liver could be detected when CLZNs were administrated via either intraperitoneal or intravenous injection, albeit the dynamics of light production appeared to differ substantially between two routes. Intravenous administration produced signals of greater intensity, which also decreased more rapidly than those following intraperitoneal injections; however, intraperitoneal injections provided detectable signals for a longer duration than in intravenous administration (10 min) with relative stability, but the intensities were significantly less than those following intravenous injections. The longer duration of detectable signal maybe beneficial in some applications, however, the lower intensity may be problematic. The kinetics of signal production that we observed after intraperitoneal injections have never been reported before while those from intravenous injection confirmed previously reported data [14]. Based on our data, it was possible to detect the activities of Rluc and Fluc in the same organ with no apparent cross-reactivity. Therefore, even in mouse tissues, it is possible to use both reporters.
Various concentrations of CLZN were tested and a dose-dependent response was observed. The CLZN dose of 1 mg/kg BW did not saturate the reaction. In fact, substrate saturation may not have achieved even using highest substrate concentration (4 mg/kg BW; Figure 5C). However, considering cost and potential toxicity, 1 mg/kg BW might be an optimal concentration. Because the substrate is not in excess, the level of light production may be due to substrate availability and not enzyme concentration. Quantitative measurements of Rluc activity are, therefore, relative to the site of expression, route of substrate delivery, time post-delivery that the measurement is made, Pgp status of the expressing cell, and possibly cell type. Effective use of Rluc and other CLZN-utilizing enzymes will depend on improving our understanding of CLZN biodistribution, cellular permeability, and effects of Pgp and other cellular proteins on CLZN availability.
Development of CLZN-utilizing enzymes as effective in vivo reporters should include the design and characterization of substrates with improved biological properties. This is evidenced by the observations that signals from Rluc can be increased through the injection of more substrate [35]. The fact that saturation of the enzyme with substrate is difficult to achieve with CLZN-utilizing enzymes, due to cost and biodistribution, makes quantitation difficult as signals may represent substrate levels and not enzyme expression levels.
Careful selection of CLZN analogs for in vivo measurements of Rluc activity appears to be warranted from these studies, and these data suggest a need for the development and testing of additional analogs for improved imaging of Rluc in vitro and in vivo. Based on the criteria of high signal intensity and low background from auto-oxidation, the -h and -f analogs appear to be the best available substrates for cell culture studies and -native is optimal for studies in animals.
Footnotes
Acknowledgments
We thank Dr. Sanjiv (Sam) Gambhir for his critical review of this manuscript and Drs. Stacy M. Burns and Hamid R. Kazerouni Zadeh for their help with this study. This work is supported, in part, by a Technology Innovation grant from the NCI (CA 88303 [CHC]), other grants from National Institutes of Health (HL 58013 [DKS, CHC]; CA 94056 [DP]) and unrestricted gifts from the Mary L. Johnson and Hess Research Funds.