
Abstract
Fluorescent semiconductor nanocrystals (quantum dots [QDs]) are hypothesized to be excellent contrast agents for biomedical assays and imaging. A unique property of QDs is that their absorbance increases with increasing separation between excitation and emission wavelengths. Much of the enthusiasm for using QDs in vivo stems from this property, since photon yield should be proportional to the integral of the broadband absorption. In this study, we demonstrate that tissue scatter and absorbance can sometimes offset increasing QD absorption at bluer wavelengths, and counteract this potential advantage. By using a previously validated mathematical model, we explored the effects of tissue absorbance, tissue scatter, wavelength dependence of the scatter, water-to- hemoglobin ratio, and tissue thickness on QD performance. We conclude that when embedded in biological fluids and tissues, QD excitation wavelengths will often be quite constrained, and that excitation and emission wavelengths should be selected carefully based on the particular application. Based on our results, we produced near-infrared QDs optimized for imaging surface vasculature with white light excitation and a silicon CCD camera, and used them to image the coronary vasculature in vivo. Taken together, our data should prove useful in designing fluorescent QD contrast agents optimized for specific biomedical applications.
Keywords
Introduction
Semiconductor quantum dots (QDs) are inorganic fluorophores that are currently being investigated for use as luminescent biological probes due to their nanometer dimensions and unique optical properties [1–5]. Compared to conventional fluorophores and organic dyes, QDs have a number of attractive characteristics including high absorption cross-section, broadband absorption that increases at bluer wavelengths, relatively narrow and symmetric luminescence bands, simultaneous excitation of QDs with different emission wavelengths using a single excitation wavelength, and potentially high resistance to photodegradation [1,5,6]. Although the synthesis of QDs is performed in organic solvents, various surface chemistries can impart aqueous solubility [1–3,6,7] and permit conjugation to biomolecules such as proteins [3,6], oligonucleotides [8,9], antibodies [10,11], and small molecule ligands [12,13]. Such “targeted” QDs have been reported as contrast agents for nucleic acid hybridization [8,9], cellular imaging [1,2,6,14], immunoassays [2,11], and recently, tissue-specific homing in vivo [13].
Another potential application of QDs is as fluorescent contrast agents for biomedical imaging. However, in vivo applications, and especially reflectance fluorescence imaging [15,16] (the impetus for this study), require deep photon penetration into and out of tissue. In living tissue, total photon attenuation is the sum of attenuation due to absorbance and scatter. Scatter describes the deviation of a photon from the parallel axis of its path, and can occur when the tissue inhomogeneity is small relative to wavelength (Rayleigh-type scatter), or roughly on the order of wavelength (Mie-type scatter). For inhomogeneities at least 10 times less than the wavelength, Rayleigh-type scatter is proportional to the reciprocal fourth power of wavelength. In living tissue, photon scatter is the result of multiple scattering events, and in general terms can be considered either dependent on wavelength or independent of wavelength. For example, in rat skin, scatter is proportional to Λ−2.8 [17], suggesting strong wavelength dependence, however, in postmenopausal human breast, scatter is proportional to Λ−0.6 [18], suggesting weak wavelength dependence.
Given the relatively low absorbance and scatter of living tissue in the near-infrared (NIR: 700–1000 nm) region of the spectrum, considerable attention has focused on NIR fluorescence contrast agents (reviewed in [19]). For example, conventional NIR fluorophores with peak emission between 700 and 800 nm have been used for in vivo imaging of protease activity [20], somatostatin receptors [21,22], sites of hydroxylapatite deposition [15], and myocardial vascularity [16], to name a few. To date, however, a systematic analysis of how tissue optical properties might affect QD performance in vivo, and whether infrared (IR), rather than NIR, wavelengths could potentially improve overall photon yield, has not been presented. In this study, we utilized a previously described mathematical model [23] to predict how various tissue characteristics will affect QD performance in vivo, and have used this model to select optimal QD excitation and emission wavelengths for various imaging applications. Based on these results, we synthesized a particular NIR QD and report the first use of NIR QDs for real-time in vivo vascular imaging.
Materials and Methods
Animals
Animals were used in accordance with an approved institutional protocol. Male Sprague-Dawley rats were obtained from Charles River Laboratories (Wilmington, MA). Hairless athymic nu/nu mice were from Taconic (Germantown, NY). Rats and mice were anesthetized with 65 and 50 mg/kg intraperitoneal pentobarbital, respectively.
Reagents
Sterile Intralipid (20%) was purchased from Baxter (Deerfield, IL). Water was purified on a Milli-Q system (Millipore, Bedford, MA). Olive oil was from Filippo Berio (Viareggio, Italy). Oxyhemoglobin (OxyHb) was prepared from normal human donors as described previously [24]. Deoxyhemoglobin (DeoxyHb) was prepared by treatment of OxyHb with 1% sodium dithionite (Sigma, St. Louis, MO). Albumin, Cohn Fraction V was also from Sigma. All solutions except Intralipid were filtered through 0.2-μm filters (Millipore) prior to use to eliminate scatter. Trioctylphosphine oxide (TOPO), selenium shot, and tellurium shot were from Alfa Aesar (Ward Hill, MA). Trioctylphosphine (TOP) was from Fluka (St. Louis, MO). Hexadecylamine (HDA) was from Aldrich (St. Louis, MO). All other reagents were purchased from Fisher Scientific (Hanover Park, IL).
Preparation of Aqueous Soluble 752 nm CdTe(CdSe) core(shell) QDs
The CdTe(CdSe) composition included a core of cadmium telluride (CdTe) and a thin shell of cadmium selenide (CdSe). Unless otherwise noted, all reactions were carried out in a dry nitrogen atmosphere using a glove box or standard Schlenk techniques. Trioctylphosphine selenide (TOPSe), 1.5 M, and trioctylphosphine telluride (TOPTe), 0.5 M, were prepared by adding selenium (or tellurium) shot to TOP and stirring until dissolved. Cadmium acetylacetonate (CdAcAc), 554 mg, was suspended in 6.0 ml TOP and stirred under vacuum at 100°C until well mixed. A nitrogen atmosphere was then introduced, and the mixture was cooled to room temperature. TOPSe (0.4 ml) and TOPTe (2.7 ml) were then added and stirred. A mixture of 6.25 g TOPO and 5.75 g HDA was dried under vacuum at 130°C in a round bottom flask, then filled with nitrogen and heated to 350°C. The CdAcAc, TOPSe, and TOPTe mixture was diluted by a small amount of TOP, and then injected into this flask. The reaction mixture was stirred at 250°C until the desired particle size was reached according to the absorption spectrum of the mixture. The heat was removed, and hexane was added when the temperature reached approximately 60°C. The mixture was centrifuged and a precipitate consisting of reaction by-products was discarded. Methanol was added to precipitate the QDs. The mixture was centrifuged and decanted yielding a powder of QDs. Extensive characterization of such QDs using transmission electron microscopy (TEM), X-ray diffraction and fluorescence lifetime measurements show that the structure is consistent with the core consisting of CdTe and a shell of CdSe (S. Kim et al., in preparation).
The QDs were dispersed in water by exchanging the organic caps with oligomeric phosphines derivatized with carboxylic acid (OPCA; in preparation) as follows. The QD sample was redispersed in chloroform. A water solution of OPCA was introduced, forming a bilayer. This mixture was sonicated until all the QDs were transferred to the aqueous phase, as determined by the transfer of color from the organic phase to the aqueous phase. Excess OPCA was removed by dialysis. Concentration was determined as described previously [25].
Tissue Preparation
Human whole blood was collected directly into a purple top (EDTA) clinical specimen tube and stored at 4°C. Where indicated, it was diluted in phosphate-buffered saline (PBS), pH 7.4 supplemented with 5 mM EDTA (to prevent clotting). Skin was prepared by surgical excision and bathed in ice-cold PBS. Specimens were used within 3 hr of collection.
Absorbance Measurements
Pairs of optically matched 1.0 or 0.05 cm cuvettes (Spectrocell, Oreland, PA) were used on a Model 5 (Varian-Cary, Palo Alto, CA) scanning spectrophotometer equipped with deuterium and tungsten lamps. Absorbance wavelength scans from 400 to 2000 nm, at a resolution of 1 nm, were performed on water (air blank), lipid (olive oil; air blank), OxyHb in PBS, DeoxyHb in PBS, and protein (albumin) in PBS (PBS blank). Five individual scans were averaged prior to calculation of the extinction coefficient at each wavelength. Measured values matched closely those published previously [26,27].
Scanning Spectrofluorometry
Fluorescence excitation and emission scans were performed on a SPEX Fluorolog-2 spectrofluorometer (Jobin Yvon Horiba, Edison, NJ) equipped with a R928 photomultiplier tube. To preserve high quantum yield (QY), non-OPCA treated QDs were diluted to 1 μM in hexane and placed in a 1-cm path length cuvette sandwiched by different in vivo simulating media, or tissue, as shown in Figure 2A.
Modeling QD Performance During In Vivo Imaging
To describe light propagation through tissue, we assumed the geometry shown in Figure 3A and adapted a previously described analytical solution to the diffusion equation [23]. Briefly, for a given fluence rate, the local rate of energy absorption by QDs (R
A
in mW/cm3) can be expressed by the extinction (or absorption) coefficient of QDs at the excitation wavelength (ΛEx) as [μQDs(ΛEx) (cm−1)] and the spatial distribution of the light energy fluence rate φ(z, ΛEx), in mW/cm2, where z represents depth in the tissue:


Here, μa(Λ) (cm−1) and μs′(Λ) (cm−1) represent the total tissue absorption and reduced scattering coefficients, respectively, and μa,i(Λ) (M−1 cm−1) and μ's,i (Λ)(M−1 cm−1) represent the absorption and scatter coefficients, respectively, of n individual biomolecules at the particular excitation or emission wavelength, and at a concentration ci (M), which comprise the tissue. Values for μa of water, lipid, DeoxyHb, OxyHb and protein were measured as described above. The relationship between scattering coefficient and wavelength (Λ) can be empirically described as follows: μs′(Λ) = JΛ−P [28], where J is related to the scattering density and P is the scatter power coefficient. The parameters D1, k1, D2, k2 (and D3, k3, see below) depend solely upon diffuse reflectance, Rd, which has been previously investigated through Monte Carlo simulations [23]:

For simplicity, we assumed 1.33 as the refractive index of tissue for all simulations. The value of Rd depends on the absorption coefficient of the tissue and the effective path length that photons travel in the tissue, and can be approximated as a function of N′, defined as the ratio of reduced scattering coefficient to absorption (μs′/μa). The diffuse reflectance, Rd, from the surface of a semi-infinite medium is approximated by the expression [29]:


The factor Aδ equals the apparent path length L for photon attenuation due to the absorption coefficient. A is approximately 7–8 for most soft tissues [29]. These analytical expressions have accuracy comparable to Monte Carlo simulations over an essentially unrestricted range of diffuse reflectance values [23]. The rate of QD emission (RE in mW/cm3) is given by:


In the case of broadband excitation light, the source and excitation spectrum must be integrated over all incident wavelengths. Thus, the above equation can be rewritten as follows:

The light intensity of RA or RE at any one wavelength can be converted to number of photons per cm3 (NA,E) by the following formula:

If desired, the geometry of the QD source can be used to convert NA,E into units of mW/cm2. These equations, along with the attenuation curves for water, lipid, OxyHb, DeoxyHb, and protein were incorporated into an Excel 98 spreadsheet (Microsoft, Redmond, WA) for rapid analysis of model variables. The model is available from the authors as an Excel spreadsheet.
In Vivo NIR Fluorescence Imaging of the Coronary Vasculature
Anesthetized rats, weighing 350 g, were ventilated on an SAR-830AP (CWE, Ardmore, PA) ventilator and a midline sternotomy was performed. The exposed heart was imaged as described previously [16] except no laser was used, and only a single 150-W halogen light source illuminated the surgical field. A combination of hot mirrors and band pass filters (Chroma, Brattleboro, VT) produced broadband excitation light of 400 to 700 nm at a total fluence rate of 2.0 mW/cm2. A 740dcxr dichroic mirror (740 nm center point) and model D770/50 emission filter (745–795 nm) were also purchased from Chroma. The Orca-ER (Hamamatsu, Bridgewater, NJ) NIR camera settings included gain 7 (out of 9), 2 by 2 binning, 640 by 480 pixel field of view, and an exposure time of 25 msec. Color video camera (HV-D27, Hitachi, Tarrytown, NY) images were acquired at 30 frames per second at a resolution of 640 by 480 pixels. Data were acquired and quantitated on a Macintosh computer equipped with a Digi-16 Snapper (DataCell, North Billerica, MA) frame grabber (for Orca-ER), CG-7 (Scion, Frederick, MD) frame grabber (for HV-D27) and IPLab software (Scanalytics, Fairfax, VA). Aqueous-soluble 752 nm QDs were resuspended in PBS at a concentration of 2.5 μM. One milliliter (2.5 nmol) of this suspension was injected intravenously via the tail vein and the coronary vasculature was imaged as described in the text and in [16].
Results
Synthesis of Aqueous-Soluble NIR Emitting QDs
Based on an analysis of transmission bands in biological tissue having different properties (discussed in detail below), NIR QDs with a peak emission wavelength at 752 nm were synthesized as described in Materials and Methods. Extensive characterization using transmission electron microscopy, X-ray diffraction, and fluorescence lifetime measurements shows that the structure is consistent with a core consisting of CdTe and a shell of CdSe (data not shown), and a mean diameter of approximately 10 nm. QDs were made soluble in aqueous media by treatment with oligomeric phosphines as described in Materials and Methods. The extinction coefficient of these NIR QDs features the characteristic increase to the blue, with a shoulder at approximately 730 nm (Figure 1). Scanning spectrofluorometry showed a peak emission at 752 nm, with a full width half maximum (FWHM) of 60 nm (Figure 1). The QY in PBS was approximately 25% using Oxazine 725 laser dye [30] as a reference.
QD Performance with Scattering Medium
We sought to determine if the absorbance and emission properties of QDs were influenced significantly by the attenuation properties of surrounding tissue. The experimental geometry is shown in Figure 2A. The first medium chosen was simply a nonabsorbing buffer (PBS) into which was added increasing concentrations of Intralipid. Intralipid is a suspension of various lipids in water that is often used to simulate tissue scatter, and exhibits scatter that is strongly dependent on wavelength (proportional to ≈Λ−2.4 [31]). Shown in Figure 2B is the effect of increasing scatter on NIR QD excitation. In the absence of scatter (thick solid line), scanning spectrofluorometry confirms that fluorescence excitation matches the pattern of absorbance shown in Figure 1. However, with as little as 0.02% Intralipid (μs’ ≈ 0.3 cm−1 at 630 nm), increased QD absorbance at bluer wavelengths is lost. The effect of 0.02% Intralipid on QD emission was insignificant (Figure 2B).

Photoproperties of 752 nm NIR QDs. CdTe(CdSe) core(shell) QDs with peak fluorescent emission at 752 nm were prepared as described in Materials and Methods and resuspended in PBS at a concentration of 1 μM. Extinction coefficient is shown on the left axis (thick solid line) and photoluminescence (500 nm excitation) is shown on the right axis (dashed line), both as a function of wavelength.

Experimental geometry and QD performance in scattering and/or absorbing media and tissue. (A) The illumination/detection geometry of spectrophotometer experiments is shown. Excitation light (ΛEx) is a single, thin collimated beam propagating through optically thin tissue. QDs at the given concentration are below the tissue and absorb the net excitation photons. Depending on the quantum yield of the QDs, fluorescent light (ΛEm) is emitted and propagates out through the same thickness of tissue. The detector is placed at 90° relative to the excitation light beam. (B-D) The QDs shown in Figure 1 were subjected to excitation and emission spectrofluorometry, as described in Materials and Methods, using the geometry shown in A. For excitation scans (left curves), the emission wavelength was fixed at 752 nm. For emission scans (right curves), the excitation wavelength was fixed at 550 nm (Intralipid) or 650 nm (blood, skin). For comparison, QD performance in PBS is shown on each graph (thick solid line). Data are normalized for display on a single ordinate. Experimental conditions are as follows: (B) QD fluorescence excitation (left) and emission (right) in 0.02% Intralipid (dashed line); (C) QD fluorescence excitation (left) and emission (right) in human whole blood (i.e., a tissue exhibiting wavelength-independent scatter) diluted 50 fold (dashed line); (D) QD fluorescence excitation (left) and emission (right) in 0.99-mm-thick nonpigmented hairless mouse skin (i.e., a tissue exhibiting wavelength-dependent scatter).
QD Performance with Tissues Having Absorbance and Either Wavelength-Independent or Wavelength-Dependent Scatter
We next asked how QDs would perform when surrounded by actual biological tissues. For these experiments, human whole blood was chosen as an absorbing tissue whose scatter was independent of wavelength, and nonpigmented hairless mouse skin as a tissue whose scatter was dependent on wavelength [17]. As shown in Figure 2C (left curves), QDs surrounded by even dilute human blood had a complex wavelength-dependent excitation spectrum, which differed markedly from the predicted QD absorbance in nonabsorbing and nonscattering medium. Most importantly, increasing absorption at bluer wavelengths was absent. The wavelength dependence of emission was fairly symmetrical about the predicted peak emission of 752 nm (Figure 2C, right curves). The loss of bluer wavelength in the QD excitation spectrum was even more pronounced at higher blood concentrations (data not shown). As shown in Figure 2D (left curves), the excitation spectrum of QDs surrounded by hairless mouse skin exhibited essentially a compete loss of bluer wavelengths, and QD emission was slightly red-shifted.
We conclude from these data and additional simulations (not shown) that biological tissue exhibits a “filter” effect that can counteract the advantageous increase in QD absorbance at bluer wavelengths. This effect is highly dependent on the shape of the QD absorbance curve and the shapes and strengths of the tissue absorbance and scatter attenuation curves. Furthermore, when the tissue scatter power coefficient is high, there can be a red shift of peak QD emission.
Selection of QD Peak Emission Wavelengths Based on Tissue Transmission Bands
For reflectance fluorescence imaging, the light source is typically uniform and diffuse, and perpendicular to the air/tissue interface. Since QDs will likely be used in the future for tumor targeting, and specifically for the detection of small collections of malignant cells, in our analysis, they are assumed to be concentrated at a point, at a depth z below the air/tissue interface (Figure 3A). Garnder et al. [23] have already described an analytical solution to the diffusion equation that matches this imaging geometry, and have validated its accuracy against Monte Carlo simulations.
Using this model in spreadsheet format (see Materials and Methods), we could simulate QD performance under conditions of varying absorbance, scatter, tissue thickness, and QD optical properties. In most tissues, absorbance is dominated by H2O and hemoglobin (Hb), each of which has local minima and maxima of transmission. Although total photon transmission is a continuum, to simplify the analysis, we will focus on the four transmission “bands” shown in Figure 3B: 690–915 nm (Band 1), 1025–1150 (Band 2), 1225–1370 nm (Band 3), and 1610–1710 nm (Band 4). The lower limit of Band 1 is bounded by Hb absorbance, whereas its upper limit is bounded by lipid and H2O absorbance. All other transmission bands represent local minima in the H2O absorption curve. Band 4 ends at 1710 in this analysis to avoid a sharp lipid absorbance peak at 1735 nm ([32]; data not shown).
Shown simulated in Figure 3B are the number of photons transmitted through tissues of varying H2O to Hb ratio, scatter power coefficient, and thickness, as a function of wavelength. For simplicity, the OxyHb to DeoxyHb ratio was fixed at 1:1, and lipid content was fixed at 15% by weight (i.e., 0.25 M assuming an average lipid molecular weight of 600 Da and an equal ratio of cholesterol and phosphatidylcholine). Model parameters used for the simulation included: thickness as shown, water content = 75%, lipid content = 0.25 M, OxyHb concentration = 1.25 or 0.02 mM, DeoxyHb concentration = 1.25 or 0.02 mM, protein concentration = 2.5 mM, absolute scatter at 630 nm = 8.9 cm−1 (wavelength-independent scatter) or 23 cm−1 (wavelength-dependent scatter), and scatter power coefficient = 0 (wavelength-independent scatter) or 2.81 (wavelength-dependent scatter). These model parameters were chosen to match previously described parameters [17] for blood (wavelength-independent scatter) and skin (wavelength-dependent scatter). Four hundred nanometers was chosen as a lower limit for the simulation since ultraviolet light penetrates poorly into tissue, and 2000 nm was chosen as the upper limit due to water's extreme absorption above this wavelength.
For a scatter power coefficient of zero (i.e., wavelength-independent scatter; Figure 3B, upper), relative transmission was highly influenced by both the H2O-to-Hb ratio and tissue thickness. In particular, at a high Hb-to-H2O ratio, transmission through Bands 1, 2, and 4 decreased more rapidly than through Band 3 with increasing thickness, and at all H2O-to-Hb ratios, transmission through Band 4 had the most rapid decrease with increasing thickness. Relative transmission through Bands 1 and 2 were affected similarly by tissue thickness (significantly less than through Bands 3 and 4) in the presence of a high H2O-to-Hb ratio, and transmission through Band 3 was the least affected by tissue thickness in the presence of a high Hb-to-H2O ratio.
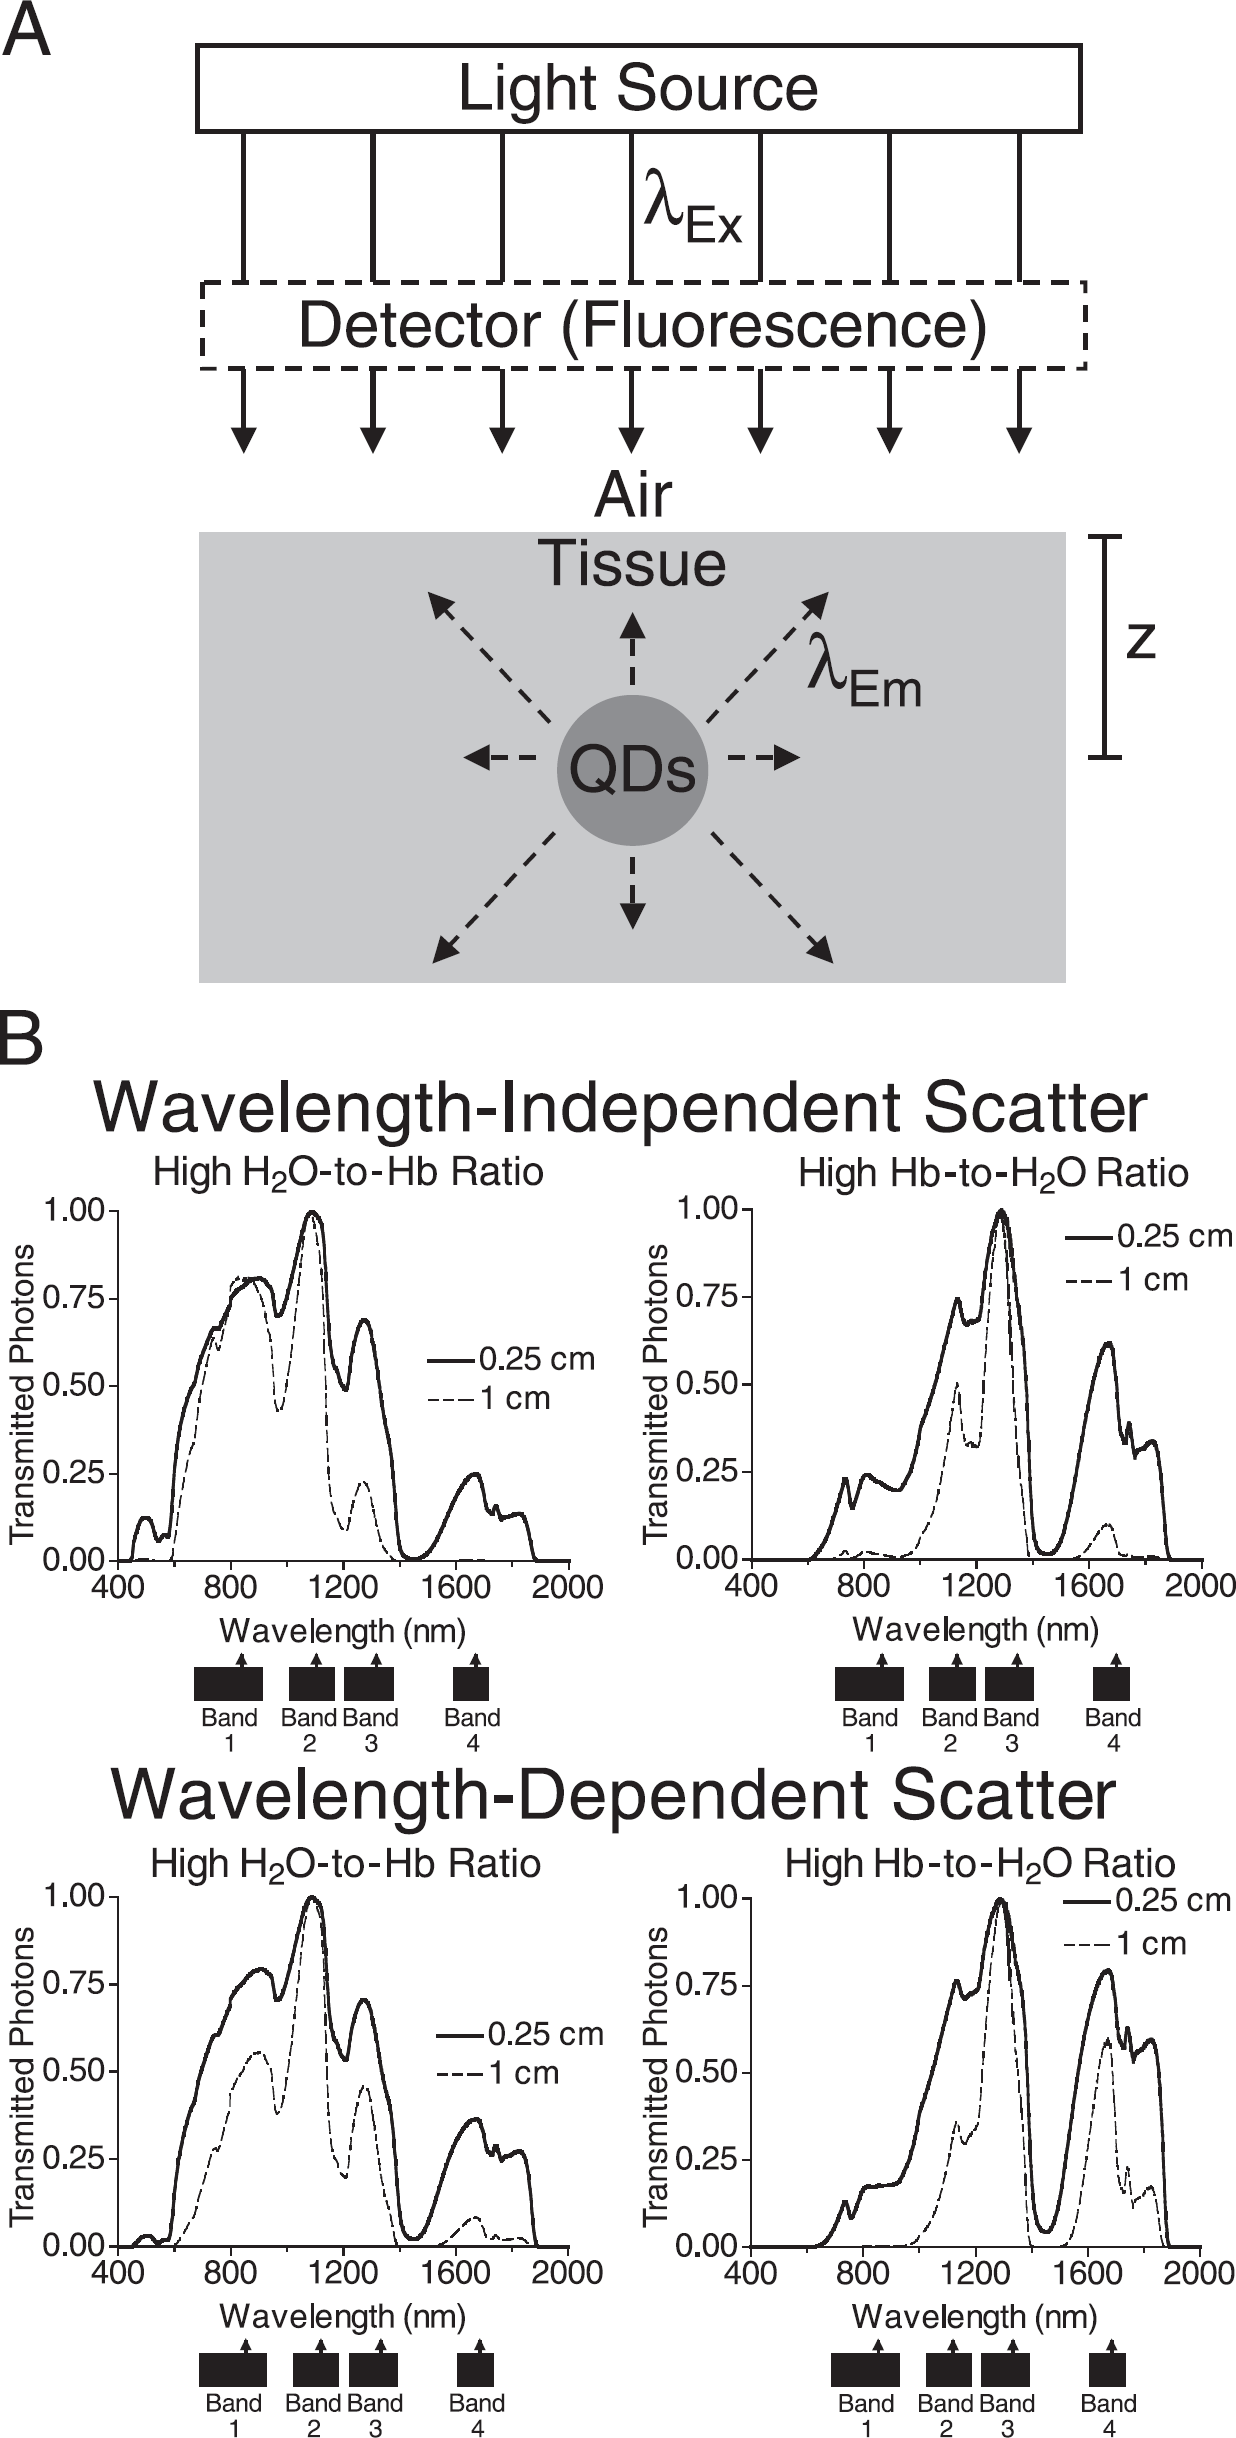
Predicted photon transmission properties of biological tissue as a function of scatter, H2O-to-Hb ratio, and thickness. (A) The illumination/detection geometry used for predicting the performance of QDs for reflectance fluorescence imaging assumes continuous wave, uniform irradiance normal to the air/tissue interface, a semi-infinite thick tissue, and a point of QDs embedded in the tissue at a given depth. Fluorescent light emitted by the QDs (dashed lines) propagates back through the tissue and is detected at 0° relative to excitation light. (adapted from [23]). (B) Using the model geometry shown in A, the relative number of transmitted photons as a function of wavelength was simulated on tissues of high H2O-to-Hb ratio (left panels) or high Hb-to-H2O ratio (right panels), at tissue thicknesses of 0.25 cm (thick solid line) or 1 cm (dashed line). Simulated tissues exhibited either wavelength-independent scatter (upper panels) or wavelength-dependent scatter (lower panels). The analysis identified four possible transmission bands (black bars below ordinate) as described in the text. The arrow above each transmission band identifies the peak QD emission wavelength used for subsequent analysis.
For a high scatter power coefficient (i.e., wavelength-dependent scatter; Figure 3B, lower), the patterns of transmission were similar to those found for wavelength-independent scatter, but overall, relative transmission favored longer wavelengths. These transmission results are consistent with previous empirical measurements [33–35] and serve to guide the choice of optimal QD emission wavelengths (see below).
Simulated Performance of Various NIR and IR QD Contrast Agents
We next simulated the performance of QDs with peak emission in Bands 1 through 4 after embedding in tissues with varying H2O-to-Hb ratios and scatter power coefficients. For simplicity, tissue thickness was fixed at 0.5 cm. QD peak emission was chosen at two thirds the width of the transmission band to provide enough bandwidth to accommodate excitation close to the emission wavelength (if needed) and the broader emission curves associated with longer wavelength QDs. To eliminate variability due to the shape of the QD absorption curve (itself a function of the semiconductor materials used and particular preparation; see Discussion) and aqueous QY (a function of the semiconductor materials and surface coating), these parameters were fixed. In particular, the shape of the QD absorption curve used in the simulation is common to many different types of QD materials ([25,36–38]; J. Steckel, unpublished data). The emission curve was simulated with a Gaussian distribution. FWHMs for 840, 1110, 1320, and 1680 nm QDs were chosen based on literature and empirical data, and were 76, 104, 145, and 235 nm, respectively. QY was fixed at 50%, and the extinction coefficient at the first absorption peak was fixed at 1 × 10⁶ M−1 cm−1. Other model parameters used for this simulation included: broadband excitation from 400 nm to the peak emission wavelength using a constant fluence rate at each wavelength, thickness 0.5 cm, water content = 75%, lipid content = 0.25 M, OxyHb concentration = 1.25 or 0.02 mM (1:1 ratio with DeoxyHb), DeoxyHb concentration = 1.25 or 0.02 mM, protein concentration = 2.5 mM, absolute scatter at 630 nm = 8.9 cm−1 (wavelength-independent scatter) or 23 cm−1 (wavelength-dependent scatter), and scatter power coefficient = 0 (wavelength-independent scatter) or 2.81 (wavelength-dependent scatter).
As shown in Figure 4, QD performance was predicted to be affected significantly by tissue optical properties. Specifically, for tissues with a high H2O-to-Hb ratio (thin solid curves), the key feature of QD excitation at bluer wavelengths was often preserved, suggesting that broadband excitation light can be used. However, at a high Hb-to-H2O ratio (dashed curves), QD excitation fell rapidly below 700 nm. When wavelength-dependent scatter was also present, excitation was further confined to a narrow band close to QD peak emission, with high similarity to the pattern of excitation typically seen using conventional fluorophores. QD emission (data not shown) was also affected significantly by tissue absorbance and scatter. Specifically, a red shift in peak emission wavelength was often seen in the presence of wavelength-dependent scatter (see also Figure 2D), and the emission of 1680 nm QDs was additionally affected by lipid absorption (not shown).
Selection of QD Excitation and Emission Wavelengths Based on Photon Yield
A direct comparison of QDs with emission centered at 840, 1110, 1320, and 1680 nm, as a function of absolute scatter and tissue thickness, is presented in Figure 5A for a high H2O-to-Hb ratio, and Figure 5B for a high Hb-to-H2O ratio. Model parameters were otherwise as described for Figure 4. Note is again made that excitation was broadband, from 400 nm to the peak emission wavelength, using a constant fluence rate at each wavelength. For simplicity, results are displayed as the ratio of the total photon yield of 1320 nm QDs relative to the others.
Over the full range of tissue H2O-to-Hb ratio, absolute scatter, scatter power coefficient, and thickness tested, 1680 nm QDs performed poorly relative to the others, mainly due to the effect of H2O absorption. In tissues with a high H2O-to-Hb ratio (Figure 5A), regardless of scatter power coefficient, 1110 nm QDs outperformed 840 and 1320 nm QDs by up to fivefold. In the presence of wavelength-dependent scatter, 1320 nm QDs outperformed 840 nm QDs, but only up to twofold.
In contrast, in the presence of a high Hb-to-H2O ratio (Figure 5B), 1320 nm QDs outperformed 840 nm QDs by 32-fold to 5 × 10³ fold, and 13-fold to 1 × 10⁶ fold, over the tested range of scatter and thickness, respectively, with the highest performance in tissues with wavelength-dependent scatter. 1320 nm QDs also outperformed 1110 and 1680 nm QDs, but by a less significant magnitude. The significance of these results for biomedical applications is discussed below.
NIR Fluorescence Imaging of the Coronary Vasculature with QDs Using Broadband White Light Excitation
Imaging of blood flowing through the coronary vasculature is of paramount importance since even brief ischemia to the myocardium can lead to infarction, and cardiac revascularization requires assessment of vessel patency. We have previously developed an intraoperative NIR fluorescence imaging system that can be used with conventional fluorophores such as indocyanine green and IRDye78 for real-time assessment of coronary vasculature in beating hearts [16]. Conventional fluorophores, however, absorb in a relatively narrow wavelength band, and typically require a separate NIR (770 nm) laser light source for excitation. We therefore asked whether NIR QDs could be used in place of conventional fluorophores for vascular imaging, and whether a single white light source could replace laser excitation, and be used for both standard illumination and QD fluorescence excitation.

Predicted absorbance of NIR and IR QDs as a function of tissue scatter, H2O-to-Hb ratio, and thickness. Absorbance scans for various QDs embedded in tissue with either wavelength-independent scatter (left panels) or wavelength-dependent scatter (right panels) were simulated as described in the text. Simulations were run in the presence of PBS only (thick solid line) or in the presence of 0.5 cm of tissue with a high H2O-to-Hb ratio (thin solid line) or a high Hb-to-H2O ratio (dashed line) as described in the text. QD peak emission is shown along the left edge of the page. Data are normalized for display on a single ordinate.
Figures 2C, 3, and 4 suggest that for tissues with wavelength-independent scatter and a high Hb-to-H2O ratio, such as blood, QDs with a peak emission within transmission Band 1 might perform well, provided that tissue thickness is minimal. To choose a QD emission wavelength optimal for the silicon-based CCD camera available to us, the model in spreadsheet format was used to compare QDs spanning Band 1. It was determined (data not shown) that QDs having peak emission at 752 nm would maximize the number of photons collected by the camera, and these particular NIR QDs were synthesized as described above.

Comparison of NIR and IR QD performance as a function of tissue scatter, H2O-to-Hb ratio, and thickness. (A) Comparison of final photon yield of 840, 1110, 1320, and 1680 nm emitting QDs, as a function of tissue scatter and thickness, in tissue with a high H2O-to-Hb ratio. Simulated tissues exhibited either wavelength-independent scatter (upper panels) or wavelength-dependent scatter (lower panels). To determine the effect of scatter (left panels), tissue thickness was fixed at 0.5 cm. To determine the effect of tissue thickness, absolute scatter at 630 nm was fixed at 8.9 cm−1 (wavelength-independent scatter) or 23 cm−1 (wavelength-dependent scatter), and the scatter power coefficient fixed at either 0 (wavelength-independent scatter) or 2.81 (wavelength-dependent scatter). On the ordinate is shown the photon yield as a ratio of 1320 nm QDs to either 840 nm QDs (thick solid line), 1110 nm QDs (thin solid line), or 1680 nm QDs (dashed line). (B) The simulation described in B was repeated in tissue with a high Hb-to-H2O ratio.

NIR fluorescence imaging of the coronary vasculature using NIR QD contrast agents. (A) The absorbance (thick black line) and photoluminescence (dashed line) of 752 nm QDs embedded in 282 mm of whole blood was simulated using the model described in the text. Shown below the abscissa (black bar) is the broadband wavelength range used for general illumination and QD fluorescence excitation (400 to 700 nm). (B) Using the intraoperative NIR fluorescence imaging system described in Materials and Methods, the coronary vasculature of a beating rat heart was imaged before and after intravenous injection of 2.5 nmol of 752 nm emitting QDs. Shown are the color video image (upper left panel), preinjection NIR autofluorescence (upper right panel), postinjection NIR fluorescence (lower left panel), and pseudocolor merged image of the color video and postinjection NIR fluorescence images (lower right panel). Illumination and fluorescence excitation were from the same broadband white light source as shown in A. NIR fluorescence images have identical exposure times (25 msec) and normalization.
Shown in Figure 6A is the simulation of 752 nm QDs embedded in arterial blood. Since the average coronary vessel diameter of the rat heart is only 282 μm [39], we hypothesized that 752 nm QDs could be excited with broadband white light of 400 to 700 nm, that is, the same light used to illuminate the surgical field. Indeed, our analysis suggested that over 75% of absorbed photons would be contained within the 400–700 nm band. Moreover, the relatively thin coronary vessels of the rat heart were not predicted to degrade emission signal (Figure 6A). These predictions appear to have been reasonable since intravenous injection of only 2.5 nmol of 752 nm emitting NIR QDs into the rat, and broadband white light excitation at a total fluence rate (i.e., the integral of 400 to 700 nm light) of only 2.0 mW/cm2, resulted in an NIR fluorescence signal of the coronary vasculature with an over 5:1 signal to background ratio for a 25-msec exposure (Figure 6B). This same signal-to-noise would require injection of 2.5 nmol of the conventional fluorophore IRDye78-CA and irradiation with a 771-nm laser at a fluence rate of 12.5 mW/cm2 [16]. These data suggest that, under certain conditions, NIR QDs may perform well as in vivo vascular contrast agents using inexpensive white light excitation and a relatively low fluence rate.
Discussion
The goal of this study was to better understand how tissue absorbance, scatter, and thickness might affect the performance of QDs when embedded in biological tissue and used as contrast agents for biomedical assays and imaging. We have assumed throughout our analysis that the excitation fluence at the QDs is within their linear response regime, and well below their saturation limit. We estimate the saturation limit of 840 nm QDs to be on the order of ~1 kW/cm2, and from Fermi's golden rule, ~0.25 kW/cm2 for 1320 nm QDs. Indeed, the vascular imaging data of this article were obtained with an external excitation fluence rate of only 2.0 mW/cm2. Our analysis was necessitated by the observation that biological tissue has a dramatic filtering effect on QD absorbance (Figures 2B-D). Using a previously validated mathematical model that fits well the geometry of reflectance fluorescence imaging, we were able to formulate testable hypotheses regarding the selection of QD wavelengths for biomedical applications. Our data suggest that the magnitude of tissue scatter, the scatter power coefficient, tissue thickness, and the ratios of absorbing components can have profound effects on QD excitation and emission wavelength choice. Despite the complexity of a model with many independent variables, several generalizations can be inferred from the data.
In tissues with a high H2O-to-Hb ratio and either wavelength-independent scatter (e.g., postmenopausal breast [17,18]) or wavelength-dependent scatter (e.g., skin [17]), the unique and desired property of QDs, namely, increasing excitation at bluer wavelengths, is largely preserved (Figure 4, solid line), and QDs emitting in Bands 1, 2, or 3 (Figure 5A) should perform well, with a slight overall advantage for Band 2.
In tissues with a high Hb-to-H2O ratio (e.g., blood), regardless of scatter type, 1320 nm QDs outperform 840 nm QDs by up to several orders of magnitude over a wide range of tissue thickness and absolute values of scatter. Importantly, QD excitation is also often severely constrained to a narrow band very close to the peak emission wavelength (Figure 4). Hence, under these conditions, the pattern of QD excitation is strikingly similar to that of conventional fluorophores. The emission properties of QDs embedded in tissue with wavelength-dependent scatter also differ markedly from nonembedded QDs, with a red shift of peak emission under many conditions (data not shown).
The results of this study span the extremes of tissue characteristics, from a high Hb-to-H2O ratio and wavelength-independent scatter (e.g., blood [17]) to a high H2O-to-Hb ratio and wavelength-dependent scatter (e.g., skin [17]). Hence, most tissues will have characteristics between these two extremes. Although the model data suggest that QD excitation and emission wavelengths should be chosen based on the specific tissue(s) being imaged, the data also suggest that Band 3 QDs may provide the best overall performance for most biomedical applications. When compared to 840 nm QDs, 1320 nm QDs are predicted to provide a large improvement in photon yield in tissues such as blood. This result is significant since conventional fluorophores presently being used for biomedical imaging and assays typically have emission within Band 1 (i.e., the “near-infrared window” as defined by Chance [40]). For instance, Cy7, IRDye78, and indocyanine green emit in the 700 to 830 nm range. Our results suggest that Band 3 QDs may greatly outperform Band 1 QDs and conventional fluorophores in many tissues. These improvements may be even more pronounced when considering the typically higher QY of NIR and IR QDs over conventional fluorophores and their possible insensitivity to photobleaching. The emission curves for Band 3 QDs also fall completely within the sensitivity curve of commercially available indium-gallium-arsenide (InGaAs) cameras, making such imaging practical.
It should be noted that the conclusions of this study are not significantly affected by model geometry. When the simulations were run using an analytical solution to the diffusion equation that utilizes a point light source, rather than uniform irradiance [41], similar results were obtained (data not shown). The conclusions also appear to remain valid when single wavelength excitation, rather than broadband excitation, is used. For example, 1320 nm QDs are predicted to retain over 65% of their higher photon yield compared with 840 nm QDs when both are excited at their respective first excitation peak (data not shown).
To prove the utility of these simulations, we used the results to design, produce, and characterize 752 nm NIR QDs specifically tailored for imaging rat coronary vasculature with a silicon CCD camera. The simulation suggested that broadband white light could be used for efficient excitation of such QDs (Figure 6A), and indeed, this appears to be the case (Figure 6B). The ability to predict that inexpensive broadband light sources of low fluence rate can be used in particular applications may help to minimize system engineering and equipment costs.
To simplify the above analysis, the shape of the QD absorbance curves, extinction coefficient at the first absorbance peak, and QY were held constant among the various NIR and IR QDs. Of course, the choice of semiconductor material will greatly impact the QD absorbance curve, emission wavelength, particle size, and QY [42]. The shape of the absorbance curve, in particular, will be a strong function of the materials used, and even of the purity of the particular QD preparation. In our experience, however, the shape difference between materials such as CdSe [25], CdTe [43], and PbSe [44] had little overall effect when other variables were held constant, and the spreadsheet format of the model made comparative simulation of QD materials straightforward. It should be emphasized that the predictions of our study can be tested immediately. The literature already provides semiconductor material choices and synthetic strategies for QDs emitting within Band 1 (CdTe [43,45] and InP [1]), Band 2 (InAs [36,37]), Band 3 (HgTe [46,47] and PbSe [44]), and Band 4 (HgTe [46,47] and PbSe [44]).
We are hopeful that the above analysis, and the availability of the model as a spreadsheet, will permit QD wavelengths to be chosen rationally, before the laborious process of QD production is initiated. Although we predict that the absorption advantage of QDs can be lost once embedded in certain biological tissue, the tunability of QDs to optimal wavelengths remains a feature of paramount importance, and is predicted to result in significant improvements in photon yield over the conventional fluorophores now being used.
Of course, even after choice of optimal excitation and emission wavelengths, it remains to be seen how surface coating, QY, in vivo chemical stability, in vivo photostability, toxicity, and pharmacokinetics will impact the use of QDs as contrast agents for biomedical applications. To date, there are no published reports on the toxicity of QDs after in vivo administration, and many of the semiconductor materials cited above are known toxins when free in solution. Their toxicity when complexed as nanocrystals remains to be determined. The oligomeric phosphines used for capping in this study appear to have preserved photostability, at least after initial contact with plasma. Clearly, the surface coating of QDs will be of paramount importance with respect to imparting aqueous solubility, minimizing nonspecific tissue interactions, and maximizing quantum yield. Future studies will undoubtedly be directed towards addressing these issues.
Footnotes
Acknowledgments
We thank Lev T. Perelman (BIDMC) and Jeffrey S. Souris (University of Pennsylvania) for many helpful discussions. We thank Jonathan Steckel for assistance with QD preparation; Elisabeth L. Shaw (MIT CMSE), John C. Hahn (Varian), and Alec M. DeGrand (BIDMC) for technical assistance; and Grisel Rivera for administrative assistance. This work was supported by the Post-Doctoral Fellowship Program of the Korea Science and Engineering Foundation (KOSEF). This work was also supported in part by the NSF-Materials Research Science and Engineering Center program under grant DMR-9808941 (M. G. Bawendi), by the Office of Naval Research (M. G. Bawendi), the Stewart Trust of Washington, DC (J. V. Frangioni), Department of Energy (Office of Biological and Environmental Research) DE-FG02-01ER63188 (J. V. Frangioni), and NIH R21 EB-00673 (J. V. Frangioni and M. G. Bawendi). Nonanimal experiments were also supported by a Clinical Scientist Development Award of the Doris Duke Charitable Foundation (J. V. Frangioni).