
Abstract
We generated a transgenic mouse model (RIP-luc) for the in vivo monitoring of pancreatic islet mass and function in response to metabolic disease. Using the rat insulin promoter fused to firefly luciferase, and noninvasive technology to detect luciferase activity, we tracked changes in reporter signal during metabolic disease states and correlated the changes in luciferase signal with metabolic status of the mouse. Transgene expression was found to be specific to the pancreatic islets in this transgenic model. Basal transgene expression was tracked in male and female mice fed either a chow or a high-fat diet and in response to treatment with streptozotocin. Pancreatic bioluminescent signal increased in mice fed a high-fat diet compared with chow-fed animals. In a model of chemically induced diabetes, the bioluminescent signal decreased in accordance with the onset of diabetes and reduction of islet β-cell number. Preliminary studies using islets transplanted from this transgenic model suggest that in vivo image analysis can also be used to monitor transplanted islet viability and survival in the host. This transgenic model is a useful tool for in vivo studies of pancreatic β-cells and as a donor for islet transplantation studies.
Introduction
Tracking and monitoring of pancreatic β-cell mass and function during the progression of diabetes is a significant problem in studying the pathophysiology of this disease in animal models. Although changes in circulating insulin or C-peptide levels during an arginine potentiation of the acute insulin secretory response [1] or the response to an oral glucose tolerance test or an insulin tolerance test are correlated with functional islet mass [2], these procedures are invasive and difficult to repeatedly administer to a small animal in order to track changes in islet mass and functional activity over time. Histochemical methods require significant numbers of animals in order to follow changes over time because animals would need to be evaluated at multiple time points over the course of a study. A method for noninvasively following β-cell mass and/or function is clearly needed to facilitate our understanding of the cellular changes that precede the onset of frank disease [3]. The development of bioluminescent optical imaging for research and clinical applications would be a great addition to established methods, such as MRI and PET, and would help to track transplanted islets and monitor islet mass. One candidate approach for this method is to use a constitutive reporter gene expressed solely in pancreatic β-cells. For example, one could use the CRE recombinase system, driven by a β-cell-specific promoter such as the insulin promoter, to activate a presumed constitutive reporter such as that derived from the cytomegalovirus (CMV). However, the CMV promoter is in fact regulated by transcription factors and methylation in mammalian cells [4–6], and we have also observed (unpublished data) that a CMV-luc transgene is much less active in pancreatic islets. An alternative approach would be to use a β-cell-specific promoter that could be used to monitor not only β-cell mass but also some aspects of function. One candidate gene for this approach is the insulin gene.
Analysis of insulin gene transcriptional regulation has relied on examination of tissue homogenates, cell culture studies, and in vitro assays. These assays have elucidated regulatory regions in the mouse, rat, and hamster insulin gene promoter regulated by the transcription factors Pdx1, BETA-2, Pax6, Nkx2.2, and C/EBPβ [7–11]. The identified promoter regions were determined to be involved in insulin gene transcription in vitro and the control of pancreas development and β-cell-specific gene expression. Even in dramatic models of hyperglycemia [10,12], relatively modest changes in insulin transcription were observed. Although the induction of the insulin gene is mild to moderate with significant hyperglycemia, similar modulations of glucose result in highly significant increases in insulin secretion in rats and mice [13,14]. These studies have concluded that the major regulator of insulin gene transcription is glucose level in the medium. Factors other than glucose also certainly regulate insulin gene expression. For example, leptin infusion was found to inhibit insulin mRNA levels and protein secretion in ob/ob mice and in the β-cell-derived INS-1 cell line [15].
The rat insulin promoter (RIP) has been used extensively for pancreatic β-cell-specific transgene expression [8–11,16,17], including the use of the CRE recombinase–loxP system to inactivate genes specifically in the pancreas [18]. The RIP-Tag transgene, driving β-cell-specific expression of the small T antigen, has served as a useful tool for the study of murine pancreatic tumors [17]. Cell-based RIP–reporter systems have also investigated transcriptional modulation due to culture conditions [15,19,20]. Because the RIP–reporter system has been used previously and has been shown to be pancreatic β-cell specific, we decided to use this promoter to develop a model for tracking pancreatic β-cell mass/function noninvasively. By fusing the rat insulin promoter with the coding sequence for firefly luciferase, we created a transgenic mouse model (RIP-luc) that could be used for this purpose.
Real-time in vivo biophotonic image analysis of mice expressing luciferase has been used to noninvasively characterize the response to drug treatments, disease progression, and other biological events [21–24] in transgenic mice. We found the RIP-luc transgene expression to be stable over time in adult mice during chow feeding and to increase during high-fat feeding as the mice gained weight. The luciferase signal also diminished following streptozotocin (STZ) treatment, and this diminution correlated with the loss of glucose metabolic control, insulin production, and islet β-cell mass. Perifusion studies using isolated islets from FVB/N control and RIP-luc mice demonstrated the presence of the transgene did not alter glucose-stimulated insulin secretion. Transplantation studies demonstrate that pancreatic islets transplanted from RIP-luc donor mice to diabetic recipient animals function to control blood glucose levels, and their transplant location and functional islet number can be tracked by their biophotonic signal. Our results indicate the value of this RIP-luc in vivo imaging model for metabolic disease research and transplantation studies.
Research Design and Methods
Molecular Biology
The FVB/N-Tg(RIP-luc)Xen (abbreviated in the text as RIP-luc) transgenic mice were generated by DNA microinjection into FVB/N donor embryos and maintained in the FVB/N background. The RIP-luc transgenic construct was generated using a 780-bp fragment of the previously described [17] rat insulin promoter that was cloned into the pGL3-Basic vector (Promega, Madison, WI). An 800-bp fragment containing the human Globin Intron II cloned from human genomic DNA was then inserted between the RIP region and the luciferase gene. Fluorescent in situ hybridization, using a 1-kb cDNA fragment of the luciferase gene, was performed to determine the chromosomal localization of the RIP-luc transgene (Incyte Inc., Palo Alto, CA).
Animals
All experimental protocols were approved by the Institutional Animal Care and Use Committee of Xenogen Corporation or Northwestern University and conformed to principles in the Guide for the Care and Use of Laboratory Animals [25]. RIP-luc hemizygous mice were group-housed in Technoplast microisolator caging and fed either standard pelleted rodent chow (Dean's Animal Feeds, Belmont, CA) or a high-fat diet (D12492; 30% fat by weight; Research Diets Inc., New Brunswick, NJ). Water was available ad libitum and food was also supplied ad libitum except during fasting. The light/dark cycle was 12-hr on and 12-hr off, with lights on at 0700 hours, and room temperature was maintained at 25°C. Transgenic mice are maintained as hemizygotes by mating transgenic males with FVB/N nontransgenic females. For all studies, mice were fasted for 5 hr (0830–1330 hours) prior to image collection to ensure that all animals were at a similar postprandial absorptive state.
In Vivo Bioluminescent Imaging Parameters
In vivo imaging was performed by using the IVIS® Imaging System 100 Series (Xenogen Corp., Alameda, CA). The left side and ventral regions of the animals were shaved prior to luciferin injection and image collection in order to maximize luciferase signal detection, improve image resolution, and reduce signal variability. During image collection, the animals were placed on their right side, with their left side facing the camera for optimal detection of the pancreatic luciferase signal. Animals were anesthetized with isoflurane prior to luciferin injection (150 mg/kg body weight ip). Photons per second emitted from regions of interest (ROIs) encompassing the pancreas region were drawn on the bioluminescent images and quantified using Living Image® software (Xenogen Corp.). Optimal luciferase signal intensity of RIP-luc animals was detected between 10 and 20 min following luciferin injection. Bioluminescent pseudocolor images displayed in the text are shown superimposed on photographic images of the mice, with the most intense detected luciferase signal shown as red and the weakest signal shown as blue.
Enzyme Assays
Blood was collected from tail tips and glucose was measured with a handheld glucose analyzer (One Touch Ultra, LifeScan Inc., Milpitas, CA). Plasma C-Peptide and insulin levels were quantified by the Hormone Assay Core Facility at Vanderbilt University (Nashville, TN) by an RIA method. Pancreata were frozen in liquid nitrogen immediately following dissection and homogenized using a tissue homogenizer (Dremel Inc., Racine, WI) in PBS containing protease inhibitors (Roche Diagnostics GmbH, Mannheim, Germany). Tissue luciferase assays were performed on pancreas homogenates by using a reagent kit from Pierce Inc. (Rockford, IL) and measured with a luminometer (TD 20/20, Turner Designs, Sunnyvale, CA). The protein content of pancreatic tissue homogenates was determined with a bicinchoninic acid (BCA) reagent kit (Pierce Inc.) according to the manufacturer's directions. Luciferase assay results, in relative light units (RLUs), were correlated to pancreatic tissue homogenate protein content.
Baseline In Vivo Transgene Expression
Groups of male and female chow-fed mice were studied to determine the day-to-day variation in RIP-luc expression. During the baseline chow-fed study, animals were fasted for 5 hr, then weighed and imaged for transgene expression three times per week over a 20-day period. Blood glucose was measured once per week, following the fast.
High-Fat Feeding Study
To examine expression of the RIP-luc transgene in a rodent model of obesity, biophotonic imaging was performed on cohorts of mice fed either a high-fat diet or chow diet over a 20-day period. Animals from the baseline study were divided into control and study groups. Groups were selected to have similar mean transgene expression levels, body weights, and blood glucose levels at the start of the study. As with the chow feeding study, animals were weighed and imaged following a 5-hr fast three times per week, and blood glucose was measured once per week. At the conclusion of the study animals were euthanized and fat pads (subcutaneous inguinal, reproductive, and retroperitoneal) were dissected and weighed.
Inspection of the high-fat feeding effects revealed that (1) measurements were stable during the baseline (pretreatment) interval and (2) the majority of high-fat feeding effects occurred within the first few days and remained relatively constant thereafter. This suggests that the statistical power for detecting change should be increased by averaging the measurements within each mouse for each condition. Thus, luciferase expression change due to high-fat feeding was calculated as the average of the values during high-fat feeding (e.g., the average of Days 23 through 40) minus the average of the pretreatment values (e.g., the average of Days 0 through 20).
Pancreatic Islet Isolation and Perifusion
Pancreatic islets were isolated from wild-type FVB/N and RIP-luc mice by collagenase digestion and handpicking as previously described [26]. After culturing the islets overnight in RPMI + 10% fetal calf serum, insulin secretion was analyzed in a cell perifusion apparatus in response to glucose (16.8 mM), 0.045 mM isobutylmethyl xanthine, and tolbutamide (100 mM) stimulation [27].
Streptozotocin Treatment
Insulin deficient diabetes was induced in male mice by a single dose of freshly prepared STZ (Sigma Chemical Co., St. Louis, MO) at 175 mg/kg ip in ice-cold 0.5 M citrate buffer (pH 4.5). Control mice were injected ip with citrate buffer only. Study groups were initially selected based on results of five imaging sessions over a 2-week period to ensure that the groups were matched for in vivo luciferase expression levels. The mice were followed up for 3 weeks following STZ treatment, during which they were weighed, and biophotonic imaging was performed after a 5-hr fast three times per week. Blood glucose was measured once per week. Twenty-one days following treatment, mice were euthanized and the pancreata were removed to assess tissue insulin and glucagon content by immunohistochemistry.
Histology
Pancreatic tissues were prepared and insulin and glucagon were quantified as previously described [27]. Briefly, dissected tissue was rinsed in cold 10 mM PBS and transferred to 4% neutral buffered formalin, then equilibrated in 30% sucrose in PBS overnight. Adult pancreata, fixed in freshly prepared 4% paraformaldehyde, were cryopreserved at −80°C in optimum cutting temperature compound (VWR Scientific Products, Willard, OH), and 10-μm sections were mounted on charged slides. Cryosections were permeabilized in 0.2% Triton X-100 for 10 min at room temperature, blocked with 5% normal donkey serum (Jackson ImmunoResearch Laboratories, Inc., West Grove, PA) for 1.5 hr, and then incubated with primary antibodies to insulin (1:1000, anti-human insulin IgG, Linco Research, St. Charles, MO) and glucagon (1:10,000 rabbit antiglucagon, Linco Research) overnight at 4°C. Secondary antibodies, conjugated with Cy2 (insulin) or Cy3 (glucagon) from Jackson ImmunoResearch Laboratories were applied to tissue sections for 1 hr at room temperature as recommended by the manufacturer. Both primary and secondary antibodies were diluted in 10 mM PBS containing 1% BSA and 0.1% Triton X-100. Digital images of the cryosections mounted with AquaPoly/Mount were acquired with a MagnaFire™ digital camera (Optronics, Goleta, CA) connected to an Olympus BX-41 fluorescence microscope (Olympus America Inc., Melville, NY) and analyzed for insulin-staining or glucagon-staining area using Metamorph 5.0 software (Universal Imaging Corporation, Downington, PA).
Intrahepatic Islet Transplantation
Whole islets from RIP-luc mice were isolated and purified using a standard mouse islet isolation procedure [28]. Briefly, each animal was anesthetized by an intraperitoneal injection of avertin (0.015 ml/g 2% tribromoethanol, Fluka Chemical, Switzerland). Midline laparotomy was performed and a clamp placed across the duodenum at the level of the common bile duct. The duct was then cannulated and a cold solution of collagenase (13.0 mg/mouse, Type XI, Sigma) in plain Hank's balanced salt solution (Gibco-BRL, Grand Island, NY) was injected into the duct. The pancreas was then removed and subjected to a stationary digestion at 37°C for 15 min. The resultant digestate was applied to a discontinuous dextran (Sigma) gradient. Islets were handpicked from the resulting purification media and cultured for 1 hr prior to transplant at 37°C and 5% CO2 in RPMI 1640 (Gibco-BRL) supplemented with 10% heat inactivated fetal calf serum (Hyclone, Logan, UT), 100 U/ml penicillin G (Gibco-BRL), 100 μg/ml streptomycin sulfate (Gibco-BRL), and 1 mM L-glutamine (Gibco-BRL). About 300 islets were used per mouse for intrahepatic islet transplantation. For the transplant, isogeneic regular FVB/N (H-2q) strain mouse recipients (Jackson Labs, Bar Harbor, ME) were used. The recipient mice had been pretreated with STZ approximately 1 week prior to transplant and had fasting plasma glucose levels of approximately 350 mg/dl at the time of transplant. Mice were anesthetized with isoflurane and injected with avertin to maintain anesthesia. A long midline incision on the mouse abdominal wall was performed. After the portal vein was identified, mouse islets suspended in saline were injected very slowly into the portal vein with a 25-gauge butterfly needle attached to a syringe. The abdominal incision was closed in two layers with 5-0 absorbable Maxon® suture.
On Day 7 post islet transplantation, the recipient mice were anesthetized with isoflurane and given a dose of luciferin (100 μg/g body weight ip). Mouse luminescence images in four (dorsal, ventral, left, and right) positions were taken between 10 and 20 min after the injection of luciferin. Acquisition time was 1 min for each image taken.
Statistical Analysis
Data are presented in text and figures as mean and standard error of the mean. Statistical analyses were performed by use of Student's t test and analysis of variance (ANOVA; StatView®, SAS Institute, Cary, NC), with p = .05 considered as significant. Significant levels were calculated from two-way ANOVA that tested for significant main effects (treatment, sex) and interactions (sex by treatment). None of the variables revealed a significant sex by treatment interaction, so the significance levels for treatment and sex are presented without the interaction.
Results
Chromosomal Localization, Imprinting, and Transgene Expression
A number of mice that tested positive for the RIP-luc transgene by PCR were found to consistently have little or no luciferase activity following luciferin injection. Transgenic offspring from a male transgenic parent are more likely to have a high level of luciferase expression than offspring of a female transgenic parent (99 high and 14 low expressors from male RIP-luc parents; 24 high and 77 low expressors from female RIP-luc parents). High-expressing mice had luciferase activity greater than 5 × 10⁵ photons/sec in their pancreatic ROI. The parental gender effect on transgene activity could be due to imprinting of the transgene [29]. Because of this observation, we exclusively used mice sired by male transgenic carriers in our studies. The RIP-luc transgene was found to be integrated on chromosome 6 between regions 6D2 and 6E1, as identified by fluorescent in situ hybridization (data not shown). Luciferase expression from the RIP-luc construct occurs primarily in the pancreas of adult mice. We observed that this signal came from the islets within the pancreas and it was not observed in exocrine tissue. However, we have not yet determined within an islet if the luciferase signal is specific to the β-cells. We also observed low levels of ectopic RIP-luc expression in the gonads of RIP-luc mice, with the strongest extrapancreatic signal observed in mice at 3 weeks of age and decreasing as the mice aged until the signal disappeared by 8 weeks of age (data not shown).
Day-to-Day Variability of Luciferase Signal
RIP-luc transgene expression, body weight, and blood glucose level were followed in a group of 9 male and 13 female age-matched adult mice for 20 days. Body weights of all animals increased approximately 3% during this chow-feeding study (significance of slope p = .001, Figure 1A). The luciferase signal intensity was stable over the course of the chow-feeding analysis (significance of slope p = .94, Figure 1B). Within groups of 10- to 14-week-old mice of each sex the average daily in vivo bioluminescent pancreatic signal for chow-fed male mice was found to be (1.33 ± 0.13) × 106 photons/sec (n = 9), whereas in females it was measured as (1.31 ± 0.09) × 106 photons/sec (n = 13) (mean ± SEM). Day-to-day variability of luciferase signal for individual male and female mice is generally less than 10%. Plasma glucose levels remained constant for the chow-fed male and female mice over the course of the chow feeding period (p = .17).
Response to High-Fat Feeding
Body weight, blood glucose levels, and RIP-luc transgene expression were followed for 20 days in mice from the above studies while fed either standard laboratory chow or a high-fat diet. As anticipated, male (n = 5) and female (n = 7) mice fed the high-fat diet gained weight during the study (3.0 ± 1.5 and 1.2 ± 1.4 g, respectively), whereas the chow-fed males (n = 4) and females (n = 6) gained less weight (0.7 ± 0.5 and 0.1 ± 0.5 g, respectively) (Figure 1A). The change in weight between the experimental period (i.e., the average weight for Days 23 to 40) and the baseline period (i.e., the average weight for Days 6 through 20) was significantly greater in mice fed the high-fat diet than those fed the chow diet (p = .01 males and females combined; adjusted for sex). At the conclusion of the study, fat pads were dissected and weighed. The combined weights of three fat depots (subcutaneous, reproductive, and retroperitoneal) were found to be significantly greater in high-fat-fed male and female mice as compared to their chow-fed cohorts (male: 2.96 ± 0.49 g for high-fat, 1.32 ± 0.17 g for chow, p = .05; female: 1.59 ± 0.15 g for high-fat, 0.93 ± 0.09 g for chow, p = .01).

Body weight and RIP-luc basal expression and response to high-fat feeding. Mice were examined for 20 days while fed chow diet, then groups were fed either a chow or high-fat diet for the subsequent 20 days. High-fat-fed mice gained more weight than the chow-fed animals during the 20-day period (A; p= .05 for both genders). Male and female image analysis data were combined (B), demonstrating the trend of increased bioluminescence in high-fat-fed mice associated with body weight gain (p = .05 for both genders). (C) Luciferase image analysis data for male and female mice in both diet groups were examined as averages of the last three images when all mice were fed chow diet (average of Days 14–20) and the last three images when mice were fed either chow or high-fat diets (average of Days 33–40). For both male and female mice, high-fat feeding significantly increased the bioluminescent signal relative to chow-fed mice (*p = .05). Males fed chow diet: n= 4; males fed high-fat diet: n = 5; females fed chow diet: n = 6; females fed high-fat diet: n = 7. Mice were 8 weeks of age at the start of the study. Data shown as mean and SEM. Mice were fasted for 5 hr prior to performing assays.
The RIP-luc signal increased in both male and female mice fed the high-fat diet over the course of the study as compared to the chow-fed animals (Figure 1B, C; males: p = .023; females: p = .031). Changes in RIP-luc signal were strongly correlated with changes in total weight (R = 0.74, p = .0002 when adjusted for sex and treatment status). Subcutaneous and retroperitoneal fat depots measured at the end of the study correlated significantly with changes in RIP-luc signal between baseline and the experimental diets (R = 0.60 and 0.65, respectively, p = .005 for both).
Blood glucose increased slightly in male mice fed the high-fat diet for 20 days as compared to the chow-fed mice, but the change was not statistically significant (273.4 ± 18.8 vs. 224.5 ± 11.6 mg/dl for high-fat and chow fed males, respectively; p = .08). In females, blood glucose levels were approximately the same for both diet groups after the 20-day diet-feeding period (163.2 ± 7.3 vs. 170.1 ± 12.0 mg/dl for high-fat- and chow-fed females, respectively; p = .64). Serum insulin, as determined by circulating C-peptide levels, was found to be slightly elevated in the high-fat-fed animals after 20 days of feeding (2.04 ± 0.49 and 1.49 ± 0.47 ng/ml for males fed high-fat and chow diets, respectively; 0.82 ± 0.10 and 0.54 ± 0.07 ng/ml for females fed high-fat and chow diets, respectively), but these changes did not achieve statistical significance in male (p = .36) or female mice (p = .40).
Pancreatic Islet Function
Expression of the RIP-luc transgene did not alter a glucose-stimulated insulin secretion perifusion assay examining isolated islets from FVB/N control and RIP-luc transgenic mice (Figure 2). Fasting glucose values were also normal in transgenic mice indicating normal insulin secretion in vivo (data not shown).
Response to Streptozotocin Treatment
Age-matched male RIP-luc transgenic mice were treated with either STZ (175 mg/kg body weight, n = 9) or a similar volume of citrate buffer alone (n = 10). Weight, blood glucose levels, and RIP-luc signal were measured three times per week for 3 weeks and C-peptide was measured at the beginning and end of the study.
The STZ-treated mice became hyperglycemic, with blood glucose levels increasing significantly (p = .001 relative to controls) to greater than 400 mg/dl within 2 days of treatment (Figure 3A). RIP-luc bioluminescence was found to drop from the baseline levels, diverging from the control animals after 2 days (p = .01; Figure 3B, C). The average bioluminescent signal for the STZ-treated mice between Day 2 and Day 21 of the experiment was 0.86 × 10⁶ photons/sec, whereas the average signal for control mice was 3.6 × 10⁶ photons/sec. The STZ-treated mice also lost more weight (−2.7 ± 0.3 g) than the control animals (−0.2 ± 0.3 g, p = .0001; Figure 3D) over the study period.
At the conclusion of the study the mice were euthanized and pancreata were harvested. We found that luciferase enzyme activity was reduced in pancreatic extracts from STZ-treated animals as compared to the control mice [0.74 ± 0.19, n = 7 vs. 8.90 ± 2.31 RLU sec−1 (mg protein)−1; n = 6; p = .01]. This result correlates with the observed decrease in transgene signal detected by in vivo biophotonic imaging. Serum C-peptide levels were significantly lower in the treated mice (0.39 ± 0.07 ng/ml, n = 8 for STZ-treated vs. 1.17 ± 0.08 ng/ml, n = 10 for controls p = .001). Pancreas histopathogy analysis, correlating β-cell health and insulin content, revealed a decrease in insulin staining in islets of STZ-treated mice (Figure 3E, F). The mean ratio of insulin-positive (beta) cells to glucagon-positive (alpha) cells was calculated from morphometric analysis of six to nine islets per pancreatic section from control (n = 4) and STZ-treated (n = 3) mice. In this analysis, islets of STZ-treated animals were found to have greater than 90% reduction in the ratio of insulin/glucagon staining cells as compared to islets from the control animals (1.05 ± 0.25 vs. 13.35 ± 1.10 beta/alpha cell ratio, p = .01 determined by paired t test).

Insulin secretion by isolated pancreatic islets. Islets from wild-type FVB/N (35 islets) or RIP-luc mice (36 islets) were analyzed for insulin secretion in a cell perifusion system. Insulin (y axis) in each 3-min perifusion sample (x axis) was assessed by radioimmunoassay. The glucose concentration of the perifusate and the concentration of the chemicals (isobutylmethyl xanthine or tolbutamide) used to stimulate insulin secretion are shown in the bar at the top of the graph of representative data from individual islet preparations. There was no difference in the response of wild-type FVB/N islets versus RIP-luc islets.
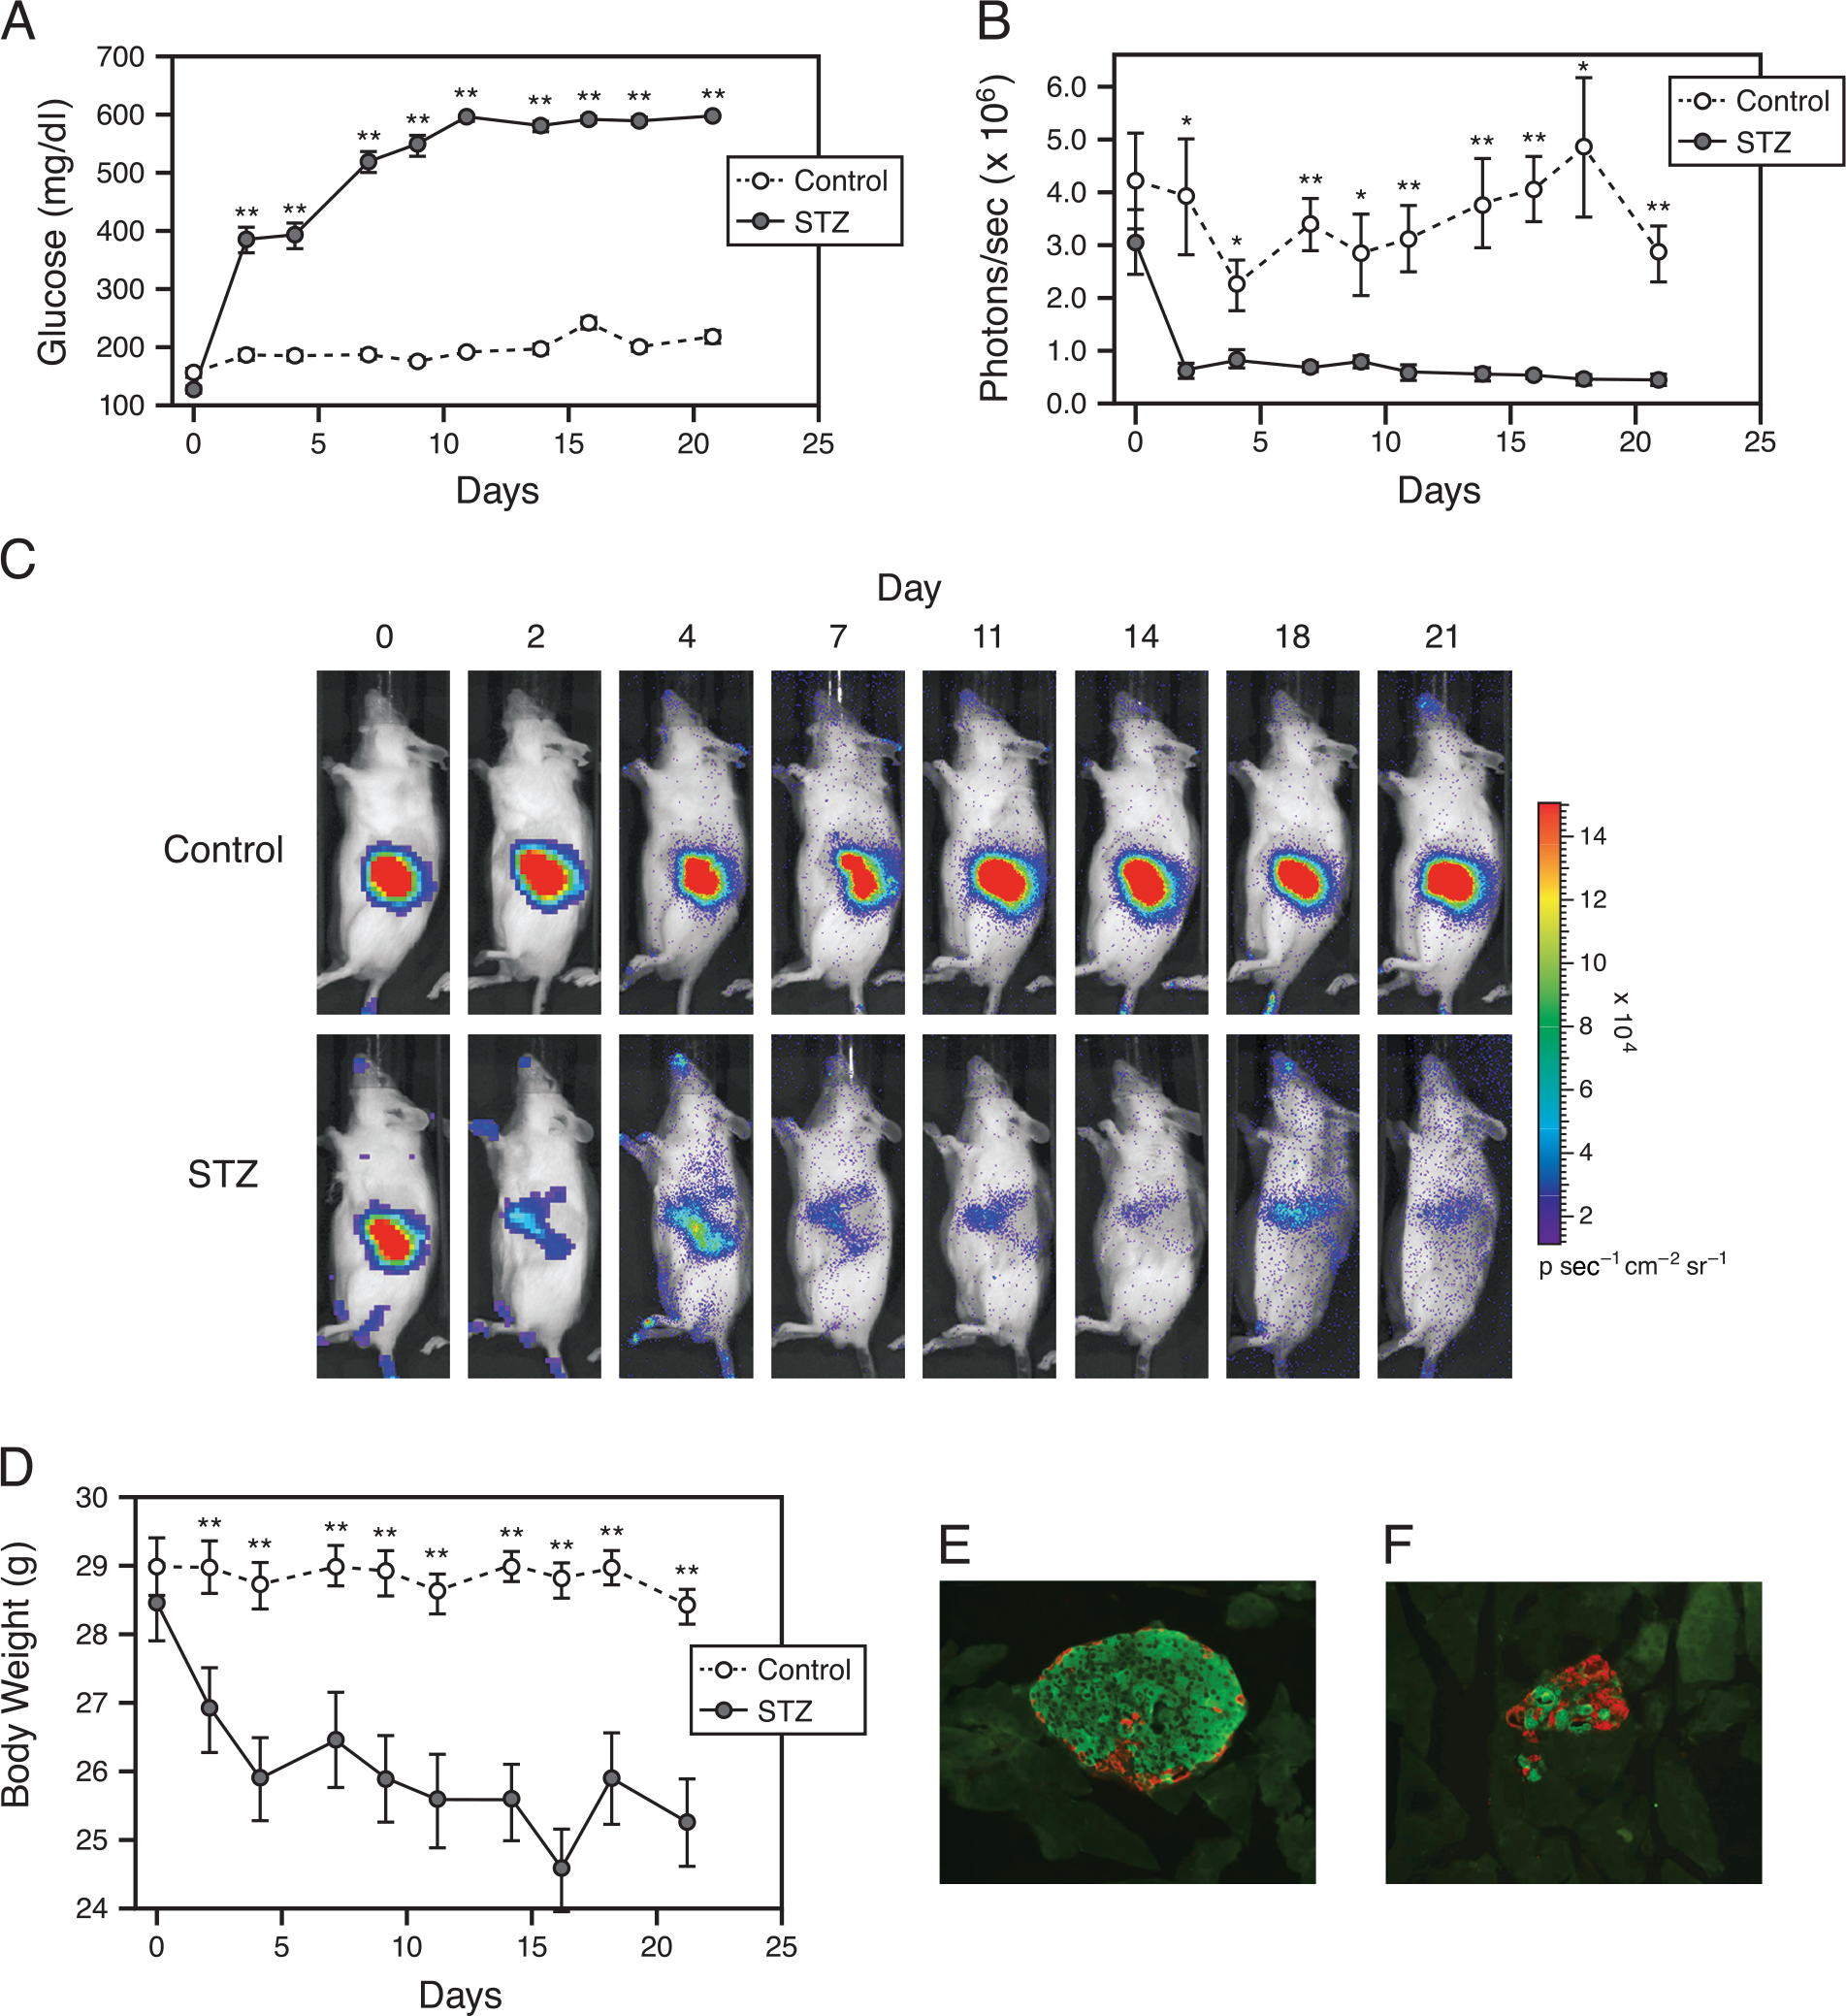
Streptozotocin treatment. RIP-luc male mice were treated with 175 mg/kg STZ and then studied for 21 days. Mice were fasted for 5 hr prior to imaging, weighing, and blood glucose analysis. Within 2 days following STZ treatment, blood glucose level was found to increase to greater than 400 mg/dl (A) in conjunction with a decrease in luciferase signal as measured in photons per second (B). (C) Pancreatic luciferase signal in example control and STZ-treated mice. STZ-treated animals also lost weight following drug treatment correlating with the loss of glucose metabolic control (D). Differences relative to controls: *p ≤.05; **p ≤ .01. (E) An example of islet morphology in pancreatic sections from control and STZ-treated mice. Pancreatic tissue sections (10 μm; 20× view) were stained for insulin (green) and glucagon (red). A representative islet from a control (E) and STZ-treated (F) mouse is shown, demonstrating the decreased β-cell insulin staining seen in islets of STZ-treated mice. Ten control and 9 STZ-treated mice, 16 weeks of age at STZ treatment, were used in A–D. Data are shown as mean and SEM.
Intrahepatic Islet Transplantation
Intrahepatic autologous islet transplantation using donor islets from the RIP-luc strain was performed in STZ-induced diabetic FVB/N mice (Figure 4). Amelioration of the hyperglycemic state after transplant was associated with the detection of an intense biophotonic signal throughout the liver generated by the implanted islets. Prior to islet transplantation, STZ-treated mice had blood glucose levels greater than 350 mg/dl. One week following islet transplantation, blood glucose levels had stabilized at 120–150 mg/dl. We have routinely observed immediate and constant long-term correction of the hyperglycemic state after transplantation of 300 RIP-luc islets in more than 10 consecutive transplants (data not shown).

Bioluminescent images of luciferase-positive islets after intrahepatic transplant. Islets (300) isolated from RIP-luc mice were transplanted to a syngeneic mouse via portal vein infusion. Bioluminescent images were obtained on Day 7 posttransplantation showing luciferase expression from the transplanted islets. Images include ventral, right, dorsal, and left sides, respectively, in a single representative mouse.
Discussion
We have developed a transgenic mouse model using the rat insulin promoter to drive pancreatic-islet-specific luciferase expression that can be used for the study of metabolic disease. It is important to note that the introduction of the transgene did not affect normal islet function as measured in the isolated islet response to glucose and other insulin secretogogues (Figure 2). Furthermore, RIP-luc mice had normal fasting and fed plasma glucose levels compared with wild-type FVB/N mice, indicating that glucose homeostasis was maintained. The luciferase expression was restricted to the pancreatic islet in adult mice, but we have not yet determined by histology if this expression is β-cell specific within the islet. However, several lines of evidence support the conclusion that the reporter is specific to the β-cell. First, the β-cell-specific toxin, STZ, resulted in a significant reduction in the bioluminescent signal, and this was correlated with changes in circulating C-peptide, a reflection of insulin secretion. Second, dietary obesity significantly increased the bioluminescent signal, as would be expected following pancreatic β-cell hypertrophy and increased insulin secretion, secondary to obesity.
Luciferase expression in adult RIP-luc transgenic mice was stable while the animals were fed a chow diet and increased due to diet-induced obesity (Figure 1A, B). Because diet-induced obesity may result in peripheral insulin resistance [30,31], we believe the increased luciferase signal results from metabolic changes associated with the increase in body fat during high-fat-diet feeding. Specifically, we found that changes in RIP-luc signal were strongly correlated with changes in total weight, and adjustment for changes in weight reduced the significance of the treatment group difference in mean change in luciferase signal. Subcutaneous and retroperitoneal fat depots measured at the end of the study correlated significantly with changes in RIP-luc signal between the chow and high-fat diets.
The increased luciferase signal following the start of high-fat feeding was rapid and occurred within 3 days following the start of the diet. This could represent either increased transcriptional activation of the transgene, or an increase in β-cell number, or both. Topp et al. [32] have shown that chronic glucose infusion into rats results in rapid hyperplasia and an increase in β-cell number that occurs within days. Similarly, feeding of a high-fat diet increases pancreatic islet mass, insulin secretion, and plasma glucose levels [31,33,34], but the rapidity of changes in islet mass, that is, β-cell number, with high-fat feeding has not been clearly documented. We have not completed studies yet to distinguish whether the increased RIP-luc signal in this high-fat feeding study represents an increase in β-cell number or activation of transgene expression, or both. The signal is likely to represent both, but we would argue that it primarily represents β-cell mass because the data were collected following a 5-hr fast that would tend to normalize the differences in circulating factors, such as glucose levels, affecting β-cell function in the obese animals. Furthermore, most studies of insulin gene transcriptional regulation have shown that supraphysiological glucose levels, in vitro, are required for significant up-regulation of insulin gene expression [7–11]. Finally, the RIP-luc islet transplantation studies (see discussion below) indicate that there is a linear correlation between transplanted islet number and bioluminescent signal.
We also showed that in vivo luciferase bioluminescence decreased with loss of islet mass, insulin production and control of glucose metabolism after STZ treatment (Figure 3A–F). Following STZ treatment, the luciferase signal fell precipitously and stabilized at a low level (Figure 3B, C). The reduced bioluminescence in the diabetic mice reflected histological indicators of pancreatic β-cell loss, as well as the reduction of C-peptide levels and luciferase activity in pancreatic tissue homogenates. Following the initial reduction in bioluminescence after STZ treatment, the in vivo luciferase signal did not increase during the 3-week study, indicating that there was no compensatory β-cell hyperplasia. This was likely a consequence of the known β-cell toxicity associated with severe hyperglycemia [35], which limited a hyperplastic response. In this experiment, the rapid reduction of the luciferase signal likely reflects primarily the changes in β-cell mass. However, the profound hyperglycemia in these mice could also have activated transcription of the RIP-luc reporter, as has been found from in vitro studies [7–11]. Therefore, the luciferase signal emitted per β-cell may be different in the diabetic hyperglycemic state than in the intact normoglycemic state. In the STZ-treated mice we describe here, circulating serum C-peptide was decreased by 67%, whereas the in vivo bioluminescent signal was decreased by 77% relative to controls. Therefore, there was a good correspondence in this model between the bioluminescent signal in vivo and the functional activity and mass of the remaining β-cells, despite the marked hyperglycemia. In unpublished work, we have determined that repeated glucose injections resulting in prolonged hyperglycemia in the RIP-luc mouse did not increase the luciferase signal at 4 hr after the initial glucose injection. Therefore, it may be that this transgene may not be as responsive to regulation by glucose levels as has been demonstrated for the mouse INS2 gene based on data from in vitro studies. More detailed characterization of this reporter system, both in vitro and in vivo, is needed to determine, under various conditions, the correlation between the β-cell mass and luciferase activity. Based on the limited studies we present here, we would argue that the pancreatic luciferase signal most likely represents functional mass of the islets, that is, a combination of islet mass and the level of insulin gene induction, with primarily β-cell mass being reported.
The luciferase-labeled islets from the RIP-luc mice have also been used to study islet transplantation (Figure 4). In this model, the bioluminescent intensity serves as a noninvasive measure of islet location, number, and possibly metabolic state. Bioluminescent intensity, in conjunction with serum glucose measurements and graft immunohistochemistry, provides complementary information on islet function, viability, revascularization, location, and graft site infiltration [36,37]. Chen and Kaufman [36] found that there was a direct correlation between transplanted islet number and bioluminescent signal intensity, at least under conditions of normal circulating glucose levels.
The rat insulin promoter (RIP) used in our studies came from the rat Ins2 gene. In adult rat, the Ins2 gene is the dominant transcript, and transcription is correlated with pancreatic insulin content [38]. Rat Ins1 is expressed only in the fetus. However, in mouse, both the Ins1 and Ins2 genes are expressed in adult animals but Ins2 is the predominantly transcribed protein [39]. Recently, another transgenic mouse model expressing luciferase in islet β-cells was generated [40] by using the mouse Ins1 promoter to drive transgene expression. Their studies did not correlate the in vivo bioluminescent signal with physiological changes such as drug treatment or dietary manipulation. They did successfully transplant islets to recipient animals where an in vivo bioluminescent signal was detected. In addition, as in the RIP-luc mouse model, they studied cultured islets and found them to respond to glucose levels similar to nontransgenic islets. There will likely be differences in in vivo whole-body bioluminescent signal intensity and regulation between the RIP-luc and Ins1-luc mouse models because the constructs may report on different aspects of islet biology.
This preliminary report suggests that the RIP-luc model can serve as a valuable tool in studies of islet or β-cell functional mass and insulin gene function in the intact mouse. However, additional studies are needed to demonstrate that the luciferase reporter is expressed only in the β-cell, and to further understand the correlation between in vivo bioluminescence and β-cell functional mass. The mice also may be useful as tissue donors for studying pancreatic islet transplantation. Furthermore, breeding this reporter transgene into genetic models of obesity and diabetes, such as the ob/ob, db/db, and Ay/a models for examining insulin synthesis and islet hypertrophy during the onset and progression of obesity and type 2 diabetes [14] or breeding into the NOD mouse for tracking the autoimmune-mediated loss of islet mass [41], could be useful modifications of these existing mouse models of obesity and diabetes.
Footnotes
Acknowledgments
Portions of this study were supported by a Merit Review Award from the VA Research Service, research grants from the National Institutes of Health (DK62641, DK63439, DK59637, DK68764), the Juvenile Diabetes Research Foundation International, and the Vanderbilt Diabetes Research and Training Center (NIH DK20593). We also acknowledge research grant support from the National Institutes of Health (DK63565) to D.B.K.