
Abstract
Gliomas are the most common types of brain tumors. Although sophisticated regimens of conventional therapies are being carried out to treat patients with gliomas, the disease invariably leads to death over months or years. Before new and potentially more effective treatment strategies, such as gene- and cell-based therapies, can be effectively implemented in the clinical application, certain prerequisites have to be established. First of all, the exact localization, extent, and metabolic activity of the glioma must be determined to identify the biologically active target tissue for a biological treatment regimen; this is usually performed by imaging the expression of up-regulated endogenous genes coding for glucose or amino acid transporters and cellular hexokinase and thymidine kinase genes, respectively. Second, neuronal function and functional changes within the surrounding brain tissue have to be assessed in order to save this tissue from therapy-induced damage. Third, pathognomonic genetic changes leading to disease have to be explored on the molecular level to serve as specific targets for patient-tailored therapies. Last, a concerted noninvasive analysis of both endogenous and exogenous gene expression in animal models as well as the clinical setting is desirable to effectively translate new treatment strategies from experimental into clinical application. All of these issues can be addressed by multimodal radionuclide and magnetic resonance imaging techniques and fall into the exciting and fast growing field of molecular and functional imaging. Noninvasive imaging of endogenous gene expression by means of positron emission tomography (PET) may reveal insight into the molecular basis of pathogenesis and metabolic activity of the glioma and the extent of treatment response. When exogenous genes are introduced to serve for a therapeutic function, PET imaging may reveal the assessment of the “location,” “magnitude,” and “duration” of therapeutic gene expression and its relation to the therapeutic effect. Detailed reviews on molecular imaging have been published from the perspective of radionuclide imaging (Gambhir et al., 2000; Blasberg and Tjuvajev, 2002) as well as magnetic resonance and optical imaging (Weissleder, 2002). The present review focuses on molecular imaging of gliomas with special reference on the status and perspectives of imaging of endogenous and exogenously introduced gene expression in order to develop improved diagnostics and more effective treatment strategies of gliomas and, in that, to eventually improve the grim prognosis of this devastating disease.
Introduction
Hand in hand with the detailed analysis of the human genome, alterations in the genetic signature and protein function are being defined for various neurological diseases including brain tumors. To identify the fundamental errors of disease and to develop corrections at the molecular level are the overall goals of the broad and growing field of “molecular medicine.” In general, the ultimate goal of the field of “molecular imaging” is the development of technologies, which allow a noninvasive assessment of gene and protein function and profiling of signal transduction pathways in animal models of human disease to get insight into the molecular pathology and to speed up the development of new drugs and of improved patient-tailored therapies. The main advantage of molecular imaging technology is its noninvasiveness avoiding time-consuming tissue sampling and allowing to quantitatively study the kinetics of molecular and cellular processes in three-dimensional space.
Moreover, the knowledge of an underlying genetic defect and the understanding of related pathophysiological alterations in, for example, tumor replication, migration, signal transduction, and others, are the first steps towards the development of new gene- or cell-based treatment strategies. The design of effective gene therapy strategies relies on concerted research between various disciplines to define the alterations in tumor genetics and tumor biology, and to develop safe vectors and vector application systems to achieve efficient, targeted, and regulated alterations of specific therapeutic gene expression.
The main diagnostic procedures in patients with suspected glioma combine modern histological analysis and genetic profiling with sophisticated and expensive imaging technology based on positron emission tomography (PET) and magnetic resonance imaging (MRI). They guide multimodal therapy to assure that as much tumor as possible is being eliminated and as little neurological function as possible is being disturbed. The emerging new molecular imaging technologies for imaging tumor metabolism and transduced therapeutic gene expression will have a great impact on the management of patients with gliomas and shall facilitate the development of safe and efficient application protocols for more effective biological treatment strategies.
Gliomas
Gliomas are the most common primary intracranial neoplasms. They can be divided into astrocytomas, oligodendrogliomas, and mixed gliomas or oligo-astro-cytomas, respectively. Grading is performed according to the World Health Organization (WHO) taking into account the presence of nuclear changes (WHO Grade I), mitotic activity (WHO Grade II), the presence of endothelial proliferation (WHO Grade III), and necrosis (WHO Grade IV) [1,2]. Glioblastoma, corresponding to WHO Grade IV, is the most fatal and most common primary brain neoplasm with an incidence of 3–6 in 100,000. Approximately 50% of all gliomas and 20% of all primary intracranial tumors are glioblastomas [3]. Together with all intracranial neoplasms, the glioblastoma is the second most common cause of death due to an intracranial disease after stroke.
It is important to understand glial tumorigenesis in order to potentially develop specific molecular therapeutic targets. A complex series of molecular changes occurs which results in dysregulation of the cell cycle, alterations of apoptosis and cell differentiation, in neovascularization as well as tumor cell migration and invasion throughout the brain parenchyma. Genetic alterations, which play an important role in glioma development, include a loss or mutation of the tumor suppressor gene TP53 and other genes involved in the regulation of the cell cycle as well as activation or amplification of growth factors and/or their receptors, such as CDKN2A/p16, EGFR, PDGFR, PTEN, and TGF-β [4–6]. During progression from low-grade astrocytoma (WHO Grade II) to anaplastic astrocytoma (WHO Grade III) and to glioblastoma multiforme (WHO Grade IV), a stepwise accumulation of genetic alterations occurs. While TP53 mutation and PDGF and PDGFR-α overexpression represent early changes during low-grade glioma development, progression to anaplastic astrocytoma is associated with RB alteration and loss of heterozygosity (LOH) of 19q, further malignant progression to glioblastoma including LOH 10q and mutations of the PTEN gene [7–9]. These secondary glioblastomas, which develop from better differentiated astrocytomas, can be distinguished from primary de novo glioblastomas on the basis of molecular genetic findings [10] with amplification and/or overexpression of the EGFR, p16 deletion, PTEN mutation, RB alteration and LOH 10p and 10q associated with primary glioblastoma. Most importantly, molecular alterations have been identified, which indicate therapeutic response of patients and, thus, are prognostically relevant: Anaplastic oligodendrogliomas with LOH 1p and/or LOH 19q are characteristically sensitive to PCV chemotherapy, and patients' survival is significantly prolonged [11–13].
For glioma diagnosis, MRI is widely used to assess the extent of blood–brain barrier disruption as an indirect measure for active tumor growth and response to therapy. However, the overall goal within the next years is to make PET imaging modalities more readily available, which allows the detection of metabolically active tumor and the functional assessment of response to therapy necessary for the development of new multimodal treatment regimens. This is of special importance, as despite aggressive multimodal treatment strategies (surgery, radiation, chemotherapy), median survival of patients with gliomas is limited, depending on grade and age at diagnosis varying from 1 year for glioblastoma, to 2–3 years for Grade III and to 5–10 years for Grade II glioma.
Multimodal Imaging in Patients with Gliomas
Both MRI and PET aim towards (i) an exact localization of the tumor and its relation to surrounding tissue and function; (ii) the identification of biological activity (malignancy); (iii) the grading of response to therapy; and (iv) the identification of early indicators for recurrent tumor growth. Figure 1 summarizes the most important variables, which can be noninvasively assessed in patients with a suspected glioma by MR and PET imaging.
Magnetic Resonance Imaging
MRI enables determination of size and localization of the tumor and an estimation of secondary phenomena, such as edema and signs of increased intracranial pressure at high spatial resolution. Glioma-induced signal changes on MRI due to the tumor are heterogenous. Gadolinium-enhanced MRI is widely used as surrogate imaging marker [25] to follow tumor progression and guide surgery or focal radiation therapy. The contrast-enhancing lesion in T1-weighted MRI (Figure 1) corresponds histologically to a hypercellular region with neovascularization [14]; a central hypointense area (T1) is mainly caused by tumor necrosis (Figure 1). Already in the CT-era, biopsies from signal changes in areas surrounding the contrast-enhancing tumor revealed the presence of migrating tumor cells [15]. Diffusion-weighted MRI detects therapy-induced water diffusion changes and has been suggested to provide an early surrogate marker for quantification of treatment response (Figure 2) [16,17].
Magnetic resonance spectroscopy (MRS) is performed to reveal further insight into metabolic alterations and the real extent of gliomas [18], since intratumoral heterogeneity of gliomas is not adequately reflected in conventional MRI and, in practice, the contrast enhancing lesion may either under- or overestimate the presence of active tumor. The increase of choline-containing compounds and of N-acetylaspartate appeared to correlate best with the degree of tumor infiltration improving tumor delineation in vivo [19,20]. There is evidence that the appearance of creatine differentiates gliomas from metastasis, where no significant creatine can be detected [21]. Moreover, MRS on specimens of human brain tumors in vitro reveals insight into a wide range of biochemical information, which enables differentiation between tumor types and, most importantly, between primary and recurrent gliomas as a reflection of the evolving tumor metabolism [22]. An improved automated MRS analysis approach (nosologic imaging) enables correct differentiation between low-grade glioma, high-grade glioma, meningiomas, metastasis, necrosis, and healthy tissue in up to 90% of cases and shall facilitate a noninvasive diagnosis of lesion type [23]. Moreover, specific changes in tumor metabolite levels as detected by MRS may be predictive of the effectiveness of experimental treatment strategies [24]. However, it should be kept in mind that the anatomical and contrast heterogeneity of gliomas observed with MRI cannot be resolved by the substantially lower resolution of MRS.

Parameters of interest in the noninvasive description of gliomas. Alteration of blood–brain barrier and extent of peritumoral edema is detected by MRI. Signs of increased cell proliferation can be observed by means of multitracer PET imaging using [18F]FDG, [11C]MET, and [18F]FLT as specific tracers for glucose consumption, amino acid transport, and DNA synthesis, respectively. Secondary phenomena, such as inactivation of ipsilateral cortical cerebral glucose metabolism, may be observed ([18F]FDG) and are of prognostic relevance. Gd = gadolinium.

Time course of gene therapy-induced changes of diffusion-weighted MRI. Intracerebral rat 9L gliosarcomas were injected with an adenoviral vector mediating expression of cytosine deaminase. Subsequently, animals were treated with 5-fluorouracil (5FC). Serial T2-weighted MR images and corresponding maps of the apparent diffusion coefficient (ADC) of the rat brain were acquired prior to 5FC-treatment (Day 0) through an 8-day treatment period. Serial histograms of ADC values in the 9L CD/5FC-treated tumor over time are shown in the box. Note that early increases in diffusion values (Day 2) are evident, which increase over time during treatment along with growth of tumor mass. A representative H&E-stained section of the tumor at Day 8 revealed large areas of necrosis in correspondence to the bimodal distribution of the ADC values along with a higher number of ADC values relative to values observed prior to treatment. These results indicate that therapy-induced changes within the tumor, which occur parallel to tumor growth/repopulation, can be detected by diffusion-weighted MRI (from Rehemtulla et al. [17] with permission).
Besides imaging metabolic tumor alteration by MRS, determination of physiologic tumor properties (e.g. microvascular permeability and plasma volume) assessed by dynamic contrast-enhanced MRI is another promising imaging tool. The well-documented vascular hyperpermeability of tumor vessels for macromolecular solutes yields a proteinaceous exudate within the tumor interstitium that is considered a favorable milieu for the in-growth of new capillary buds. Changes in tumor vessel permeability and tumor volumes can be measured by contrast-enhanced MRI as a surrogate marker [25] of angiogenesis, providing an assay that is useful for the monitoring of anti-angiogenic therapies in brain tumors [26]. Moreover, the noninvasive determination of microvascular permeability in human brain tumors has been shown to be predictive of pathologic tumor grade [27].
In summary, various MRI-based parameters are currently used to detect actively growing glioma tissue, however, PET-based imaging of endogenous gene expression reflecting metabolic activity reveals further and partly complementary insight into glioma activity.
Positron Emission Tomography
PET reveals highly specific quantitative information on the metabolic state of a glioma by imaging the expression of a variety of endogenous genes coding mostly for enzymes, receptors, or membrane transporters [28,29]. Depending on the radiotracer used, various molecular processes can be visualized by PET, most of them relating to an increased cell proliferation within gliomas (Figure 1). Radiolabeled 2-[18F]fluoro-2-deoxy-

Principle of noninvasive quantification of gene expression by PET. Similar to the 2-fluoro-2-deoxy-D-glucose ([18F]FDG) model for quantification of hexokinase (HK) or hexokinase gene (hk) activity as a direct measure of the cerebral metabolic rate of glucose [30], cellular thymidine kinase (c-tk) and vector-mediated HSV-1-tk (v-tk) gene expression can be measured by determination of the accumulation rate, Ki (mL/min/g), of specific radiolabeled nucleoside analogs (NUC), such as [18F]FLT, [124I]FIAU, and [18F]FHBG, which are being metabolically trapped by phosphorylation. HSV-1-tk = herpes simplex virus type 1 thymidine kinase gene.
2-[18F]FDG-PET
[18F]FDG-PET monitors the rate of glucose uptake and level of hexokinase gene expression throughout the body and has been widely used as surrogate marker [25] to detect the metabolic differences between normal brain tissue, low-grade and high-grade gliomas, and radionecrosis [34–39]. Increased intratumoral glucose consumption correlates to tumor grade, cell density, biological aggressiveness, and patient survival [34,39–44]. Visual grading of [18F]FDG uptake in the tumor and determination of tumor-to-contralateral brain activity ratios provide a reliable semiquantitative analysis with good correlation to patient survival [43,45,46]. In addition, reduction of contralateral brain metabolism was closely related to prognosis [47]. [18F]FDG-PET may guide stereotactic tumor biopsy to identify the most malignant tumor part with high accuracy [48]. Malignant progression of low-grade gliomas is indicated by a newly appearing hypermetabolism [35,49,50] with high sensitivity and specificity (80% and 94%), respectively [51]. However, small recurrent masses may be missed [52]. Response to radio- and chemotherapy is reflected by decrease of metabolism if measured several weeks after completion of therapy [53]. In contrast, tumor glucose metabolism may increase transiently early during successful chemotherapy [49,54]. Quantitation of the metabolic rate of glucose (MRGlc) was a sensitive discriminator of treatment response in a Phase II study for temozolomide in recurrent high-grade gliomas [55], indicating that the MRGlc may reflect the degree of cell killing following chemotherapy and so may provide an objective, quantitative subclinical measure of response to therapy. Similarly, [18F]FDG-PET has been used to follow gene therapy-induced alterations of [18F]FDG-transport and phosphorylation in an experimental hepatoma model in order to identify early indicators for successful therapy [56]. Enhanced expression of glucose transporters seems to represent a stress reaction of tumor cells dedicated for prevention of HSV-1-tk/ganciclovir-mediated cell death [57].
However, the disadvantage of [18F]FDG-PET in gliomas with predominant cortical localization is the relatively high cortical background activity disabling delineation of tumor borders (Figure 1). It is therefore of little additional value for planning of radiation therapy [58] and for detection of recurrent or residual tumor after therapy [51,59]. Especially with the development of new tracers (see below), [18F]FDG-PET most likely will be replaced by those because of its high background activity.
Methyl-[11C]-l-Methionine-PET
Increased expression of amino acid transporters in gliomas can be noninvasively assessed by [11C]MET and PET. The fact that some brain tumors show hypo- or isometabolism in [18F]FDG-PET limits its usefulness and urges the development of more specific radiotracers for the detection of primary or recurrent gliomas and for the differentiation of malignant from benign lesions. The radiolabeled amino acid [11C]MET has been shown to be a more specific tracer in tumor detection, tumor delineation, and differentiating benign from malignant lesions with high sensitivity and specificity due to its low uptake in normal brain (Figure 1; [43,60–66]). The increased methionine uptake seems not to be a direct measure of protein synthesis, but rather, seems to be due to increased transport mediated by type L amino acid carriers (reviewed by Laverman et al. [67]; [68–70]). [11C]MET-uptake correlates to cell proliferation in vitro [70], Ki-67 expression [61], as well as to proliferating cell nuclear antigen expression [71] and microvessel density (Kracht et al., manuscript in preparation), indicating its role as marker for active tumor proliferation. Important are autoradiographic findings by Kubota et al. [72], which demonstrate that the level of increased methionine uptake correlates with the number of tumor cells, whereas no significant methionine uptake was observed in chronic inflammatory or radiogenic lesions [72]. Yet, [11C]MET uptake may be increased in acute inflammatory lesions and acute ischemic stroke with reperfusion [73]. [11C]MET uptake is increased in approx. 80% of low-grade gliomas [63] in which [18F]FDG uptake is lower than in the normal brain (Figure 4), whereas in glioblastomas, methionine uptake and glucose metabolism were found to be highly correlated [43,74]. Thus, [11C]MET might contribute more to diagnosis of low-grade gliomas rather than high-grade gliomas. Oligodendrogliomas tend to show higher [11C]MET uptake than astrocytomas of same histological grade [63,75,76]. In low-grade gliomas, baseline [11C]MET-uptake serves as a prognostic indicator [77–79]. [11C]MET-PET was used for quantification of treatment response after brachytherapy of low-grade gliomas [59,80] and differentiates recurrent tumor from radiation necrosis [81,82] (Figure 5). Corticosteroid treatment has less effect on methionine uptake than on contrast enhancement with CT and MRI [63]. Use of [11C]MET for scientific studies is limited by its rapid and complex metabolization, which does not permit quantitative differentiation between transport and metabolic rates as described for [18F]FDG or [18F]FLT.

Noninvasive determination of glioma grade. Low-grade gliomas (WHO °II) show decreased glucose consumption ([1 F]FDG) and a moderate increase of [11C]MET-uptake (approximately 1.5-2.0 fold in comparison to the contralateral control region). In contrast, high-grade gliomas (WHO °IV) have a high cell density and, therefore, high glucose consumption and amino acid uptake (> 2.5-fold in comparison to the contralateral control region). Note the secondary inactivation of ipsilateral cortical glucose metabolism in °IV glioma as possible indication for a limited prognosis.
Further Amino Acid Tracers
For many years, there has been growing interest in the use of further radiolabeled amino acids (or analogs) for imaging expression of amino acid transporters and protein synthesis of gliomas (reviewed in Laverman et al. [67] and Jager et al. [83]). A new amino acid tracer should preferably have high uptake in tumor cells but in contrast to [18F]FDG low nonspecific uptake in normal tissues. In recent years, several amino acids have been labeled with either gamma radiation-emitting radionuclides or positron-emitting radionuclides. The longer half-life of fluorine-18 matches better with the relatively slow process of protein synthesis and also facilitates shipping of the radiolabeled amino acids to hospitals without an on-site cyclotron or dedicated radiochemistry laboratory. The number of fluorinated amino acids under investigation is increasing, and one of the major points of discussion is the underlying mechanism of the tumor visualization. While it has been shown that some amino acids can be used to measure the protein synthesis rate, others are used with the sole aim of measuring the rate of uptake into the cell (for review, see Ref. [67]).

Differentiation between recurrent tumor and radiation necrosis by means of co-registered [11C]MET-PET and MRI. Stereotactic biopsy from the contrast-enhancing lesion on MRI (B) revealed signs of radiation necrosis. However, biopsy from adjacent tissue demonstrating signs of increased methyl-[11C]-
3-[123I]iodo-
Further nonmetabolized amino acid tracers have been developed and evaluated in experimental rat 9L gliosarcoma and C6 and RG2 glioma models, for example, 1-aminocyclopentane carboxylic (ACPC) acid [99,100], alpha-aminoisobutyric (AIB) acid [99,100], 1-amino-3-[18F]fluorocyclobutane-1-carboxylic acid ([18F]FACBC; [101]), and 3-[18F]fluoro-2-methyl-2-(methylamino)propanoic acid (N-Me[18F]FAMP; [102]). Uptake of ACPC occurs by facilitated transport across tumor and brain capillaries [99] and was found to be substantially better than [18F]FDG to identify low-grade tumors with intact BBB as well as tumor infiltration of adjacent tissue. Moreover, viable tumor regions could be distinguished from necrosis more readily with AIB than with [18F]FDG [100]. [18F]FACBC-uptake in 9L gliosarcoma exhibited a maximum at 60 min after tracer application (1.7% ID/g) with a tumor-to-brain ratio of 6.6 [101]. N-Me[18F]FAMP was produced via non-carrier-added nucleophilic substitution in high yields (< 78%) and high radiochemical purity (> 99%). It is taken up by the A-type amino acid transport system and tumor-to-brain ratios in the 9L gliosarcoma model 60 min after tracer application was greater than 100, indicating its potential usefulness as PET tracer for glioma imaging [102].
Radiolabeled Nucleoside Tracers
The third parameter, which can be noninvasively assessed by PET, is the level of expression of nucleoside transporters and cellular thymidine kinase gene activity with subsequent incorporation of nucleosides into DNA in proliferating glioma cells (Figure 1). Radiolabeled thymidine ([3H]TdR) is the gold standard for determination of cell proliferation in cell culture, and to date, 11C- and 18F-labeled thymidine compounds have been radiosynthesized to allow a noninvasive assessment of tumor proliferation as well as early response to chemotherapy by PET [31,103–107]. 2-[11C]thymidine imaging of gliomas has been investigated in a preliminary study in 13 patients in comparison to [18F]FDG-PET and MRI, and it was found to serve important information on the proliferative activity of the tumor. However, its use might be limited by its complicated metabolism requiring correction for labeled metabolites [103,108–111]. In contrast, [18F]FLT is stable in vivo and has been used for the evaluation of tumor proliferation primarily in extracranial tissues [31,33,112]. Unpublished results in patients with gliomas (Dohmen et al., Jacobs et al.) indicate that [18F]FLT is a promising tracer to study glioma proliferation especially in areas with high [18F]FDG background. Relative [18F]FLT uptake within gliomas is greater than relative [11C]MET uptake, indicating the possible role of [18F]FLT as a more specific tumor marker than [18F]FDG and [11C]MET.
Apart from labeled thymidine, the uridine analogs [124I]iodo-deoxy-uridine ([124I]IUdR; [113–115]) and 5-[76Br]bromo-2′-deoxyuridine ([76Br]BrUdR; [116,117) have been used in an attempt to image tumor proliferation. [124I]IUdR uptake and retention was followed in 20 patients with meningiomas and gliomas by PET [118]. Incorporation of [124I]IUdR into DNA was estimated by pharmacokinetic modeling, which was complicated by residual, nonincorporated metabolite activity from [124I]iodide. However, [124I]IUdR accumulation rates, standard uptake values, and tumor-to-brain activity ratios were all related to direct or indirect measures of tumor proliferation (labeling index, tumor type and grade, patient survival) indicating the possible role of [124I]IUdR as a noninvasive proliferation marker with PET. A disadvantage of [124I]- and [76Br]-labeled uridine analogs is their relatively long half-life with 4.2 days and 16.1 hours, respectively. In general, labeled thymidine or analogs might be very helpful in an early noninvasive assessment of tumor response to treatments directed at targets associated with cell proliferation by PET [113].
In summary, multimodal imaging of gliomas by MRI/MRS and multitracer PET shall identify (i) the exact localization and dignity of the tumor, (ii) an early response to therapy, and (iii) early indicators for recurrent tumor growth. However, in addition, an assessment of neuronal tissue function surrounding the tumor is necessary to guide optimal surgery and radiotherapy avoiding functional deficits.
Functional Imaging of Glioma-Induced Alterations of Neuronal Function by PET
Although imaging of neuronal function does not belong directly into the field of molecular imaging, some words have to be given on functional neuroimaging to clarify that all imaging modalities have to work together in concerted action in order to develop efficient therapies for patients with gliomas. Treatment of gliomas in or close to eloquent cortex may inflict neurological deficits. Intraoperative mapping procedures have been used for many decades in efforts to minimize neurological sequelae. The possibility for noninvasive preoperative brain mapping has emerged with the advent of functional PET and/or MRI (Figure 6). For optimal planning of micro-surgical procedures [119,120] and radiation treatment [121], functional PET and/or MRI was found to be very useful [122]. In a series of 16 patients with glioma, [11C]MET-PET identified tumor localization in conjunction with co-registered MRI, and [15O]H2O-PET activation was used to locate the language and motor function [123]. Functional mapping by [15O]H2O-PET was found to be essential for correct localization of function, especially when tumor caused swelling and deformation of cortical structures. Total resection of low-grade glioma (n = 8) and effective decompression of the active part of malignant glioma (n = 4) was completed without causing functional deficits [123]. Using a verb generation task, Herholz et al. [124] demonstrated a significant correspondence of language localization by preoperative activation with [15O]H2O-PET and intraoperative electrical cortex stimulation [124]. Cortical sites with aphasic disturbance during electrical stimulation had a significantly higher cerebral blood flow increase during preoperative activation than did sites without intraoperative language impairment indicating that noninvasive assessment of language function by [15O]H2O-PET is a valuable preoperative diagnostic tool for patients with tumors close to language-related brain structures [124]. Functional imaging by PET seems to be especially important in cases with slowly evolving brain lesions, where plasticity of language networks might occur [125] and brain areas, normally not involved in language processing, take over the function of compromised regions [126], either within the same hemisphere (intrahemispheric compensation) or within the contralateral nondominant hemisphere (interhemispheric compensation). Sabbah et al. [127] integrated functional, metabolic, and anatomical imaging data into one fusion image showing the foci of high proliferative activity, which have to be completely resected, and the peritumoral functional structures, which have to be spared in order to minimize postoperative sequelae [127]. These authors enter the trimodal image into a surgical neuronavigation computer for preoperative planning in order to outline tumoral target and functional risk areas. This information is displayed in the operative microscope optically linked to MR images optimizing neurosurgical tumor resection [127]. Furthermore, brachytherapy is a treatment option for small, well-demarcated gliomas located in or close to eloquent brain areas [128–130] and its primary aim is to effectively destroy cells inside a volume covered by the prescribed therapeutic dose. As in about 20% of patients presenting with low-grade gliomas, functional important tissue can be expected within the tumor [131], preoperative visualization of functional activity is of high importance (Figure 6).

Delineation tumor from neurologic function by co-registration of metabolic ([11C]MET) and functional ([15O]H2O) PET with MRI. Repeated [15O]H2O-PET is being performed under various stimuli, for example, finger tapping or verb generation. Areas which show significant increase in blood flow are depicted with elevated z-scores and are co-registered to MRI for exact anatomical localization of functional activation as well as to metabolic PET images ([11C]MET-PET), where the tumor region with elevated amino acid uptake is depicted in red. Note that a good separation between function and tumor was observed. These multimodal imaging modalities shall guide patient-tailored therapy, where as much tumor as possible should be killed and as little neurological function as possible should be disturbed.
Biological Treatment Strategies for Gliomas
After localization and characterization of glioma tissue by MRI and PET, the most important and central step is the development of more efficient treatment strategies for gliomas. In view of the high incidence and poor prognosis of malignant brain tumors treated by conventional therapies, research focusing on the establishment of clinically valuable gene- and cell-based therapies seems to be of utmost importance. Localized transduction of brain tumor cells with “therapeutic” genes may influence their biological properties by (i) rendering them sensitive to prodrugs; (ii) altering the expression of cell-cycle regulating proteins; (iii) inhibiting angiogenesis; or (iv) stimulating the immune response. An additional approach consists of (v) the selective oncolysis mediated by certain mutant herpes or adeno-viruses, which specifically replicate in and lyse proliferating tumor cells [132–141]. These selectively replicating vectors might be part of the “magic bullet” for future gene therapy strategies against tumors including gliomas [142,143].
So far, results of gene therapy strategies in the clinical application in patients with gliomas have been disappointing [144–147] (review in Ref. [148]). The discrepancy between successful experimental gene therapy protocols and the limited efficiency in their clinical application highlights the importance of developing assays, which allow an assessment of the transduced “tissue dose” of a therapeutic gene in patients in vivo. The clinical gene therapy trials for glioblastoma so far performed have all suffered from a lack of ability to investigate the magnitude and extent of transduced therapeutic gene expression in vivo, the only qualitative information being obtained from biopsied tissue samples [149]. Therefore, one of the most important issues for making gene therapy widely applicable to humans is the development of technology for the noninvasive monitoring of the location, magnitude, and duration of vector-mediated gene expression in vivo [150–153]. This is in line with the Recombinant DNA Advisory Committee (RAC) of the NIH which, as a reflection to the first gene therapy death, called for better assays for measuring transgene expression in cells and tissues [154].
Molecular Imaging of Exogenous Gene Expression by PET
Real-time imaging of gene expression in vivo is a long-cherished goal in molecular medicine [155]. This may allow the detailed analysis of both endogenous and exogenous gene expression in living animals and preferably also in a clinical setting. In general, molecular imaging is based on three strategies comprising (i) the direct visualization of endogenous proteins (e.g., membrane epitopes/receptors, transporters or enzymes) and molecules (e.g., mRNA, DNA) by specifically designed radiolabeled or paramagnetic probes; (ii) the indirect imaging of expression of any gene of interest (GOI) by visualization of a proportionally co-expressed reporter gene (e.g., HSV-1-tk); and (iii) the visualization of a surrogate marker (e.g., hexokinase gene activity as marker for tumor cell density and malignancy as described above) [25]. Noninvasive imaging of endogenous gene expression may reveal insight into the molecular basis of disease pathogenesis and into the extent of treatment response. On the other hand, when exogenous genes are introduced to ameliorate a genetic defect or to add an additional gene function to cells, imaging techniques may reveal the assessment of the location, magnitude, and duration of therapeutic gene expression and its correlation to the therapeutic efficiency. Moreover, marker gene expression under control of a given promoter may allow a direct visualization of promoter and related transcriptional activator/repressor functions. For this purpose, specific reporter genes are linked to genetic regulatory elements, and their expression can reveal spatial and temporal information about a variety of biological processes at the level of transcription (“molecular imaging”; [156,157]).
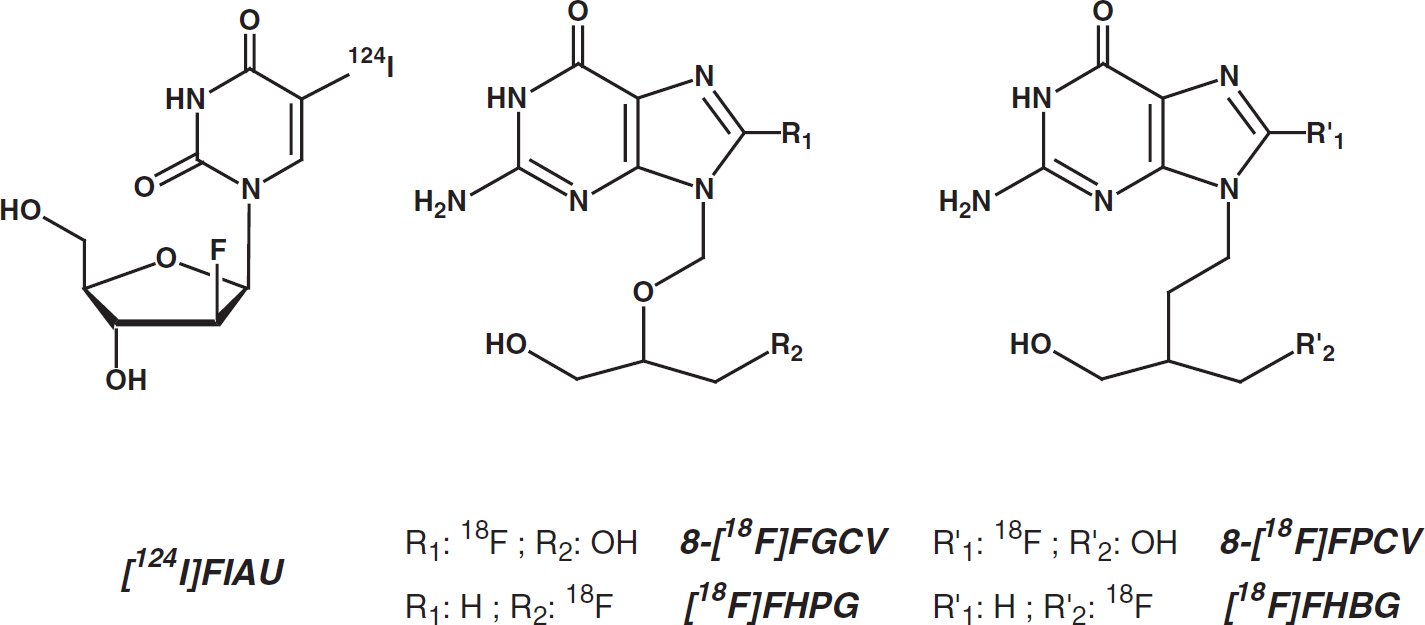
PET marker substrates for localization of exogenous HSV-1-tk gene expression. [124I]FIAU = 2′-fluoro-2′-deoxy-1β-d-arabinofuranosyl-5-[124I]iodo-uracil; [18F]FGCV = 8-[18F]fluoro-ganciclovir; [18F]FPCV = 8-[18F]fluoro-penciclovir; [18F]FHPG = 9-[(3-[18F]fluoro-1-hydroxy-2-propoxy)methyl]guanine; [18F]FHBG = 9-[4-[18F]fluoro-3-(hydroxymethyl)butyl]guanine.
Different approaches for noninvasive imaging of mammalian gene expression have been developed using optical, radionuclide, or MRI techniques [150,153,155,158–163]. Although optical imaging techniques, such as intravital microscopy of green fluorescent protein (GFP) expression or bioluminescence or near-infrared fluorescence, have excellent temporal resolution, the common disadvantages are the limited spatial resolution and depth penetration [160,164,165]. Therefore, at the current stage, optical imaging is limited to imaging small animals although this will change with the development of tomographic image acquisition techniques. Nuclear imaging techniques have a high sensitivity, where very low levels of specific tracer accumulation can be detected but have an inherently limited spatial resolution [25,157,166,167]. MRI techniques have a spectacular image resolution, however, temporal resolution is limited and molecular probe detection is several orders of magnitude less sensitive [155,168,169].
As described above, PET allows the quantitative localization of expression of endogenous or exogenous genes coding for enzymes or receptors by measuring the accumulation or binding of the respective enzyme substrates or receptor binding compounds [30,157,170]. The unique ability of herpes simplex virus type 1 thymidine kinase HSV-1-tk to selectively incorporate radiolabeled nucleoside analogs into DNA [150,153,171,172] allows the noninvasive imaging of tk-gene expression in distinct regions within a transduced tissue [150,153,173–180]. Saito et al. [171] were the first to propose that the HSV-1-tk gene might be used as a marker gene for the early detection of herpes encephalitis by using specific radiolabeled nucleoside analogs as marker substrates [171,181]. However, only with the development of gene therapy strategies based on HSV-1-tk as suicide gene, the HSV-1-tk gene became attractive as PET marker gene to noninvasively follow gene therapy. Tjuvajev et al. [153] could demonstrate for the first time that in retrovirally transduced, stably TK-expressing rat RG2 glioma clones, the accumulation rate of the specific HSV-1-TK marker substrate, 2′-fluoro-2′-deoxy-1β-
The quantitative determination of TK expression by PET is based on the same principles as the measurement of local cerebral glucose utilization as described by Sokoloff et al. [30] (Figure 3). As reviewed previously [25,182], quantification is performed by measuring the accumulation rates of specific viral thymidine kinase substrates, such as [124I]FIAU [151,152,179,183–185], and the acyclic guanosine derivatives 8-[18F]fluoro-ganciclovir ([18F]FGCV; [150,173]), 8-[18F]fluoro-penciclovir ([18F]FPCV; [174,186]), 9-[(3-[18F]fluoro-1-hydroxy-2-propoxy)methyl]guanine ([18F]FHPG; [176,184,187,188]), 9-[4-[18F]fluoro-3-(hydroxymethyl)butyl]guanine ([18F]FHBG; [189–191]), and recently, also by 1-(2-fluoro-2-deoxy-β-
Imaging the Expression of Any GOI
As not all GOIs carry an enzymatic function, which could be used for an enzymatic radionuclide assay in vivo, the general attempt is to proportionally co-express any GOI with an imaging marker gene. Therefore, to be able to indirectly and quantitatively assess the expression of any GOI, gene co-expression strategies are being used. Apart from coordinately promoter-based co-expression ([152]; Figure 8), strategies serving a proportional co-expression of a PET or MRI marker gene and a GOI make use of gene fusion [200], of an internal ribosome entry site (IRES) derived from encephalomyocarditis virus (ECMV) [201,202] or of the proteolytic 2A-element derived from picornavirus [203,204]. In addition, co-administration of two distinct but otherwise identical adenovirus vectors has been shown to result in proportional co-expression of PET marker genes expressed by these vectors [205]. In single cell derived retrovirally transduced tumor clones, it could be demonstrated that PET imaging of HSV-1-TK expression could be used to monitor the topology and activity of the lacZ gene as second gene under the transcriptional control of a single promoter within a bicistronic unit that includes an IRES [201]. In a similar approach, the activity of proportionally co-expressed Renilla luciferase and a dopamine type 2 receptor could be quantified and localized by PET [202].
The applicability of this “indirect” imaging method has been translated into a model of vector application in vivo employing recombinant HSV-1 vectors which are commonly used for virus therapy of gliomas ([134,135,152,196]; Figure 8). In the first (hrR3) and second (MGH-1) generation HSV-1 vectors, the PET marker gene HSV-1-tk and the marker gene lacZ are under transcriptional control of early gene, and hence, timely coordinately active promoters [136,206]. The level and location of PET-based imaging of hrR3- and MGH-1-mediated TK-expression in vivo indirectly reflected the level and location of LacZ-expression and also the viral progeny of these vectors ([152]; Figure 8). However, the propensity of replication-conditional vectors to eventually disrupt cellular functions interferes with the enzymatic radiotracer assay so that the PET-imageable TK-expression mediated by these vectors identifies only the viable portion of infected tumor tissue.

Indirect localization (A) and quantification (B) of a second, proportionally co-expressed gene by [124I]FIAU-PET. HSV-1-tk gene expression has been studied in a subcutaneous human U87dEGFR tumor model in nude rats after intratumoral injection of the replication-conditional HSV-1 vector hrR3. This vector expresses HSV-1-tk and lacZ genes under immediate early promoters. Co-registration of transaxial [124I]FIAU-PET images of HSV-1-TK expression (A, left) with histochemical analysis of LacZ expression (A, right) revealed co-localization of both genes. Quantitative assays in cell culture revealed that the rate of accumulation of FIAU does not only reflect the level HSV-1-TK expression, but also correlates to secondary measures of this vector, such as viral progeny and level of LacZ expression. These results indicate that indirect localization and quantification of any gene of interest that is proportionally co-expressed with a PET marker gene is possible (from Jacobs et al. [152] with permission).

Extent of vector-mediated gene expression in [124I]FIAU-PET corresponds to therapeutic response in [11C]MET-and [18F]FDG-PET in the clinical application. Co-registration of [124I]FIAU-PET (left column) with [11C]MET-PET, [18F]FDG-PET, and MRI before (middle column) and after (right column) gene therapy. The region of specific [124I]FIAU retention (68 hr) within the tumor after HSV-1-tk transduction (white arrow, left column) showed signs of necrosis (cross, right column; reduced methionine uptake and glucose metabolism) after ganciclovir treatment (from Jacobs et al. [151] with permission).
To circumvent HSV-1 vector induced toxicity interfering with the PET imaging of these vectors, helper virus-free HSV-1 amplicon vectors [207] were engineered and functionally characterized. These vectors bear transcriptionally linked GOIs for proportional co-expression of three gene functions: (i) a marker gene for HSV-1 vector generation in culture (gfp); (ii) the HSV-1-tk as a PET marker gene for assessment of HSV-1 vector-mediated gene expression in vivo; (iii) a therapeutic gene (Escherichia coli cytosine deaminase; cd) for suicide gene therapy of gliomas (Jacobs et al., submitted). Functional proportional co-expression of the PET marker gene HSV-1-tk and the linked therapeutic E. coli cd-gene could be observed irrespective of the location of both genes within the constructs. These HSV-1 amplicon vectors carrying the HSV-1-tk as PET marker gene and a linked therapeutic gene shall enable the indirect noninvasive localization of the distribution of therapeutic gene expression by PET and, hence, shall allow the correlation of the primary transduction efficiency of these vectors with their induced therapeutic response.
Marking Vector Particles
A prerequisite for efficient gene transfer in humans is the development of technology for efficient delivery of vector particles into the body and diseased tissue, such as combining stereotaxy with CED [151]. To noninvasively localize the distribution of vector particles in vivo, labeling of vector particles has been developed. The time-course distribution of 111Indium-labeled HSV-1 vectors [208,209] and 99mTc-labeled adenovirus vectors (99mTc-AdV; [210]) demonstrated that most viral particles are trapped within the liver after systemic administration into the tail vein of mice. These types of marking studies are important in the further development of more efficient methods for vector application.
Further Marker Gene/Marker Substrate Combinations
In the field of molecular imaging, further marker gene/marker substrate combinations are currently being developed in various experimental models and they have been extensively reviewed over the past 2 years [25,165,182]. Some of these are summarized in Table 1. Most of these molecular imaging strategies go beyond application in gliomas and, therefore, these new imaging paradigms are only shortly summarized as follows.
E. coli Cytosine Deaminase
Early in the development of gene imaging paradigms, the E. coli cytosine deaminase gene (cd) has been proposed as a PET marker gene with fluorinated 5-fluorocytosine (5-FC) as a specific marker substrate [211]. However, because of the relatively slow uptake of 5-FC in cd-transduced cells, the metabolization of 5-FC to toxic 5-fluorouracil (5-FU), and the rapid efflux of 5-FU from transduced cells, the CD/5-FC combination does not meet some of the critical requirements for an ideal marker gene/marker substrate combination for radionuclide imaging [178]. On the other hand, the ability of MRS to follow prodrug conversion dynamically and to distinguish between individual metabolites is a significant advantage over PET methods, which would require measurement of plasma metabolite levels. As chemicalshift selective imaging of the distribution of 5-FU and its metabolites by MRS is feasible [212], this approach has been successfully used to noninvasively model and quantitate cytosine deaminase gene expression in subcutaneous human colorectal carcinoma xenografts in nude mice by MRS, and by implementing a three-compartment model to analyze the metabolic fluxes of 5-FC and its metabolites [169]. Moreover, indirect assessment of CD activity has been performed using a cdtk fusion gene and [124I]FIAU-PET imaging [213].
Aromatic l-Amino Acid Decarboxylase
A new marker gene/marker substrate combination was introduced by Bankiewicz et al. [214] in experiments where adeno-associated virus vectors (AAV) carrying the aromatic
Luciferase
The firefly and Renilla luciferase genes have been used as marker genes with
Further Molecular Imaging Paradigms

5-[18F]FC/5-[19F]FC: 5-fluorocytosine; AADC: aromatic

Time course of response of luciferase-expressing rat 9L gliosarcomas to BCNU chemotherapy. Intracranial growing 9L-LUC cells were monitored by serial T2-weighted MRI (A), and intratumoral luciferase activity was monitored by bioluminescence imaging (BLI; B). Quantitative analysis of tumor progression and regression to BCNU treatment is plotted in C. The solid vertical lines denote the apparent reductions of tumor volume and photon production elicited by BCNU on the day of treatment from which log cell kill values were calculated (D). No significant difference of therapy-induced cell kill was calculated between both methods indicating that glioma growth in experimental glioma models can be noninvasively followed by BLI (from Rehemtulla et al. [218] with permission).
This imaging system has been further developed to noninvasively study protein–protein interactions in vivo by a modification of the yeast two-hybrid system adapted for mammalian cells [162]. In short, the NF-kB promoter was used to drive expression of two fusion proteins (VP16-MyoD and GAL4-ID). Tumor necrosis factor-induced activation of the NF-kB promoter led to expression of both fusion proteins with subsequent interaction of MyoD with ID leading to GAL4-mediated binding to a GAL4-binding site with subsequent VP16-mediated activated transcription of the luciferase gene [162]. Induction of this paradigm could be imaged in vivo indicating that this system may have important implications in the noninvasive localization and assessment of protein–protein interactions in living subjects. Most importantly, the in vivo detection of luciferase enzyme as a transcriptional reporter facilitated rapid screening for both the presence and the function of transgenes in transgenic animals [219]. As reviewed by Hardy et al. [220], bioluminescent imaging has also been applied to study cell kinetics in vivo [220].
β-Galactosidase
β-Galactosidase is the most commonly used histochemical marker gene. Its expression can be detected by a colorimetric staining assay, in which the cleavage of an indicator substrate yields an opaque blue precipitate. Louie et al. [221] developed an interesting assay based on the use of β-galactosidase for in vivo imaging of gene expression by MRI by designing and synthesizing a contrast agent that is enzymatically processed by β-gal. The contrast agent (1-(2-(β-galactopyranosyloxy)propyl)-4,7,10-tris(carboxymethyl)-1,4,7,10-tetraazacyclododecane)gadolinium(III) consists of: (1) a chelator with high-affinity binding to gadolinium that occupies eight of the nine coordination sites of gadolinium, and (2) a galactopyranose residue positioned to block the remaining coordination site on the gadolinium ion from water. In this water-inaccessible conformation, the contrast agent is “inactive” and does not strongly modulate T1. However, β-galactosidase enzymatically cleaves the galactopyranose from the chelate, freeing a coordination site and causing the irreversible transition of the contrast agent to an “active” state. This method facilitated MRI of β-galactosidase expression to cellular resolution [221] indicating that in vivo mapping of gene expression in transgenic animals will be possible at high spatial resolution.
Dopamine Type-2 Receptor
PET was used to quantify the level of adenovirus vector-mediated expression of a wild-type [222–224] or mutated [225] dopamine-2-receptor (D2R) by using the specific D2-receptor binding compounds [11C] raclopride [223,224] and 3-(2′-[18F]fluoroethyl)-spiperone [222,225]. After injection into the rat striatum, a kinetic analysis revealed the maximum level of D2R expression 2–3 days after vector application declining to basal levels at Day 16 [223,224] indicating that various levels of D2R expression can be differentiated by PET. By placing the d2r gene and a mutated HSV-1-tk gene under transcriptional control of a bidirectional, tetracycline-responsive element, Sun et al. [226] could demonstrate that various levels of PET marker gene expression can be differentiated by PET in cell lines stably expressing these constructs depending on the state of induction [226]. These data indicate that PET can monitor time-dependent variations of gene expression mediated by inducible promoters.
Somatostatin and Other Receptors or Membrane Transporters
The gene encoding the human somatostatin receptor type-2 has also been used as marker gene with 99mTc-P2045 as specific marker receptor-binding compound which can be detected by gamma-camera and SPECT imaging [227]. Adenoviral vector-mediated expression of human carcinoembryonic antigen (CEA) expression in human D54MG glioma cells enabled noninvasive assessment of transduced subcutaneous gliomas by an 131I-labeled anti-CEA COL-1 monoclonal antibody [228]. Furthermore, an 18F-labeled glycopeptide was used to noninvasively assess endogenous alphavβ3 integrin expression on melanoma cells for tumor detection and therapy monitoring in a subcutaneous mouse model [229]. These studies indicate that exogenously introduced or endogenous cell surface receptor expression can be imaged by PET/SPECT, however, quantification of “true” receptor gene expression at high expression levels might be difficult due to saturation of cell membrane with receptors.
Moreover, the sodium/iodide symporter gene was used as marker and therapeutic gene to induce expression of this thyroid-derived iodide concentrator [230], however, this system is complicated by iodide efflux from transduced tumor cells indicating that irreversible trapping of the marker substrate does not occur [231].
Synthetic Receptors
Nuclear imaging may also be used to image novel cell-surface expressed fusion proteins typically not present on eukaryotic cells, a strategy being developed to probe for phenotypic changes in genetically manipulated cells [232]. The proposed artificial receptor consists of a binding domain such as a peptide-based chelator that binds 99mTechnetiumoxotechnetate (99mTc) and a membrane-anchoring domain. The most promising fusion protein to date consists of a metal-lothionein (MT)-derived C-terminal peptide fused to a type II membrane protein containing the N-terminal membrane-anchoring domain of neural endopeptidase (PEP). This leads to cell-surface expression of 99mTc-binding sites and enabling “tagging” of transduced cells with 99mTc for indirect assessment of the level of gene expression [232].
A marker gene coding for an engineered human transferrin receptor (ETR) has been used together with MRI to noninvasively follow the uptake of a sterically protected iron-containing probe [233] and monocrystalline iron oxide conjugated to transferrin (Tf-MION; [234]) in ETR-expressing cells. Intracellular Tf-MION accumulation could be localized within vesicle-like structures in the cytoplasm in cell culture, suggesting receptor-mediated endocytosis as the mechanism of entry into the cell. In vivo, ETR-positive tumors accumulated more Tf-MION and had higher signal intensity on T1-weighted MR images and lower signal intensity on T2-weighted images than negative control tumors suggesting that the presence or the absence of marker gene expression can be detected by MR using this MR-marker receptor, however, quantitation of gene expression is difficult [234].
Proteases (Cathepsin, Matrix Metalloproteinase-2)
A further method was developed for noninvasive assessment of protease expression by near-infrared fluorescence imaging (NIRFI) using synthetic protease-sensing probes consisting of biocompatible auto-quenched near-infrared fluorochromes that are released from long-circulating synthetic graft co-polymers by protease-specific cleavage [235,236]. By using this method, the level of Cathepsin-B expression could be noninvasively assessed in mice bearing experimental breast cancer, suggesting that Cathepsin-B may be used as a new marker gene for NIRF optical imaging, molecular profiling and screening [237–239]. Similarly, assessment of matrix metalloproteinase-2 (MMP-2) activity by NIRFI was developed by implementing an optical contrast agent that was highly activatable by means of MMP-2-induced conversion [237]. This method allowed a noninvasive assessment of successful MMP-2 inhibition in a therapeutic model [240] indicating that this method might serve surrogate biomarkers to study the effects of MMP inhibitors in vivo.
Further Molecular Imaging Applications
Cell Trafficking
Molecular imaging aims towards the in vivo characterization and measurement of biological processes at the cellular and molecular level. Therefore, noninvasive trafficking of cells in disease pathogenesis over time is another exciting and evolving field in molecular imaging. A noninvasive imaging technique for cells is of special importance as quantitation and kinetic analysis of cell distribution in organs is time-consuming and unreliable. In general, any kind of cell which moves from one location to another within the body may be investigated, for instance, stem cells or neural progenitor cells migrating from intact brain across hemispheres towards gliomas [241] or stroke [242]; T-cells or other specific immune cells; or tumor cells [220].
The migration of 3 × 10⁷ superparamagnetically labeled T-cells through the spleen of a mouse during a 24-hr period has been investigated recently with MR using spin-echo pulse sequence at 4.7 T [243]. T-cells were loaded with iron oxide nanoparticles derivatized with a peptide sequence from the transactivator protein (Tat) of HIV-1. Homing of labeled T-cells into the spleen could be noninvasively observed by a decrease in MRI signal intensity within 1 hr after systemic administration of cells indicating that biodistribution of labeled cells by MRI is possible [243]. The same method was successfully used for cell trafficking studies of hematopoietic and neural progenitor cells indicating that noninvasive analysis of specific stem cell and organ interaction becomes possible, which is critical for advancing the therapeutic use of stem cells [244].
In another experiment, Copper-64-pyruvaldehyde-bis(N4-methylthiosemicarbazone) (64Cu-PTSM) has been used to radiolabel C6 rat glioma cells and lymphocytes without affecting cell viability and proliferation rate and has enabled trafficking of C6-cells into lungs and liver and of lymphocytes into spleen after tail-vein injection in mice [245]. PTSM mediates transmembrane transport of 64Cu into cells. The process by which 64Cu is retained in cells is governed by the reduction of the stable 64Cu(II)–PTSM complex to a labile 64Cu(I)–PTSM complex, trapping the dissociated 64Cu(I) ion in the cell because of charge [245].
Moreover, systemic distribution and tumor localization of adoptively transferred lymphocytes were investigated in mice using 111In-oxine-labeled, primed T lymphocytes directed against the tumor [246]. Interestingly, no significant differences were observed between primed and control naïve T lymphocytes with respect to systemic distribution of cells in normal organs and with respect to kinetics of lymphocyte localization to the tumor apart from delayed clearance of primed lymphocytes from the lungs [246]. These studies indicate that detailed analyses of homing of genetically engineered T-cells are possible over time in the same experimental animal.
Bioluminescence imaging has also been used for cell trafficking studies, for example, to monitor quantitatively the growth and regression of labeled human cervical carcinoma cells engrafted into immunodeficient mice in response to both chemotherapy and immunotherapy using human T-cell-derived effector cells [247]. In the absence of therapy, animals showed progressive increase in signal intensity over time. Cisplatin treatment as well as immunotherapy dramatically reduced signals at high effector-to-target cell ratios, and significant decreases were observed with lower ratios. These results indicate that noninvasive bioluminescence imaging allows sensitive, quantitative, real-time spatio-temporal analyses of the dynamics of neoplastic cell growth and facilitates the rapid assessment of effective treatment strategies [220,247].
Signal Transduction
Apart from cell trafficking experiments, noninvasive imaging of signal transduction pathways has been explored. The first noninvasive characterization of a signal transduction pathway has been successfully performed by Doubrovin et al. [248]. The tkgfp dual reporter gene [200] was used to monitor transcriptional activation of p53-dependent genes. Human U87 glioma and SaOS-2 osteosarcoma cells were retrovirally transduced with the Cis-p53/TKGFP reporter system, in which the tkgfp marker gene was placed under control of an artificial cis-acting p53-specific enhancer. In rat xenografts, the DNA damage-induced up-regulation of p53 transcriptional activity correlated with the expression of p53-dependent downstream genes in U87 (wild-type p53), but not in SaOS-2 osteosarcoma (p53 −/−) cells and with the level of p53-dependent TKGFP expression as assessed by [124I]FIAU-PET. These data indicate that PET is sufficiently sensitive to image the transcriptional regulation of genes in certain signal transduction pathways. This molecular imaging strategy shall enable noninvasive assessment of the activity of signal transduction pathways, of the expression of different endogenous genes and of novel therapeutic strategies in vivo [248].
Furthermore, a noninvasive method for imaging T-cell activity in vivo has been developed in order to study the role of specific genes and signal transduction pathways in the course of normal and pathologic immune response and to elucidate the temporal dynamics and immune regulation at different stages of disease [249]. T-cell receptor (TCR)-dependent nuclear factor of activated T cells (NFAT)-mediated activation of T cells was noninvasively quantified by optical fluorescence imaging (OFI) and PET. Again, the tkgfp dual reporter gene [200] was used to monitor NFAT-mediated transcriptional activation in human Jurkat cells. Transduced Jurkat cells expressing the tkgfp gene under transcriptional control of an artificial cis-acting NFAT-specific enhancer were used to establish subcutaneous infiltrates in nude mice. Noninvasive imaging of T-cell activation was achieved after systemic administration of antihuman CD3 and CD28 antibodies to induce the NFAT pathway. PET imaging of TCR-induced NFAT-dependent transcriptional activity may be useful in the assessment of T-cell responses, T-cell-based adoptive therapies, vaccination strategies, and immunosuppressive drugs [249].
Imaging of Transgenic Animals
To further elucidate the potential role of molecular imaging strategies in the molecular characterization of disease models, repetitive microPET imaging was used to demonstrate that regulation of endogenous albumin gene expression can be noninvasively assessed in transgenic mice in which the HSV-1-tk marker gene is driven by the albumin enhancer/promoter to target HSV-1-tk gene expression to be restricted to hepatocytes [250]. These AL-HSV-1-tk-transgenic mice (137–7) were originally generated to develop an inducible model of hepatic disease which can be utilized to repopulate the liver with donor cells [251].
Conclusions
In the management of patients with gliomas, noninvasive MRI and PET imaging techniques as well as gene co-expression strategies are being used to noninvasively (i) delineate biologically active glioma tissue amenable for gene and cell therapeutic strategies; (ii) to detect glioma progression and early recurrence; (iii) to save neurological function during neurosurgery, brachy- and radiotherapy; and (iv) to determine the “tissue dose” of vector-mediated gene expression. These methods shall answer the most important question in biological treatment strategies, such as gene therapy, of how much PET-imageable vector-mediated gene transduction is necessary to reach a certain therapeutic response. PET and MRI may also help to gain knowledge about further variables, such as particle size and tissue composition, which may have substantial impact on the distribution of locally delivered molecules using modern vector application modes, such as convection-enhanced delivery. Monitoring the correlation between primary transduction and therapeutic efficiency of a vector is highly desirable especially in the clinical application of gene therapy of gliomas and will have a critical impact on the development of safe and efficient vector applications in humans.
Footnotes
Acknowledgments
This work is supported in part by the Ministerium für Schule, Wissenschaft und Forschung NRW (MSWF 516-40000299), the Center of Molecular Medicine Cologne (ZMMK-TV46), and the Max-Planck-Society, Germany.