
Abstract
Cancer gene therapy is an active area of research relying upon the transfer and subsequent expression of a therapeutic transgene into tumor cells in order to provide for therapeutic selectivity. Noninvasive assessment of therapeutic response and correlation of the location, magnitude, and duration of transgene expression in vivo would be particularly useful in the development of cancer gene therapy protocols by facilitating optimization of gene transfer protocols, vector development, and prodrug dosing schedules. In this study, we developed an adenoviral vector containing both the therapeutic transgene yeast cytosine deaminase (yCD) along with an optical reporter gene (luciferase). Following intratumoral injection of the vector into orthotopic 9L gliomas, anatomical and diffusion-weighted MR images were obtained over time in order to provide for quantitative assessment of overall therapeutic efficacy and spatial heterogeneity of cell kill, respectively. In addition, bioluminescence images were acquired to assess the duration and magnitude of gene expression. MR images revealed significant reduction in tumor growth rates associated with yCD/5-fluorocytosine (5FC) gene therapy. Significant increases in mean tumor diffusion values were also observed during treatment with 5FC. Moreover, spatial heterogeneity in tumor diffusion changes were also observed revealing that diffusion magnetic resonance imaging could detect regional therapeutic effects due to the nonuniform delivery and/or expression of the therapeutic yCD transgene within the tumor mass. In addition, in vivo bioluminescence imaging detected luciferase gene expression, which was found to decrease over time during administration of the prodrug providing a noninvasive surrogate marker for monitoring gene expression. These results demonstrate the efficacy of the yCD/5FC strategy for the treatment of brain tumors and reveal the feasibility of using multimodality molecular and functional imaging for assessment of gene expression and therapeutic efficacy.
Keywords
Introduction
In the field of experimental cancer therapeutics, reduction of tumor volume is considered as the standard for quantitation of treatment success. This measurement is typically obtained late in the course of therapy and does not take into account regional heterogeneity in treatment effectiveness. Spatial differences in tumor treatment response are also a confounding clinical problem, which can arise from, for example, regional differences in perfusion, chemosensitivity, and, in the case of cancer gene therapy protocols, nonuniform delivery/expression of the therapeutic transgene. Development of early indicators of treatment response, which could also provide information related to the spatial heterogeneity of the effects of treatment, would be of significant benefit for both experimental and clinical trials. Because molecular and cellular changes precede macroscopic changes in tumor size, we have investigated the use of magnetic resonance imaging (MRI) for quantitating therapeutic-induced changes in tumor water diffusion. Diffusion of water in tissue is strongly affected by viscosity and membrane permeability between intra- and extracellular compartments, active transport and flow, and directionality of structures that impede or enhance mobility. As depicted in Figure 1, treatment of tumors may result in damage and/or killing of cells, thus altering the integrity of cell membranes, thereby increasing the fractional volume of the interstitial space due to apoptotic body formation and cell loss. These changes have been shown to increase the mobility (diffusion) of water in the damaged tumor tissue. Diffusibility of tissue water in vivo can be noninvasively quantified as an apparent diffusion coefficient (ADC) by using diffusion MRI. In diffusion-weighted imaging, the MR signal intensity is made dependent on water mobility by the application of additional pulsed magnetic field gradients to the MR sequence [1]. Individual nuclear spins accumulate a phase shift proportional to their spatial position within the magnetic field gradient. After waiting a given evolution time for spins to diffuse, an identical but inverse pulse is applied, which results in a complete refocusing of stationary spins, while the mobile spins (those undergoing movement due to diffusion) are refocused incompletely. Thus, the paired gradient pulses attenuate the signal in proportion to local tissue water mobility, and quantitative measurements of diffusion (in ADC units) are obtained by measuring signal attenuation as a function of varying gradient strength and evolution time. Recent work has demonstrated that diffusion MRI is highly sensitive to microscopic changes in tissue structure and physiology [2],[3]. We and others have previously shown that diffusion MRI detects early changes in water diffusion in animal tumor models following initiation of therapy [3–10], which precede changes in tumor growth kinetics and tumor regression. Whereas diffusion MRI has been studied in the context of several antineoplastic therapeutic paradigms [3–10], there have been no reports of using this approach for monitoring therapeutic effects of viral delivery of the yeast cytosine deaminase (yCD) therapeutic transgene.

Schematic of the “Diffusion Hypothesis.” Diffusion of water within tumor cells is limited by cell membranes. Diffusion of water in the interstitial space is also limited by the high density of tumor cells. Treatments that kill cells compromise cell membrane integrity and may cause cells to fragment or apoptose and become smaller, thereby removing barriers to diffusion. These changes should occur before changes in overall tumor volume.
Gene therapy of cancer attempts to overcome the dose-limiting systemic toxicity of chemotherapy by introducing a gene into tumor cells that encodes for an enzyme that converts low-toxicity prodrugs into potent cytotoxic agents. The success of this approach depends on adequate transgene expression, efficient prodrug delivery and conversion to cytotoxic agent, the relative sensitivity of the tumor to this agent, and, finally, the ability of the cytotoxic agent to reach a majority of the tumor cells. Noninvasive imaging approaches using radionuclide or optical reporters are currently available, which allow quantitation of transgene expression. In this current study, we have chosen to use in vivo bioluminescence imaging (BLI) as we have recently shown that it can provide quantitative data for studying orthotopic brain tumors in rats [11]. In brief, BLI relies on the detection of light emitted from the expression of the bioluminescent enzyme firefly luciferase (Luc) from the tumor cells [11],[12]. The use of BLI allows for rapid and repetitive measurements of transgene expression providing an opportunity to assess gene expression levels over the duration of prodrug administration. These types of surrogate markers for gene expression using BLI and correlation with spatial heterogeneity of therapeutic response using diffusion MRI will ultimately assist with preclinical optimization of gene therapy paradigms prior to translation into the clinical setting.
In this study, we have applied diffusion MRI to evaluate the response of orthotopic 9L gliomas to the adenoviral-delivered yCD gene therapy paradigm. The prodrug used in these studies is Flucytosine (5-fluorocytosine, 5FC), first identified in a 1957 search for novel antineoplastic agents [13]; however, it has only found clinical use as an antifungal drug. 5FC itself does not elicit cytotoxicity, and its antimycotic efficacy depends on the ability of the microbial enzyme CD to convert 5FC to the antimetabolite 5-fluorouracil (5FU). CD is not found in mammals, thus providing 5FC with a favorable therapeutic index. The cloning of microbial CDs, coupled with the advances in gene transfer technology, has created a new role for Flucytosine in cancer therapy. As shown in Figure 2, through the expression of the yCD gene specifically in tumor cells, followed by systemic administration of 5FC, 5FU can be produced in the tumor itself. The resulting “localized” 5FU chemotherapy may avoid the systemic toxicity associated with intravenous 5FU therapy and may improve outcomes by achieving higher intratumoral 5FU concentrations.

Schematic of yCD/5FC gene therapy. Transfer of the cDNA for yCD into tumor cells causes them to express the yCD protein. Upon entering such transduced tumor cells, 5FC is converted to the chemotherapeutic agent 5FU. Like 5FC, 5FU is membrane-permeable and may leave the transduced cell to kill neighboring tumor cells. Endogenous enzymes form fluorinated nucleotides (FNuct) from 5FU. FNucts mediate the cytotoxicity of yCD/5FC gene therapy via thymidylate synthase inhibition by FdUMP, disruption of nucleotide pools, and incorporation into RNA.
The current clinical use of 5FU is predominantly involved with the treatment of gastrointestinal malignancies. Cytosine deaminase and other gene therapy strategies are particularly suited to the treatment of malignancies of the central nervous system (CNS) such as glioma since unlike other solid malignancies, gliomas rarely metastasize, making local control of primary tumor burden the focus of therapy. This facilitates tumor-specific delivery/targeting of therapeutic genes by direct stereotactic injection, even when the tumor is not surgically resectable. In addition, the normal CNS parenchyma surrounding gliomas is mitotically inactive; thus, the therapeutic index for proliferating cell-selective cytotoxic agents may be improved by local production of the agent within the CNS. Furthermore, the relatively immune-privileged status of the CNS may limit the host response to the foreign gene products and viral vectors used in gene therapy. Cytosine deaminase gene therapy offers a number of potential advantages over other approaches. Firstly, the enzymatically produced 5FU is not cell-cycle stage specific, which is important as only a fraction of the tumor cells is typically dividing at any given point in time. Secondly, 5FC is membrane permeable, has a high bioavailability, and penetrates the blood-brain barrier and cerebrospinal fluid well [14],[15]. Thirdly, 5FU may freely diffuse across cell membranes resulting in an improved killing of untransduced “bystander” cells. Such bystander effect killing is essential for successful gene therapy because of the inefficiency of currently available in vivo gene transfer methodologies. Finally, 5FU is also a potent radiosensitizing agent [16] and has been shown to have therapeutic activity alone and in combination in orthotopic rodent glioma models [17],[18].
A number of studies have reported growth inhibitory activity of CD gene therapy in glioma cell lines [19–24]. In each of these studies, the Escherichia coli CD (bCD) gene was used due to the ready availability of its cDNA. In vivo activity has been observed following treatment of subcutaneous tumors derived from glioma cells transduced with bCD prior to implantation [20–24], and in one orthotopic model using adenoviral transduction [19]. The bCD gene was used in these studies because of its ready availability, however, yCD deaminates 5FC much more efficiently than bCD. The cDNA for Sacchromyces cerevisiae was recently cloned [25],[26], and we have demonstrated that yCD significantly improves the efficacy of CD gene therapy in human colorectal carcinoma xenografts [27]. This was attributed to the more favorable Km and Vmax of yCD for 5FC, which we showed to be 22-fold lower and 6-fold higher than those of bCD, respectively.
The results of this study indicate that yCD has good potential to enhance the therapeutic outcome for glioma patients and that diffusion MRI may provide an early, spatial indicator of the tumor response to yCD/5FC treatment.
Materials and Methods
Vectors and Cell Lines
Using an adenoviral transfer vector that contains the EF1α promoter (kindly provided by Dr. Ken Dornfeld, University of Michigan) driving transcription of the yCD coding sequence [27], as well as an internal ribosome entry site derived from the EMCV virus and the luciferase gene (Clonetech, CA), a recombinant adenovirus that expresses yCD and luciferase was constructed at the University of Michigan. The ability of the recombinant virus to drive expression of functional yCD and luciferase in a quantitative fashion was confirmed in tissue culture experiments using the relevant antisera in Western blot assays, as well as activity assays (data not presented).
Rat 9L glioma cells, obtained from the Brain Tumor Research Center (University of California, San Francisco), were grown as monolayers in minimal essential medium supplemented with 10% fetal calf serum, 100 IU/ml penicillin, and 100 mg/ml streptomycin at 37°C in a 95/5% air/CO2 atmosphere. Cells were harvested, counted, and resuspended for tumor implantation at a concentration of 105 cells/10 μl.
Animal Model
Intracerebral 9L tumors were induced in male Fischer 344 rats weighing between 125 and 150 g as previously described [28]. Briefly, 9L cells (105) were implanted in the right forebrain at a depth of 3 mm through a 1-mm burr hole. The surgical field was cleaned with 70% ethanol, and the burr hole was filled with bone wax to prevent extracerebral extension of the tumor. Administration of yCD adenovirus was accomplished when the tumors reached between 20 and 100 μl in volume. 5FC was given as a solution in normal saline by intraperitoneal injection at a dose of 1 g/kg once per day for the duration of the experiment. Control 9L tumor animals received vehicle-only injections.
Initially, 10 animals were intracerebrally implanted with 9L cells. This group of animals was divided into a sham treatment (n = 5) and yCD/5FC adenoviral treatment (n = 5) group. Each of these animals received injections of yCD adenovirus (3 × 10⁹ particles in 30 μl) at 12 and 14 days post-cell implantation. Intraperitoneal administration of PBS (control group) or 5FC (1g/kg body weight) for 10 days was initiated at Day 18 post-cell implantation. Diffusion MRI scans were acquired in 2–3-day intervals over the course of the experiment for three animals in each of the two groups. Assessment of therapeutic efficacy was accomplished using animal survival.
In a follow-up experiment to assess in vivo yCD transgene expression, nine animals were intracerebrally implanted with 9L cells. On Day 12 post-cell implantation, initial diffusion and T2-weighted MR images were acquired on all animals. The yCD/Luc adenovirus was administered (3 × 10⁹ particles in 30 μl) on Days 14 and 15 post-cell implantation under inhalation anesthesia. Three animals were sacrificed on Day 16 post-cell implantation (1 day following the second adenoviral injection) for immunohistochemical analysis for yCD expression. The remaining six animals were divided into a saline control (n = 3) and 5FC treatment (n = 3) group (1 g 5FC/kg body weight once a day, ip). Both MRI and BLI were accomplished on these six animals every 2–3 days for the duration of the experiment.
Diffusion MRI
Imaging was performed every other day beginning at 12 days after tumor cell implantation on either a 2- or 7-T Varian Unity Inova imaging system. For MRI examination, rats were anesthetized with an isofluorane/air mixture and maintained at 37°C inside the magnet using a heated, thermostated circulating water bath. A single-slice gradient-echo sequence was used to confirm proper animal positioning and to prescribe subsequent imaging. An isotropic, diffusion-weighted sequence [29] was employed with two interleaved b-factors (Δb = 1148 sec/mm2) and the following acquisition parameters: TR/TE=3500/60 msec, 128 × 128 matrix, and a 3-cm FOV. It has been shown that there are no significant differences in ADC values measured by faster two-point diffusion techniques versus six b-factor methods [30]. Thirteen 1-mm-thick slices separated by a 0.2-mm gap were used to cover the whole rat brain. The z gradient first moment was zeroed to reduce the dominant source of motion artifact. To further reduce motion artifact, a 32-point navigator echo was prepended to each phase-encode echo. The phase deviation of each navigator echo relative to their mean was subtracted from the respective image echoes prior to the phase-encode Fourier transform. The low b-factor images were essentially T2-weighted to allow tumor volume measurements, as previously described [29]. Images were acquired prior to adenoviral administration and at 2- or 3-day intervals thereafter. Isotropic ADC maps were calculated for each image set and ADC pixel value histograms were generated from tumor ROIs combined across slices.
Tumor volume was assessed on late-echo images where the tumor appears hyperintense. These images were acquired as part of the diffusion-weighted scan (low b-factor images, TR/TE = 3500/60 msec) or in a separate standard T2-weighted series (TR/TE = 3000/80 msec). The tumor boundary was manually defined on each slice using a region-of-interest tool, then integrated across slices to provide a volume estimate. Tumor doubling time was determined by a linear least-squares-fit to the logarithm of tumor volume versus time using all posttreatment (or sham treatment) time points.
In Vivo BLI
In vivo BLI was conducted on a cryogenically cooled imaging system (Xenogen, Alameda, CA) coupled to a data acquisition computer. Prior to imaging, animals were anesthetized in a Plexiglas chamber filled with 2% isofluorane/air mixture and 150 mg/ml of luciferin (potassium salt, Xenogen) in normal saline was injected (IP) at a dose of 150 mg/kg body weight. This dose and route of administration has been previously shown to be optimal for studies in rats when images were acquired between 10 and 20 minutes post-luciferin administration [11]. During image acquisition, isofluorane anesthesia was maintained using a nose cone delivery system and animal body temperature was regulated using a digitally thermostated bed. A greyscale body surface image was collected in the chamber under dim illumination, followed by acquisition and overlay of the pseudocolor image representing the spatial distribution of detected photon counts emerging from active luciferase within the animal. An integration time of 1 min was used for luminescent image acquisition. Signal intensity was quantified as the sum of all detected photon counts within a region of interest prescribed over the rat head.
Immunohistochemistry
Paraffin-embedded tissues were sectioned and mounted on glass slides using standard techniques. The sections were first washed in xylene for 5 min, and again for 5 min each in 100%, 70%, 50%, and 30% ethanol, and, finally, in water. Prior to incubation with the anti-yCD rabbit antiserum (1:500) overnight, the sections were incubated for 1 hr in 5% normal goat serum followed by a wash in Tris-buffered saline containing 0.01% Tween (TBST). Similarly, prior to incubation with the secondary antibody (1:200 dilution of an antirabbit antibody conjugated with horseradish peroxidase), the sections were washed in TBST. After incubating the sections with the secondary antibody for 1 hr, the sections were washed three times in TBST and developed.
Results
We have recently reported that stable expression of yCD within orthotopic 9L tumors resulted in tumors that were curable by systemic treatment with 5FC [29]. In this current study, we examined the ability to confer sensitivity of orthotopic 9L tumors to 5FC treatment following transfer of the yCD transgene using an adenoviral vector. The yCD adenovirus was administered to 10 animals as described in the Materials and Methods. Animals were equally divided into control and 5FC-treated groups. In addition to animal survival, the effects of the heterogeneous distribution of yCD transgene expression on tumor cell viability was examined using multislice diffusion-weighted MRI. Shown in Figure 3 (upper left) are diffusion-weighted transverse MR images of a rat that was treated with the adenoviral vector but received only phosphate-buffered saline (PBS) and no 5FC. In this image, the brightness of the tissue region (or voxels) is proportional to the diffusibility of water. The very bright regions within the normal brain correspond to cerebral spinal fluid located within the ventricular space. The tumor, located in the right hemisphere, has, overall, a slightly higher diffusion value than that of the normal brain parenchyma. In addition, the tumor image displays a relatively uniform pattern of diffusion values, indicating a uniform distribution of cellular structures (e.g., intra- and extracellular space). All of the voxels from the entire tumor mass were combined and plotted in a histogram format (Figure 3; upper right panel). While this format removes spatial information as related to anatomical position, it allows the display of all of the values obtained from the entire tumor in a single plot providing for visualization of the changes over time. Diffusion histograms plotted for this rat at Days 21, 24, and 26 postimplantation remained essentially unchanged in ADC units, except that they increased in area due to increased tumor volume over this period. In contrast, a rat treated identically, except that 5FC was administered daily from Day 18 through Day 28, yielded an entirely different effect on the diffusion MR image. The effects of 5FC treatment on tumor diffusion are easily seen in Figure 3 (lower left) as a heterogeneous distribution of bright voxels located throughout the tumor mass. The interpretation of these images is that the bright areas (high diffusion) represent regions of yCD expression leading to conversion of 5FC to the cytotoxic product, 5FU, with subsequent cell death leading to regions of focal necrosis. Histogram analysis of this tumor over time is shown in Figure 3 (lower right). In contrast to what was observed in the untreated animal (Figure 3, upper right), the histogram for the 5FC-treated animal broadened with a fraction of the histogram area moving to the right (higher diffusion) to an approximate mean of 1.5 ADC units. The fraction of tumor tissue that exhibited an increase in diffusion is interpreted as the relative fraction of the tumor that is undergoing a significant therapeutic response. The region of the histogram in the treated animal that did not increase but remained at approximately 1–1.2 ADC units is most likely reflective of the cell fraction that was not exposed to sufficient 5FU concentrations. At Day 28, administration of 5FC was terminated, and the tumor subsequently began to regrow as shown by the Day 34 histogram (Figure 3, lower right). This histogram shows that repopulation of the solid portion of the tumor is occurring as a loss of high diffusion regions was observed. This, in fact, was consistent with the observed recurrent tumor using anatomical MR images of this animal.

Representative ADC maps of PBS control (top left) and 5FC -treated tumors (bottom left) at 7 days postinitiation of 5FC administration. Note the areas of increased ADC values (bright regions) within the 5FC treated tumor as compared to the control animal. Serial histograms of tumor pixel ADC values from the control (top right) and the 5FC-treated animal (bottom right). The number of days post-tumor cell implantation is shown to the right of each histogram. The histograms displayed in gray correspond to the same time points of the ADC diffusion maps (upper / lower left). Administration of the adenoviral vector did not affect the average tumor diffusion values as shown in the control. Treatment with 5FC produced a nonuniform increase in tumor diffusion values, which is interpreted to be due to heterogeneous expression of the yCD transgene within the tumor mass due to the limitations of direct intratumoral injection of the vector.
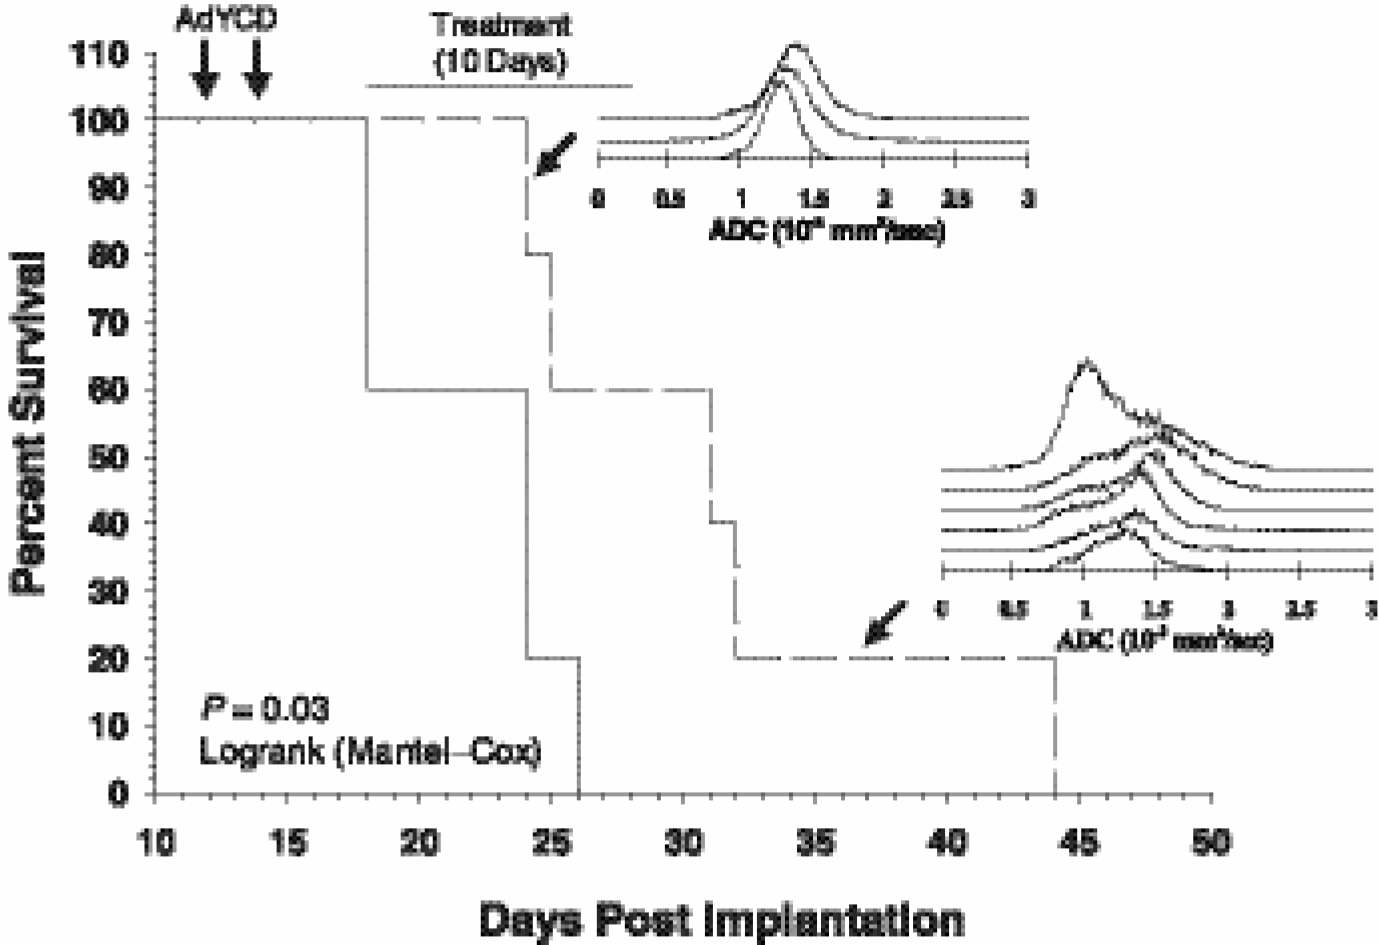
Kaplan-Meier cumulative survival plot as a function of days postorthotopic implantation of 9L tumor cells. The two adenoviral injections are indicated by the downward pointing arrows. The 10-day duration of treatment with PBS and 1 g/kg of 5FC by daily intraperitoneal injection is indicated by the horizontal line. Mean survival of the control (yCD + PBS) was 22.0 ± 1.7 days (s.e.m.) versus 31.2 ± 3.6 days for the treated group (yCD + 5FC) (n = 5 animals per group). The ADC histograms correspond to two different 5FC-treated animals, one surviving 25 days and the other 44 days (see arrows). Note the much greater increased diffusion values for the longer-surviving animal and is interpreted to reflect that this animal received a significantly greater tumor cell kill than the animal surviving only 25 days.

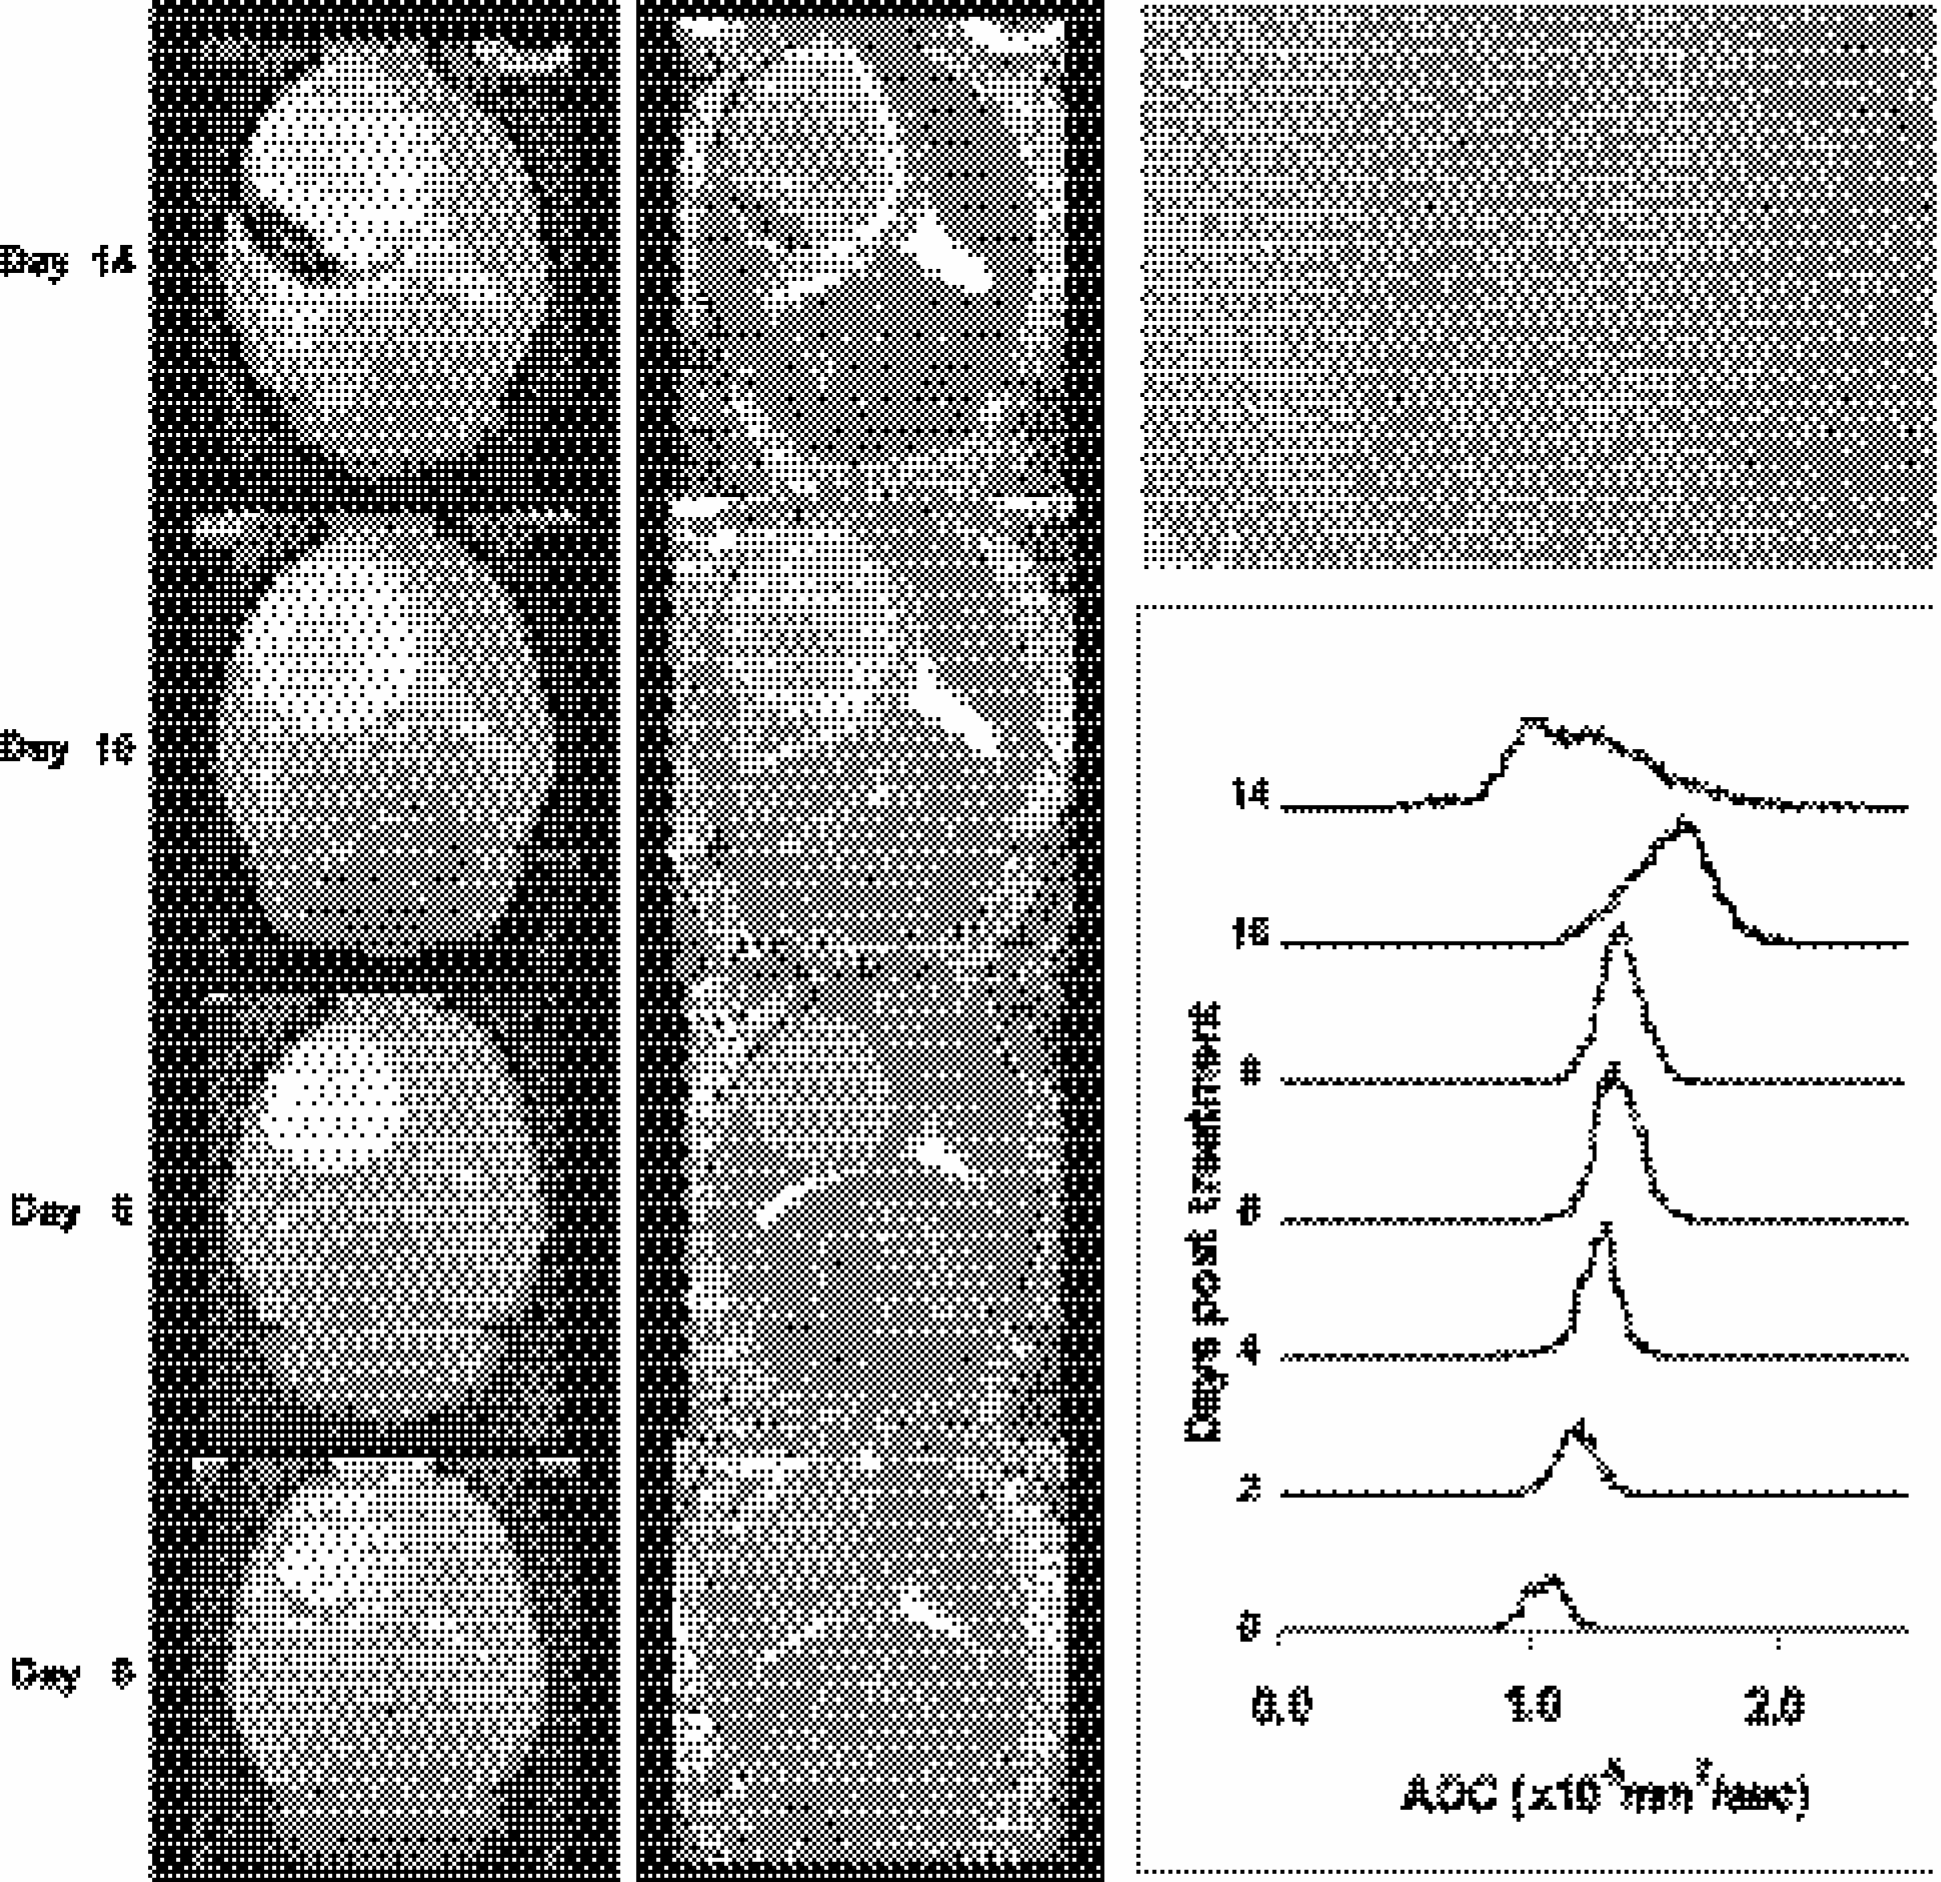
Serial T2-weighted transverse MR brain images (left column) acquired from Rat no. 1, which had been injected with yCD adenovirus. Images correspond to 1 hr prior to 5FC treatment (Day 0) through Day 18 of treatment. Corresponding ADC maps (middle column) reveal the spatial changes in diffusion values, which occur throughout the tumor mass over the course of treatment. Serial histograms of ADC values in the 9L yCD/5FC-treated tumor over time are shown in the box located in the bottom right. The displayed histograms represent the total number of pixels contained within the tumor with a given ADC value. Note that early increases in diffusion values (Days 2 and 4) are evident, which increase over time during treatment. H&E-stained section (upper right) of the tumor taken from the animal at 18 days posttreatment with 5FC revealing minimal necrosis consistent with the Day 18 histogram, which revealed that the tumor had grown and returned to pretreatment values (e.g., repopulation of the tumor mass had occurred).
Serial T2-weighted transverse MR brain images (left column) acquired from Rat no. 2, which had been injected with yCD adenovirus. Images correspond to 1 hr prior to 5FC treatment (Day 0) through Day 14 of treatment. Corresponding ADC maps (middle column) reveal the spatial changes in diffusion values that occurred throughout the tumor mass over the time course of treatment. Serial histograms of ADC values in the 9L yCD/5FC-treated tumor over time are shown in the box (bottom right). The displayed histograms represent the total number of pixels contained within the tumor with a given ADC value. Note that early increases in diffusion values (Day 2) are evident, which increase over time during treatment. H&E-stained section (upper right) of the tumor taken from the animal at 14 days posttreatment with 5FC revealed moderate necrosis and, thus, increased extracellular space within the tumor mass. This result is consistent with the Day 14 histogram, which revealed a broad, bimodal distrubution of the ADC values within the tumor (e.g., moderate repopulation/removal of the tumor cells killed by treatment had occurred).
The efficacy of yCD/5FC adenoviral treatment for orthotopic 9L tumors was measured by animal survival. Shown in Figure 4 is a Kaplan-Meier plot of animal survival. While all of the treated animals succumbed to tumor burden, a significant increase in mean survival between the control (yCD + PBS) = 22.0 ± 1.7 (s.e.m.) and treated (yCD + 5FC) groups 31.2 ± 3.6 (s.e.m.) was observed (p = .03, Mantel-Cox logrank test). A comparison of a diffusion MRI histogram obtained from a rat, which succumbed early (e.g., Day 25 post-cell implantation), with that of a longer surviving animal (e.g., Day 44) revealed striking differences in diffusion changes. The animal, which had a minimal improvement in overall survival, was found to have a relatively minimal increase in overall diffusion values during the course of treatment. In contrast, the animal with a much longer life span had a large-increase diffusion values over a significant fraction of the overall tumor mass. While these data are anecdotal and require further follow-up, it is nevertheless worth noting that the magnitude of the increase in tumor diffusion values correlated with improved therapeutic outcome in this study.

Serial T2-weighted transverse MR brain images (left column) acquired from Rat no. 3, which had been injected with yCD adenovirus. Images correspond to 1 hr prior to 5FC treatment (Day 0) through Day 8 of treatment. Corresponding ADC maps (middle column) reveal the spatial changes in diffusion values that occurred throughout the tumor mass over the time course of treatment. Serial histograms of ADC values in the 9L yCD/5FC-treated tumor over time are shown in the box (bottom right). The displayed histograms represent the total number of pixels contained within the tumor with a given ADC value. Note that early increases in diffusion values (Day 2) are evident, which increase over time during treatment along with significant growth of the tumor mass. H&E-stained section (upper right panel) of the tumor taken from the animal at 8 days posttreatment with 5FC revealed large areas of coagulative necrosis within the tumor mass. This result is consistent with the Day 8 histogram, which revealed a broad, bimodal distribution of the ADC values from the tumor mass along with a higher number of ADC values relative to values observed prior to treatment (e.g., limited repopulation/removal of the tumor cells, which were killed by the treatment, had occurred).
An additional series of experiments was accomplished on a group of nine animals in order to more fully investigate the use of diffusion MRI for individualization of treatment monitoring for viral tumor gene therapy. In addition, kinetic information related to the temporal changes associated with in vivo yCD expression during 5FC administration was obtained using BLI in an effort to monitor the longevity of the cells, which produced the cytotoxic product, 5FU (e.g., “factory” cells). Six animals were followed throughout the course of 5FC (n = 3) or PBS (n = 3) treatment with both MRI and BLI. Shown in Figure 5 are MR data sets obtained from Rat no. 1. Serial T2-weighted transverse MR images are shown in the left column. Images correspond to 1 hr prior to 5FC treatment (Day 0) through Day 18 of treatment. From these images, it is evident that the tumor did not regress during the treatment. The corresponding ADC maps (Figure 5; middle column) revealed the spatial changes in diffusion values that occurred within the tumor mass over the course of treatment. From the Days 4 and 14 diffusion maps (middle column), it is evident that regions of the tumor tissue appeared brighter, indicating that an increase in tumor diffusion values had occurred in those regions. Serial histograms of ADC values in this 9L yCD/5FC-treated tumor confirmed these findings and are shown in the box located in the bottom right of Figure 5. Each displayed histogram represents the distribution of the total number of pixels contained within the tumor (y axis) with the corresponding ADC values (x axis). Note that early, heterogeneous increases in tumor diffusion values (Days 2 and 4) are observable, which increase over time during treatment. The area under the histogram represents the total number of voxels within the tumor, therefore, the area of the histogram is actually proportional to the volume of the tumor mass. From these histograms, it appeared that the tumor volume was growing at a very slow rate during treatment. During the time where the tumor mass was observed to slowly increase, the diffusion histograms narrowed and returned to the mean, pretreatment level (see Days 16 and 18). This is interpreted to indicate that the damaged cells were undergoing reabsorption and replacement by new tumor cells. H&E-stained section (upper right) of the tumor taken from this animal (Rat no. 1) at 18 days posttreatment confirmed the presence of minimal necrosis, consistent with the Day 18 histogram (e.g., repopulation of the tumor mass had occurred).

Temporal analysis of luciferase expression within the 9L tumor following administration of CD/Luc adenovirus using BLI. The top series of images are shown from a representative rat (Rat no. 1; see Figure 5) over time. In these images, a pseudocolor image of the luciferasegenerated photon emission is superimposed over the greyscale image of the rat head. Arrows point to the time at which these images were taken during the 5FC treatment period. The plot represents the normalized mean (± s.e.m.) photon counts obtained from the three 5FC-treated animals (diamonds) (Rat nos. 1, 2, and 3; Figures 5, 6, and 7) and three control animals (circles) studied with BLI over time.
Shown in Figures 6 and 7 are similar data sets corresponding to Rat no. 2 and Rat no. 3, respectively. Data obtained from Rat no. 2 revealed similar changes in diffusion MRI changes, as was observed from Rat no. 1. However, it is interesting to note that the diffusion histogram did not completely revert to that observed for the pretreatment tumor (Day 0), indicating the presence of increased extracellular space/necrosis within the tumor mass. This was confirmed by histology acquired from tumor tissue obtained at necropsy on Day 14 (Figure 6, upper right). The results obtained from Rat no. 3 are shown in Figure 7 whereby the administration of 5FC resulted in a significant increase in diffusion values within the tumor. The final histogram (Day 8 post-treatment initiation) revealed a significant portion of the tumor mass retained very high diffusion values, indicating that large areas of necrosis were likely present. This was confirmed by histology and is shown in Figure 7 (upper right).
Comparison of ADC histograms in treated (yCD + 5FC) and control (yCD + PBS) animals demonstrated that the increased diffusion observed in yCD/5FC-treated tumors is treatment associated and not due to nonspecific response that could arise from viral reactivity within the host tissue. Mean tumor diffusion in the control animals did not change during the observed exponential growth of the untreated tumors (Figure 3).
BLI was accomplished on Rat nos. 1, 2, and 3 at the same time intervals whose MRI scans were acquired in an effort to understand the kinetics of in vivo yCD expression within the intracerebral tumor. Shown in Figure 8 are a series of images from Rat no. 1 that were acquired using the BLI system over time. The image obtained at Day 0 post-5FC treatment was acquired 24 hr following the second of the two intratumoral viral yCD injections. A pseudocolor image of the luciferasegenerated photon emission is superimposed over the greyscale image of the rat head. Arrows indicate that the time images were acquired during 5FC treatment. The plot in Figure 8 represents the normalized mean ± s.e.m. photon counts obtained from the three treated animals (diamonds) (from Figures 5, 6, and 7) and control animals (circles) studied with BLI over time. These data reveal that expression of luciferase appears to rapidly diminish and is approximately 20% of maximal at Days 4–5 posttreatment with 5FC. Although specific quantitative correlation of luciferase activity with yCD expression levels was outside the scope of these studies, these data, along with immunohistochemical data discussed below, suggest that the 5FU cytotoxic-producing yCD factory cells are rapidly lost within the first week of treatment. Comparison of BLI data from the treated group with the untreated group indicates that yCD/luciferase expression lasts longer in the untreated group. The control group of animals could not be studied for the same length of time as the treated group due to the rapid growth of the untreated tumor.

Summary of individual data sets (columns) obtained from (left column) Rat no. 1, (middle column) Rat no. 2, and (right column) Rat no. 3 corresponding to Figures 5, 6, and 7, respectively. Plots shown represent the temporal changes in MRI-derived 9L tumor volume (top), mean ADC values (middle), and BLI-derived photon counts (bottom) for each animal.
To determine if changes in tumor water mobility preceded alterations in tumor growth, whole tumor mean ADC values were compared to tumor volumes determined from the T2-weighted images. Figure 9 displays the individual time course data sets of tumor volume, mean ADC values, and BLI-derived photon counts for each of the three treated animals. Note that 5FC administration produced a significant reduction in tumor growth in all animals beginning at 2 days post-treatment initiation (Figure 9, top row). Analysis of PBS- and 5FC-treated tumor doubling times indicated a significant slowing of tumor growth rates from 58.0 ± 1.4 to 108.3 ± 5.1 hr (s.e.m.), respectively. This finding was coincident with significant increases in tumor diffusion (Figure 9, middle column) for each of these animals. In fact, significant increases in mean diffusion values for each of the tumors were observed early (2–4 days) following initiation of 5FC administration. Finally, luciferase activity rapidly diminished in the animals to within 20% of maximal levels within about 5 days post-5FC treatment. Untreated animals progressed and succumbed to tumor burden so rapidly that comparable luciferase data for these animals could not be obtained over this same time frame.
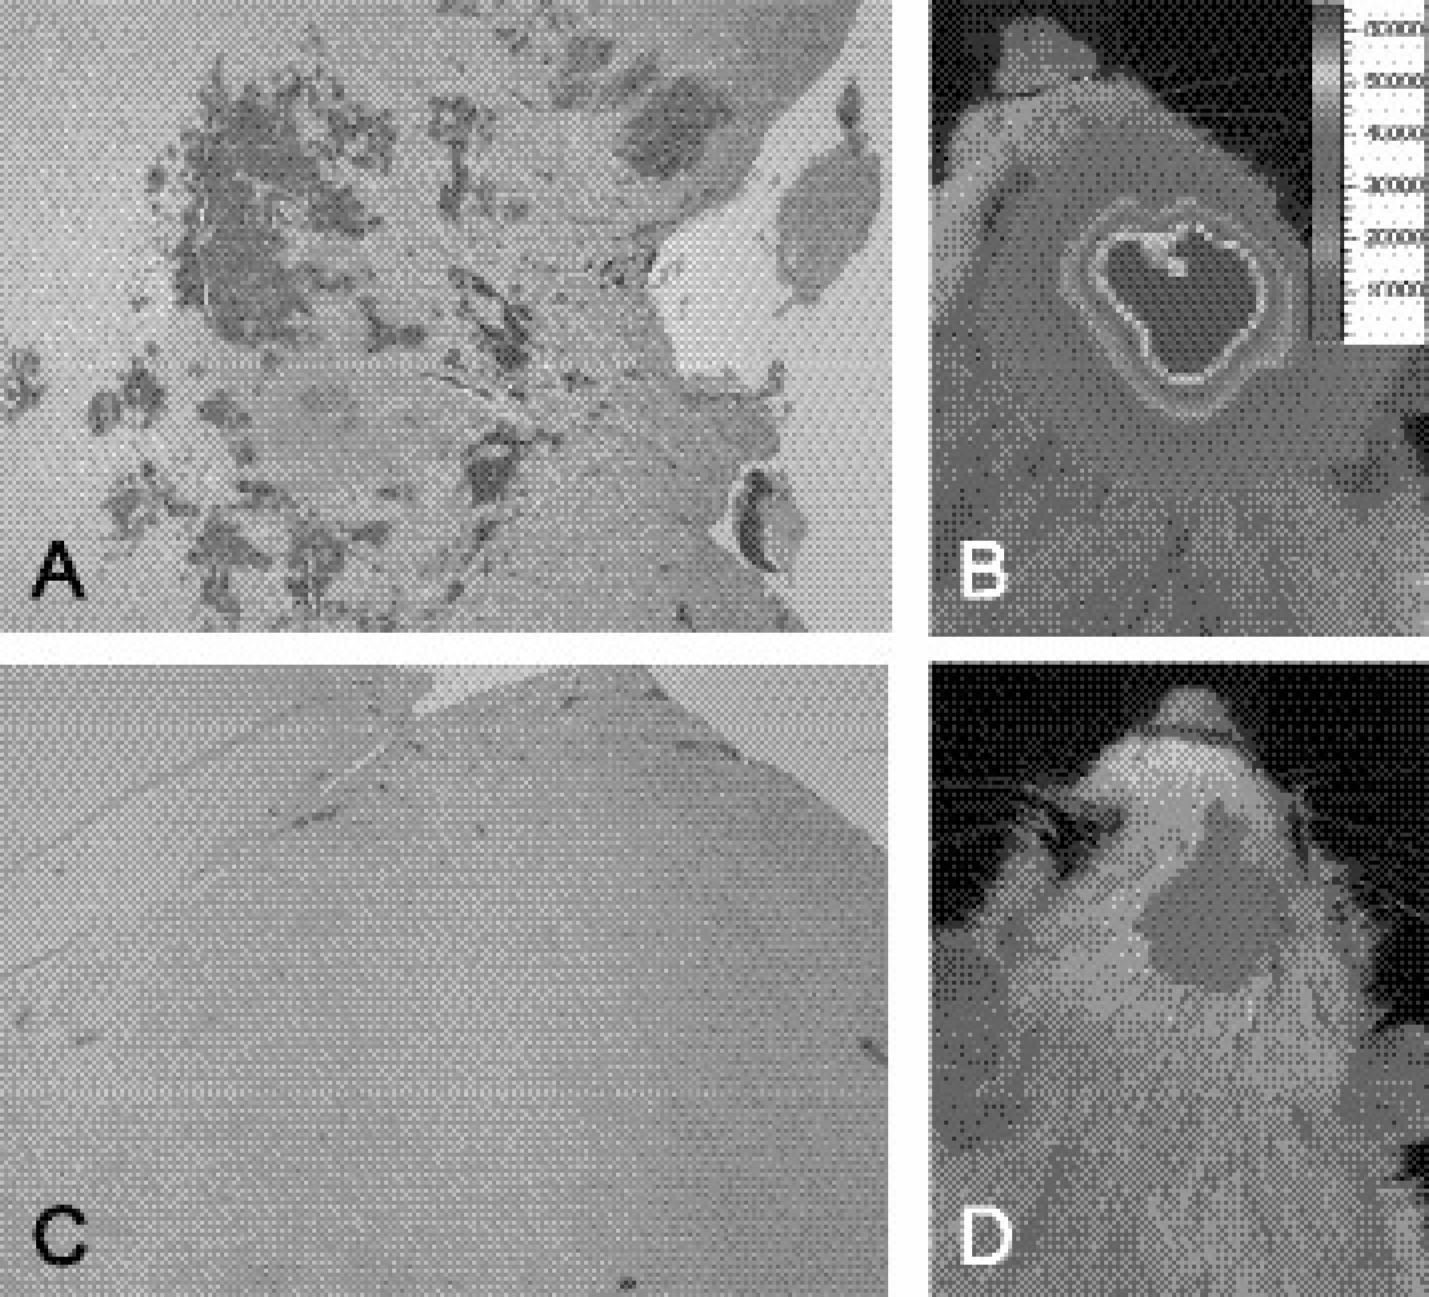
(A) Representative yCD immunohistochemicalstained section of a 9L tumor, which was treated with yCD adenovirus, revealing significant, heterogeneous expression of yCD within the tumor tissue. (B) Corresponding image of luciferase activity acquired using the BLI system that revealed significant photon emission, indicating a high level of luciferase activity due to yCD/Luc adenoviral injection/expression. (C) yCD immunohistochemical-stained section of Rat no. 1 (see Figure 5) at Day 18 posttreatment with 5FC. Note the diminished expression of yCD, which also corresponded to limited detection of luciferase expression by BLI on Day 18 as shown in Panel (D).
Direct intratumoral injection of the adenoviral vector was anticipated to yield a heterogeneous distribution of yCD-positive 9L tumor cells within the tumor mass. Assessment of the spatial distribution of yCD-expressing glioma cells was accomplished using immunohistochemical staining of 9L rat brain sections. Shown in Figure 10A is a representative section of a rat brain tumor prepared 1 day following the second injection of adenovirus as described above. Expression of yCD can be easily observed (brown-colored cells) within the tumor tissue and was found to be unevenly distributed throughout the tumor mass. BLI was also accomplished for this animal prior to sacrifice and is shown in Figure 10B. This image reveals the presence of a high level of luciferase activity within the same tumor showing high levels of yCD expression. In contrast, the bioluminescence image acquired from Rat no. 1 at Day 18 postinitiation of 5FC treatment revealed very low levels of luciferase activity. This correlated well with the near absence of yCD immunohistochemistry from the tumor tissue (Figure 10C) obtained from Rat no. 1.
Discussion
Cancer gene therapy is an area of active research that relies on the successful transfer of a therapeutic transgene into a tumor mass in vivo. Results presented here, as well as in our previously published results [29], demonstrate that yCD gene therapy is an effective means to improve brain tumor animal survival. Current approaches used in preclinical evaluation of this and other gene therapy strategies have traditionally relied upon animal survival and immunohistochemical analysis of excised tissue samples to evaluate the efficiency of gene delivery. The use of noninvasive imaging as a surrogate marker for assessment of the temporal dynamics of transgene expression along with therapeutic efficacy should facilitate preclinical and clinical studies.
Significant increases in tumor water diffusion values occurred early following the start of 5FC administration. The increase in diffusion occurred early and continued to increase until 8–10 days post-5FC treatment initiation, indicating that cell kill was, in fact, continuing to occur over this time frame. From histology of treated tumors, elevated ADC was found to be associated with active destruction of tumor tissue. Moreover, intraanimal differences in tumor diffusion changes correlated with histological analysis of tumor tissue, revealing that diffusion MRI may provide important information useful for individualization of tumor treatment. In fact, the translatability of diffusion MRI for monitoring the treatment of brain tumors with chemotherapy and radiation treatment has recently been reported in patients [31].
The use of imaging for monitoring gene expression in rodent tumor models using imaging technologies such as MR, optical, SPECT, and PET has been the subject of recent reports [32–39]. While in the present study, we chose to use BLI for preclinical imaging studies [11],[12], translation of this viral gene therapy to the clinic could be accomplished using radiotracer approaches. This practical utility of imaging could provide for defining the spatial location of the expression within the tumor mass, the amount and the persistence of expression levels over time. Using multimodality imaging techniques such as MRI and radionuclide technologies will provide a more complete understanding and additional insights related to why patients respond differently to the identical treatment. Thus, non-invasive imaging of both anatomy, combined with improved imaging of function (biochemistry, physiology, and cellularity) and molecular events, should yield significant improvement and individualization of patient care.
Data presented in Figures 3 and 4 validate the concept that early changes in diffusion values (or lack thereof) of an individual rat can be of predictive value. A significant increase in the average diffusion constant (ADC, Figure 4) within the tumor tissue of an individual animal, for example, correlated with increased survival compared to an untreated rat (Rat A, Figure 3). In contrast, when the ADC values within the tumor tissue of an individual rat did not show an early change (Figure 4) despite the application of gene therapy, an increase in tumor volume over time was observed, which resulted in early death. The use of diffusion weighted MRI as an early predictor of therapeutic efficacy has an additional advantage in that because of the inherent high resolution of the technique, heterogeneity in the diffusion values within the tumor may be used to delineate regions that have responded from regions that have not. In the case of gene therapy, this may provide an approximation of the region within the tumor that have been successfully transduced with the therapeutic gene. This information would then be beneficial for planning subsequent rounds of therapy. In addition, the use of radionuclide imaging techniques such as microPET [32] along with diffusion-weighted MRI [31] would provide the opportunity to generate coregistered data sets [40] that would allow for investigating the hypothesis that transgene expression is colocalized with subsequent regions of therapeutic response.
The use of BLI to monitor the efficacy of gene delivery and expression of the yCD transgene over time provides information that can be used to plan the prodrug dosage schedule. In this present study, over 90% of the bioluminescence activity was lost within the first five days of treatment (Figure 8). Corresponding to the decrease in detected photon counts was a decrease in yCD expression as determined by immunohistochemistry. This information can be used to define the time at which 5FC administration can be terminated (i.e., approximately at Day 5). This is an important factor since conversion of 5FC to 5FU by the gut flora over a certain period can result in gastrointestinal toxicity. Additional information obtained from the increase in tumor diffusion values revealed that tumor cell kill continued until Days 8–10. This raises the possibility that there is a several-day lag period between 5FU exposure and subsequent cell death and/or that relatively low levels of yCD gene expression are still potent enough to generate cytotoxicity. Finally, the combined use of MRI and BLI could also facilitate optimization of the timing and dosage of 5FC in future studies.
Currently, there are many available imaging technologies and reporter genes for investigating gene expression and molecular events in living tissue. The field of molecular imaging is rapidly developing into a vitally important area of research in biology and medicine. It is anticipated that in the near future, molecular imaging will provide specific and complementary information, which, when combined with anatomical imaging, will enhance the clinical management of a variety of patient diseases.
Footnotes
Acknowledgments
This work was supported in part by the following research grants from the NIH/NCI: PO1CA85878, P20CA86442, R29CA73904, and R24CA83099. We acknowledge Dr. Martin Philbert for his help with the preparation of histological tissue sections.