
Abstract
Cancer gene therapy based on tissue-restricted expression of cytotoxic gene should achieve superior therapeutic index over an unrestricted method. This study compared the therapeutic effects of a highly augmented, prostate-specific gene expression method to a strong constitutive promoter-driven approach. Molecular imaging was coupled to gene therapy to ascertain real-time therapeutic activity. The imaging reporter gene (luciferase) and the cytotoxic gene (herpes simplex thymidine kinase) were delivered by adenoviral vectors injected directly into human prostate tumors grafted in SCID mice. Serial bioluminescence imaging, positron emission tomography, and computed tomography revealed restriction of gene expression to the tumors when prostate-specific vector was employed. In contrast, administration of constitutive active vector resulted in strong signals in the liver. Liver serology, tissue histology, and frail condition of animals confirmed liver toxicity suffered by the constitutive active cohorts, whereas the prostate-targeted group was unaffected. The extent of tumor killing was analyzed by apoptotic staining and human prostate marker (prostate-specific antigen). Overall, the augmented prostate-specific expression system was superior to the constitutive approach in safeguarding against systemic toxicity, while achieving effective tumor killing. Integrating noninvasive imaging into cytotoxic gene therapy will provide a useful strategy to monitor gene expression and therapeutic efficacy in future clinical protocols.
Keywords
Introduction
Prostate cancer remains the second leading cause of cancer-related mortality in men in the United States. Recurrent and disseminated disease contributes to the majority of the estimated 29,089 deaths in 2004. No effective treatment currently exists for the advanced stage of human prostate cancer [1]. Hence, limitations of current therapeutic options demand the development of more effective detection and treatment methods. Gene therapy is a promising treatment because a great variety of growth inhibitory strategies can be implemented [2–5]. When used in combination, it could also augment therapeutic effects of conventional prostate cancer treatment. In particular, cytotoxic therapy employing the herpes simplex virus type 1 thymidine kinase (HSV1-tk) gene has been widely used in both experimental and clinical settings [6,7]. Despite promising therapeutic efficacy in preclinical models, the clinical benefit of this HSV1-tk suicide gene therapy is unrealized at this time. The lack of therapeutic success could be attributed to limited specificity, modest potency, inadequate gene delivery, and inability to monitor gene expression at the targeted site [8]. In this study, we aim to address these challenges to improve upon the current status of prostate cancer gene therapy.
The use of prostate-specific promoter to express therapeutic gene is likely to be advantageous over constitutive promoters in achieving cell-specific selectivity. In support of this concept, specific gene transfer and expression in distant prostate metastatic lesions was achieved by employing a modified prostate-specific antigen (PSA) gene promoter [9]. However, the weak activity of the native PSA promoter precludes efficient gene expression in prostate cancer therapeutic applications [10]. Several methods have been used to enhance the activity of the PSA promoter. By duplicating the upstream enhancer core of the PSA promoter, a 20-fold enhancement of activity over the parental construct was achieved [11,12]. In a second method, a two-step transcriptional amplification (TSTA) strategy was employed, which boosted the activity of the native PSA enhancer/promoter over 1000-fold, exceeding the activity level of the strong cytomegalovirus immediate early (CMV) promoter [13,14]. In the two-tiered TSTA system (Figure 1A), the PSA regulatory region was employed to express the potent synthetic transcription activator, GAL4-VP2, which in turn activates the expression of a GAL4-responsive gene. The prostate cell specificity and androgen responsiveness activity of the PSA promoter were retained in the TSTA method [13–17].
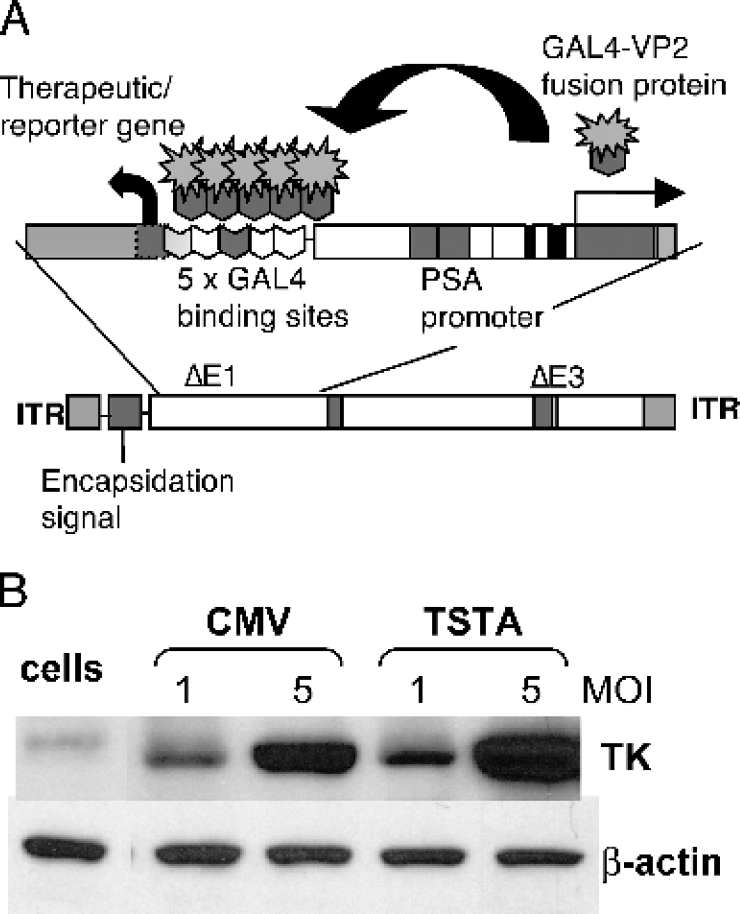
Prostate-specific suicide gene therapy vector. (A) The Ad containing the TSTA system. The enhanced PSE-BC promoter drives the expression of the potent synthetic activator, composed of two herpes VP16 activation domains (aa 413–454) fused to the GAL4 DNA-binding domain. The GAL4-VP2 activators bind to the GAL4 binding sites, activating the expression of a therapeutic gene. These two components were inserted into an Ad5 vector. (B) The magnitude of sr39tk expression by AdTSTA-sr39tk. LNCaP cells were infected with AdCMV-sr39tk or AdTSTA-sr39tk at MOI 1 and 5. The level of sr39tk protein expression was assessed by Western blot using a polyclonal HSV1-tk antibody [15] as well as β-actin as a control.
Coupling molecular imaging approaches to gene therapy will allow real-time monitoring of in vivo gene delivery and expression [18]. Optical bioluminescent imaging based on the firefly luciferase gene has frequently been utilized to study gene expression in living animals [19–18,20,21]. Light is produced through the enzymatic interaction of luciferase with its substrate
The unique enzymatic activity of HSV1-tk enables it to function both as a PET reporter gene as well as a cytotoxic suicide gene [15,24–26]. Unlike its mammalian counterpart, this HSV enzyme can efficiently phosphorylate guanosine analogues such as ganciclovir (GCV). The phosphorylation of various radioactive derivatives such as 9-(4-[18F]-fluoro-3-hydroxymethylbutyl) guanine ([18F]FHBG), will lead to the trapping and accumulation of the radiolabeled tracer in cells expressing HSV1-tk, which in turn can be detected and located by the PET scanner. The cytotoxic effects of HSV1-tk require the subsequent phosphorylation of the otherwise nontoxic GCV monophosphate by cellular kinases. The triphosphate derivative causes chain termination during DNA replication and can lead to chromosomal aberrations and cell death [25]. The pharmacologic dosage of GCV in cytotoxic therapy is three to four orders higher than the PET tracer dose. The sr39tk variant also exhibited stronger cytotoxicity compared to the WT enzyme [15]. The dual imaging and cytotoxic capability of the sr39tk gene is very useful in gene therapy, allowing researchers to directly monitor location, temporal representation, and magnitude of the therapeutic gene expression in vivo by noninvasive imaging.
In this study, we report the use of the bioluminescent optical CCD and micro-PET imaging to assess the effectiveness of TSTA-mediated gene therapy. Micro-PET imaging was utilized to monitor sr39tk expression by measuring the uptake of [18F]FHBG in organs where the gene is expressed. More importantly, the tissue selectivity and high magnitude of the TSTA-mediated sr39tk suicide gene therapy resulted in diminished systemic side effects and effective antitumor activity in a human prostate cancer xenograft model.
Materials and Methods
Vector Design
The AdTSTA-sr39tk was constructed with the AdEasy system [27]. The head-to-head orientation of activator (BCVP2) and reporter (sr39tk) in the single plasmid was constructed by replacing FL with sr39tk in PBCVP2G5-L [13]. The BCVP2G5-sr39tk fragment generated by NotI and SalI from PBCVP2G5-sr39tk was then ligated to pShuttle to generate pShuttleTSTA-sr39tk, which was used for the recombination with pAdEasy-1. The virus was propagated in 293 cells, purified on a CsCl gradient, and titrated by plaque assays on 293 cell monolayers.
Expression Analysis in vitro
Human prostate cancer cell line LNCaP was infected with AdCMV-sr39tk or AdTSTA-sr39tk at the multiplicity of one or five virus per cell. Cells were harvested 2 days after infection and lysed with RIPA buffer (0.1% Na deoxycholate, 0.1% SDS, 0.15M NaCl, 1mM EDTA, 10 mM Tris-HCl [pH 7.4] with protease inhibitor cocktail; Calbiochem, San Diego, CA). Equal amounts of total protein from each sample were subjected to SDS-PAGE. Following the transfer of analyzed proteins to PVDF membrane (Millipore, Bedford, MA), Western analysis was performed using polyclonal anti-HSV-tk antibody [15] and monoclonal anti-β-actin antibody [28]. Visualization was performed by BM Chemiluminescence (Roche Diagnostics, Indianapolis, IN) with HRP-conjugated respective antibodies.
Optical Imaging of Mice
Animal experiments were performed in accordance with the University of California Animal Research Committee guidelines. Ten to 12-week-old male SCID (Taconic Farms, Germantown, NY) mice were subcutaneously implanted with 0.2 cm tumor coated with matrigel. When tumors reached ~0.8 cm, the specified Ad was injected into the tumor for four consecutive days, using a 28G1/2 syringe (10 µL per site, at three different sites, and waiting 5 min between injections). Optical imaging was performed with an IVIS CCD camera (Xenogen, Alameda, CA). Mice were anesthetized with ketamine and xylazine (4:1), then given 200 µL of 15 mg/mL
Micro-PET/CT Imaging and GCV Treatment
For the therapeutic study, the specified sr39tk Ad was administered intratumorally at 1 × 10⁹ pfu/day × 4 days (30 µL/day). On Days 8 and 22, animals were injected with 200 µCi [18F]FHBG via the tail vein. Following an hour of substrate uptake, the entire animal was scanned for 20 min in a Focus micro-PET scanner (Concorde Microsystems, Knoxsville, TN) and transferred to a micro-CT scanner (MicroCAT I, Imtek, Knoxsville, TN), and imaged for 15 min at 50 keV, 325 µA, and 196 total angles of rotation in two bed positions. From Days 9 to 16, animals received intraperitoneal administration of GCV (80 mg/kg in 0.9 % saline) or saline vehicle. PET signals were quantified as the percentage of injected dose per gram (%ID/g) tissue. This %ID/g is a measure of the amount of tracer accumulated in a given area normalized to the injected amount and to the mass of the tissue examined. PET images were superimposed on CT images. All PET/CT data analyses and 3-D images were compiled using AMIDE. A total of six animals were used in each of four treatment groups. PET imaging was performed on four out of six animals in each group.
Quantitative PCR
Organs were frozen in liquid nitrogen, ground into fine powder, resuspended in 10 volumes lysis buffer (10 mM Tris-HCl pH 8.0, 5 mM EDTA pH 8.0, 200 mM NaCl, 0.2 % SDS, 100 µg/mL proteinase K), and incubated at 55°C for 3 hr. One milliliter of each lysate was treated with RNase A (50 µg/mL) for 20 min at 37°C, followed by extracting twice with phenol/chloroform/isoamyl alcohol (25:24:1). The DNA was precipitated and resuspended in TE buffer (pH 8.0). Real-time PCR was performed using the Opticon 2 Monitor (MJ Research, San Francisco, CA). The specific primers for β-actin and HSV-tk are: (β-actin: forward, 5′-TCA AGA TCA TTG CTC CTC CTG AGC-3′, reverse, 5′-TAC TCC TGC TTG CTG ATC CAC ATC-3′; HSV-TK: forward, 5′-ACA AAA AGC CAC GGA AGT CC-3′, reverse, 5′-AGT TGC GTG GTG GTG GTT T-3′). Primers for β-actin recognize an identical conserved region of the human and mouse gene. Reactions were run in triplicate, each containing 1× SYBR Green master mix (Applied Biosystems, Foster City, CA), 0.4 pmol/µL of primers and 100 ng genomic DNA in 25 µL. The amplification conditions were: 1 cycle of 2 min at 50°C and 1 cycle of 10 min at 95°C, followed by 35 cycles of 15 sec at 95°C, 30 sec at 60°C, and 30 sec at 72°C. After completion of PCR, 10 µL of the pooled triplicated reactions was run on a 2% agarose gel, resolving the 106 bp β-actin and 101 bp HSV-tk amplified fragment.
Immunohistochemical Analysis
Tumors harvested at Day 22 were fixed in 10% formalin overnight. Paraffin-embedded sections (4 µm) were deparaffinized, and stained with hematoxylin and eosin. Proliferating cells were visualized using mouse monoclonal Ki67 antibody 1:50 (Novocastra, Norwell, MA) at 4°C overnight. Color visualization of immunohistological reaction was performed with multilink antibody, streptavidin peroxidase (BioGenex, San Ramon, CA), and 3,3 diaminobenzidine (DAB) as previously described [12]. Apoptotic cells were visualized by using DeadEnd Colorimetric TUNEL System (Promega, Madison, WI), performed according to manufacturer's instructions. Samples were blinded and staining was quantified by dividing each tumor into four quadrants. Cells were then counted under ×40 magnification. Staining was recorded as a percentage of positive cells over total cells counted (average of 100 cells/field).
Liver Enzyme and PSA Assays
Blood was collected at various time points by the retro-orbital eye bleed method. Serum ALT levels were measured using GTP/ALT reagent strip with SPOTCHEM EZ system (HESKA, Fort Collins, CO). Serum PSA levels were measured in duplicates using PSA ELISA kit (American Qualex, San Clemente, CA). The relative rate of change in PSA was obtained by calculating the difference in PSA levels pre- and posttreatment divided by posttreatment.
Statistical Analysis
Statistical analyses were performed using the two-tailed Student's t test. For all analyses, p < .05 was considered statistically significant.
Results
Prostate-specific Gene Delivery Vector
Using the prostate-specific two-step TSTA method should be advantageous, as this method has been shown to boost the activity of a comparable one-step prostate-specific promoter by 50-fold [12,13,16]. In this study, the TSTA system was incorporated into an adenoviral vector to drive the sr39tk gene, which is designated as AdTSTA-sr39tk (Figure 1). The magnitude of sr39tk protein expression mediated by this prostate-targeted Ad was comparable to the AdCMV-sr39tk, as analyzed in LNCaP (Figure 1B) and LAPC-4 (data not shown) human prostate cancer lines. Furthermore, AdTSTA-sr39tk mediated gene expression was regulated by androgen and active in advanced AR+ androgen-independent prostate cancer cell lines and tumors [28]. The promising properties AdTSTA-sr39tk exhibited in cell culture studies lend support to assess its activities in preclinical prostate tumor models.
Imaging Transgene Expression in Prostate Tumors
To learn more about the in vivo activity of the gene therapy vectors, we applied several molecular imaging modalities, including bioluminescent imaging and micro-PET, to monitor transgene expression during treatment. The study design, as outlined in Figure 2A, was to compare the performance of the CMV versus the TSTA vectors. In the CMV group (i) of the first study, 4 × 10⁸ infectious plaque forming units (pfu) each of the luciferase-expressing virus (AdCMV-FL) and the sr39tk-expressing virus (AdCMV-sr39tk) were coinjected into the tumor. The same viral dosage was used in the TSTA group (ii). Given that in both groups the luciferase and sr39tk are expressed from the same promoter and inserted into the same adenoviral backbone, the luciferase gene can serve as a reporter gene to reflect the expression of the sr39tk therapeutic gene. An advantage of this approach over a single vector expressing both imaging genes simultaneously is that the distribution and the gene expression profile can be verified by two independent vectors and imaging modalities. The LAPC-4 tumor was the model we examined. It is a PSA-expressing human prostate xenograft originally derived from a patient's lymph node metastases [29].

Optical and PET imaging of vector mediated gene expression. (A) Therapeutic study scheme. Coinjection of the two vectors in groups i and ii in one study enables the optical FL signal to reflect the expression of sr39tk. Group iii and iv injections were performed in a second study to compare the therapeutic activity between the TSTA and the CMV vector. (B) Coinjection of the two adenoviral vectors (Ad) into LAPC-4 tumors. 4 × 10⁸ pfu of each vector was injected and optical CCD imaging and micro-PET were performed on Day 8. Tumor and liver signals were detected in the CMV group (i), but in the TSTA group (ii) signals were limited to the tumors. Signals in the abdomen were due to the hepatobiliary and renal route of FHBG excretion. Animals were sacrificed at Day 22 and bioluminescent imaging of the isolated organs revealed the tumor-restricted expression of the TSTA vector. (C) PCR amplification of the sr39tk gene in the tumor and the liver. DNA was isolated from organs of AdCMV-sr39tk and AdTSTA-sr39tk treated animals (groups iii and iv). Real-time quantitative PCR was performed to quantify the sr39tk gene. Agarose gel resolution after completion of the 35-cycle PCR reaction revealed the presence specific HSV1-sr39tk DNA (101-bp amplified fragment) in the tumor and liver extracts. β-actin served as internal control.
On Day 8, prominent optical signals were observed in the tumors of the CMV group (i). Strong signals emitted from the livers were consistently detected after intratumoral injection of CMV-driven vectors (Figure 2B, i). On the other hand, in the TSTA group (ii), the optical signal was confined to the tumor and the liver was devoid of signal (Figure 2B, ii). Similar to the optical analysis, micro-PET illustrated the same pattern of [18F]FHBG uptake mediated by the sr39tk gene in the corresponding locations (Figure 2B).
To understand why gene expression was observed consistently in the liver of the CMV group but not in the TSTA group, real-time quantitative PCR was employed to quantify the viral distribution following intratumoral injection. The sr39tk gene delivered to the tumor relative to endogenous β-actin gene was 0.072 and 1.18 in a CMV and TSTA animal, respectively. In a CMV-treated animal, the ratio of the sr39tk gene delivered to the tumor was 452-fold higher than that in the liver. Similarly, the ratio in a TSTA-injected animal was 263-fold higher in the tumor than in the liver. The correct size of the sr39tk fragment was detected from the tumor and liver extracts (Figure 2C). These PCR data indicate that tumor-directed vector administration does not preclude gene delivery to nontargeted vital organs such as the liver. Our results would support the assumption that a tissue-specific vector provides added safety over a constitutively active vector. Imaging studies showed that the prostate-specific TSTA vector in the liver remained transcriptionally silent.
Treatment Side Effect Seen by Imaging
To compare the therapeutic activity between the CMV- and the TSTA-driven vector, a total of 4 × 10⁹ pfu of the respective vector was injected into the LAPC-4 tumor (group iii and iv, Figure 2A). The animals were imaged by combined PET/CT on Day 8, just prior to GCV treatment (80 mg/kg for 7 days). The control groups received saline instead of GCV. All animals were reimaged on Day 22, one week after the last day of GCV administration. At this point, no residual GCV should remain in the animal to interfere with uptake of PET substrate [18F]FHBG. In the therapeutic studies, micro-CT was performed in series with the micro-PET. This combined technology enables the precise alignment of the PET signal with the anatomical location in the subject [30].
In the AdCMV-sr39tk injected group, a strong [18F]FHBG PET signal was observed in the liver on Day 8 (Figure 3A). The [18F]FHBG retention signal was not affected by saline treatment (2.5 ± 0.4 to 2.7 ± 0.06), but was decreased in the GCV-treated group from 3.7 ± 1.1 to 1.5 ± 0.3. The prominent [18F]FHBG PET signal in the liver forecasted liver toxicity in this group. This is because the same sr39tk activity that phosphorylates [18F]FHBG also functions in the first step of cytotoxic activation of GCV. After GCV treatment, a clear decrease of sr39tk-mediated PET signal in the liver was observed (Figure 3A, graph). The decrease in the functional PET signal could be attributed to the elimination of sr39tk expressing cell with GCV. No loss of PET signal was observed with saline treatment (Figure 3A, graph).
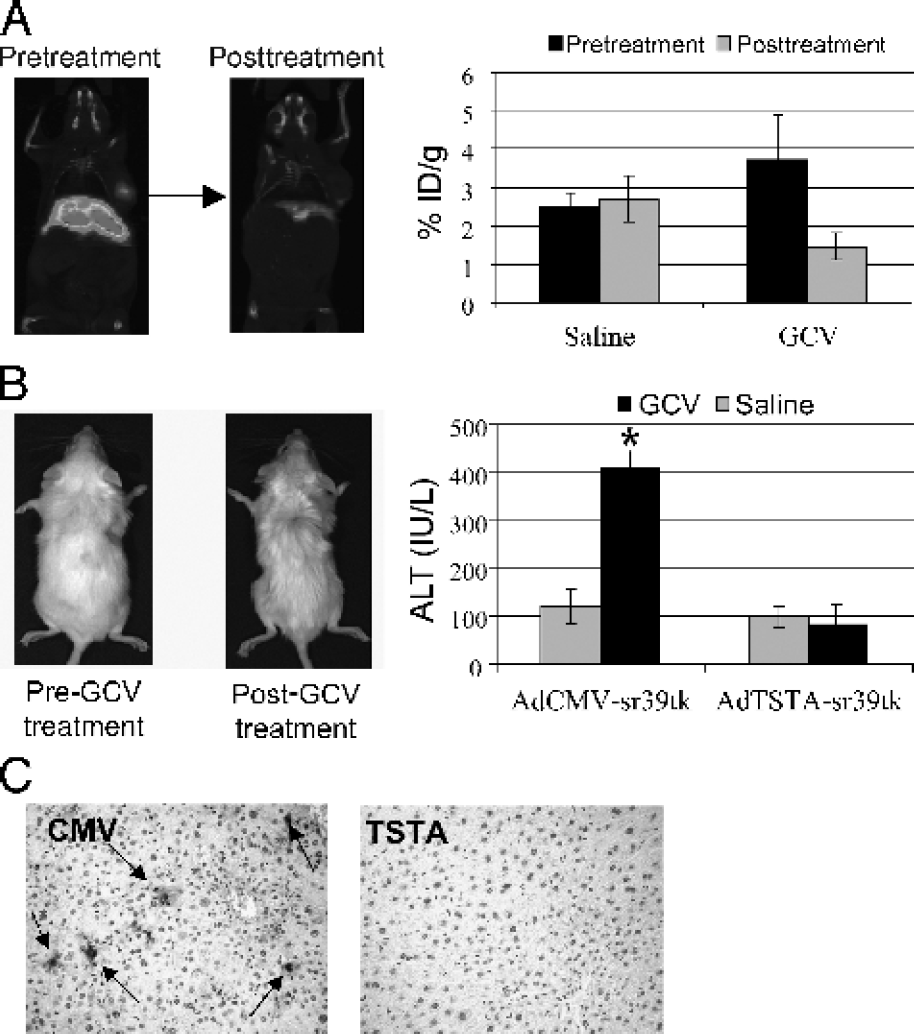
Liver toxicity after GCV treatment in AdCMV-sr39tk animals. (A) Micro-PET/micro-CT of AdCMV-sr39tk treated animals. Compared to the saline treatment, GCV treatment (n = 6 per treatment group) resulted in a reduction of PET signal in the liver (PET, n = 4 per group). The graph on the right shows average [18F]FHBG retention in the liver pre- and posttreatment. (B) Liver toxicity in the animals. GCV-treated mice in the CMV group were weak and disheveled. GCV treatment resulted in elevated serum ALT levels in the CMV group compared to TSTA and saline groups on Day 22. (C) Immunohistochemical analysis of the liver. Liver sections from these mice revealed significant TUNEL positive staining (arrows) indicative of apoptosis. This was not observed in the TSTA cohort.
The extent of liver damage in the animals was assessed by several means including signs and symptoms of the animals, hepatic serology, and histology. Alanine aminotransferase (ALT) is an intracellular enzyme produced by hepatocytes that are released into the bloodstream as a result of liver cell destruction. The GCV-treated animals in the CMV group exhibited more than four times higher ALT than the saline control or TSTA groups (Figure 3B), and they appeared weak and unkempt. At the end point of the study, the average liver weight of the CMV group was 50% of the saline and TSTA-treated groups. Immunohistochemistry of the liver sections by terminal deoxynucleotidyl transferase (TdT)-mediated dUTP nick end labeling (TUNEL) revealed extensive apoptosis in the CMV GCV-treated animals (Figure 3B).
Monitoring Therapeutic Efficacy of Suicide Gene Therapy
The previous results (Figure 3) suggested that the destruction of sr39tk-expressing cells resulted in the diminution of sr39tk-mediated PET signals. Thus, we applied the radionuclide micro-PET/micro-CT to monitor the therapeutic effects of tumor cell destruction. In the AdTSTA-sr39tk-treated animals, PET signal in the tumor was significantly weakened on Day 22 compared with Day 8 (Figure 4A). Results of the entire TSTA treatment cohort showed that [18F]FHBG accumulation in the tumors was 0.52 ± 0.04 %ID/g (n = 12) prior to GCV treatment on Day 8, 0.54 ± 0.09 %ID/g in the saline-treated group, and 0.33 ± 0.04 %ID/g in the GCV-treated group (n = 5) on Day 22. The GCV treatment resulted in a significant reduction of signals in the tumor (p = .026). Although adenoviral-mediated gene expression is expected to decay over time, we observed a higher magnitude of decrease (50%) in [18F]FHBG retention in the GCV-treated group compared to a 20% decrease in saline-treated group from pre- to posttreatment (Figure 4A). In the CMV treatment group, a decrease in PET signals was observed in the animal's tumor as well as in the liver following GCV treatment (Figure 3A).

Therapeutic effects of GCV treatment on the tumors. (A) PET signal in AdTSTA-sr39tk injected mice. The close-up coronal and transverse images represent a PET/CT study performed on an animal 8 days after intratumoral injection of AdTSTA-sr39tk. The lower paired images are the PET/CT results of a representative animal pre- and posttreatment with GCV. The tumor localized PET signals declined post-GCV treatment. The graph on the right shows the relative change of PET signal in the tumors of the two cohorts. The difference in the signal decay between the saline and GCV groups was significant (p= .029). (B) Serial PSA levels. GCV treatment in the CMV and TSTA groups resulted in a significant decrease in the serum PSA level compared with saline controls (p= .02). Relative change of PSA showed that the rate of the rising level was halted by GCV treatment. (C) Detailed tumor histology. Two representative tumors were shown for each condition under unmagnified objective. Consecutive thin sections were stained with hematoxylin and eosin (H & E), anti-Ki67 antibody (cell proliferation marker), and TUNEL. Comparing the lower panels of GCV-treated tumors to the upper saline controls; drug treatment resulted in decreased nucleated cells (blue staining on H&E), reduced proliferating cells (Ki-67), and elevated apoptosis (TUNEL). Higher magnification of the sections (×200) demonstrates specificity of the staining.
To validate the therapeutic outcome, PSA levels were examined during the course of treatment. Serum PSA, a widely used marker for the detection of prostate cancer, was applied to measure tumor load during suicide gene therapy. In this tumor model, serum PSA measurements have been shown to accurately reflect tumor volume and growth in several studies [29,31–33]. Serum PSA was sampled prior to treatment (baseline), and on Days 11 and 19 (i.e., 3 and 11 days post-GCV treatment). In the CMV group, the average baseline PSA was 21 ng/mL and increased to 26 ng/mL after GCV treatment, whereas the saline-treated group climbed to 72 ng/mL (p = .019). A similar trend was observed in the AdTSTA-sr39tk injected group. The average PSA in this cohort was 12 ng/mL at baseline and 13 ng/mL after GCV treatment compared with 46 ng/mL in saline controls (p = .018). The relative change of PSA was determined for each group (Figure 4B). The two saline-treated control groups showed continual tumor growth as is evident by the increasing PSA level, whereas tumor growth in the GCV-treated groups was halted.
Detailed histological examinations with hematoxylin and eosin (H&E) staining, proliferative marker Ki-67, and the apoptotic TUNEL staining were performed. Figure 4C shows representative tumor sections of eight different animals from the specified treatment groups. The hematoxylin dye (purple/blue) stains DNA content. Thus, the extent of purple/blue coloring in a tissue section is indicative of the extent of living cells. The overall hematoxylin staining in the unmagnified tumor sections of both saline groups was more extensive than the GCV-treated groups (Figure 4C). Moreover, the areas of proliferation that stained positive by Ki-67 were decreased in the GCV-treated tumors compared with saline controls. In contrast, the areas that did not stain for Ki-67 exhibited strong TUNEL staining. The apoptotic TUNEL staining also supports the PSA measurement that tumor growth was halted in the GCV-treated group. Quantitation of the tumor TUNEL staining revealed that an average of 67.6% tumor cells were positive in the GCV-treated versus 7.6% in the saline-treated tumor of the TSTA group. Overall, the histological assessment demonstrated that the GCV-treated tumors exhibited increased apoptosis (TUNEL staining), reduced proliferation (Ki-67 staining), and decreased living cells (hematoxylin staining). These observations therefore support that GCV treatment coupled to the sr39tk gene therapy results in effective tumor cell destruction.
Discussion
Achieving both potent and cell-selective expression could improve the therapeutic outcome of cytotoxic gene therapy of cancer. Here, we showed that the adenovirus-based TSTA system can express the suicide gene in a robust, tissue-specific manner. The tissue selectivity of the TSTA method restricted the transgene expression to the LAPC-4 human prostate tumor, and thus, limited the transgene-mediated toxicity in a nontargeted organ such as the liver. The highly augmented activity of TSTA allowed the visualization of transgene expression by bioluminescent and PET imaging during treatment.
We postulated that functional gene expression activity in the tumor might provide more accurate, dynamic information on the content of living cells in a tumor than tumor size measurements. Due to its easy-to-use and rapid scan time capabilities, in vivo optical imaging has been applied frequently to interrogate tumor activities [13,14,16–22], including monitoring growth and therapy of marked tumors [22]. However, when we applied optical imaging to monitor the therapeutic effects of suicide gene therapy on renilla luciferase-labeled LAPC-4 tumors, changes in intratumoral signals were not correlated with treatment effects. Several factors could contribute to the difficulties we encountered. (i) Optical signal is known to be attenuated by hemoglobin levels, extent of tissue depth or necrotic tissue, and (ii) high, saturated signals in the xenograft tumors could make lost of signal during therapy difficult to detect. Thus, we decided to utilize PET imaging, which is a high-energy modality that is not attenuated by tissue depth, and it is applicable to human subjects. In fact, [18F]FHBG was determined to be a safe tracer in healthy human volunteers [34]. Our results support the use of PET/CT to monitor the pharmacokinetic of HSV-tk suicide gene therapy in vivo.
Despite substantial tumor destruction in the suicide gene treatment, the tumor cell annihilation was incomplete at the specified end point of this study (Day 22). Potentially, a more prolonged treatment course could achieve more extensive tumoricidal effects. To ensure accuracy of gene delivery, we intentionally employed large size tumors, ~0.8cm diameter at the start of therapy. Consequently, one limiting factor likely to have contributed is the incomplete gene transduction via intratumoral viral injection. Several measures were attempted to achieve more optimal intratumoral transduction. To circumvent the high intratumoral pressure, the viral solution was administrated at a slow rate, in a small volume, divided into multiple sites and over several days. Despite these measures, the transduction rate was between 30% and 50%, which was estimated by performing flow cytometry of single-cell suspension of tumors 4 days after injection of a viral vector expressing green fluorescent protein (data not shown). Several strategies can be applied to enhance therapeutic efficacy of suicide gene therapy. The high level and specific gene expression accomplished by the TSTA method is helpful to maximize in vivo gene transduction as well as to boost the bystander effect. This bystander phenomenon, where cytotoxic effect spreads from transduced cells to neighboring nontransduced cells, is known to be augmented by increasing intercellular transfer of metabolites through gap junctions [35,36]. By combining the HSV-tk cytotoxic approach with other gene-based therapeutic targets such as anti-angiogenic or immune activation strategies, synergistic enhancement of remedial effects could be accomplished. In the context of improving efficacy of cancer treatment, gene therapy should be considered as one arm of a multiprong approach to manage cancer. Thus, it is promising that adenoviral-mediated suicide gene therapy has been shown to induce radiation sensitizing effects in tumors [37].
Another interesting finding from this and other studies [8,16,38] is that intratumoral injections of viral vectors often result in “leakage” into the systemic circulation, triggering transgene expression in the liver. Ongoing research in our laboratory indicates that tumor models exhibit differential viral “leakage” [16], and this phenomenon is likely modulated by tumor vasculature. Hence, these findings further underscore the importance of incorporating a noninvasive mean to monitor the location of toxic transgene expression in vivo, thereby obtaining the assurance that the “on-target” and “off-target” effects can be visualized. One unanticipated finding is that higher PET signal was detected in the liver of the AdCMV-sr39tk injected animal despite a much higher level of sr39tk gene delivery to the tumor (Figure 3). The possible explanations could be: (i) preferential adenoviral transduction of hepatocytes or (ii) preferential gene expression mediated by the CMV promoter in the liver or (iii) limiting PET substrate delivery to the tumor relative to the liver. We are actively investigating these possibilities.
In an attempt to improve prostate cancer gene therapy, we have coupled noninvasive imaging to a highly amplified, prostate tissue-specific gene expression system to express an enhanced cytotoxic HSV1-tk gene (sr39tk). The results demonstrated here confirm that the adenoviral vector containing prostate-specific TSTA system can achieve targeted expression in vivo. In the delivery of the potent variant sr39tk gene, effective tumor eradication with minimal systemic toxic affects was achieved. The coupling of PET imaging to this targeted suicide gene therapy will be a promising strategy to develop future clinical protocols for patients with advanced stage prostate cancer.
Footnotes
Acknowledgments
Without the imaging technology infrastructure developed by Dr. Michael Phelps (Molecular and Medical Pharmacology, School of Medicine, UCLA) and the UCLA Crump Institute for Biological Imaging, this work could not be accomplished. We thank Waldemar Ladno, Judy Edwards, David Stout for their skillful assistance in PET/CT imaging, and Baohui Zhang for technical assistance. We deeply appreciate the guidance and shared equipment provided by Vivek Dixit (Department of Medicine, School of Medicine, UCLA) in the liver enzyme assay, and Giri Sulur for manuscript preparation. We thank Drs. Elizabeth Neufeld and Harvey Herschman for their helpful inputs. This work is supported by the California Cancer Research Program 3NI0226 (to LW), DAMD17-03-1-0095 (to LW), NIH R01 CA101904 (to LW), and an interdisciplinary seed grant from the JCCC (to MC, LW, and SSG). MS is supported by a DOD CDMRP postdoctoral fellowship (PC020531).