
Abstract
The use of anatomical imaging in clinical oncology practice traditionally relies on comparison of patient scans acquired before and following completion of therapeutic intervention. Therapeutic success is typically determined from inspection of gross anatomical images to assess changes in tumor size. Imaging could provide significant additional insight into therapeutic impact if a specific parameter or combination of parameters could be identified which reflect tissue changes at the cellular or physiologic level. This would provide an early indicator of treatment response/outcome in an individual patient before completion of therapy. Moreover, response of a tumor to therapeutic intervention may be heterogeneous. The use of imaging could assist in delineating therapeutic-induced spatial heterogeneity within a tumor mass by providing information related to specific regions that are resistant or responsive to treatment. Largely untapped potential resides in exploratory methods such as diffusion MRI, which is a non-volumetric intravoxel measure of tumor response based upon water molecular mobility. Alterations in water mobility reflect changes in tissue structure at the cellular level. While the clinical utility of diffusion MRI for oncologic practice is still under active investigation, this overview on the use of diffusion MRI for the evaluation of brain tumors will serve to introduce how this approach may be applied in the future for the management of patients with solid tumors.
Introduction
The clinical value of conventional MRI resides in its ability to noninvasively follow gross tumor morphology and how it evolves over time. Conventional MRI exploits a variety of endogenous tissue properties that allow the neuro-oncologist/neuro-radiologist to assess gross tumor extent on the resultant MRI contrasts, such as “T2-weighted” and “gadolinium-enhanced T1-weighted” images. Presently, a comparison of sequential MRI scans is the method of choice for monitoring the response of central nervous system (CNS) tumors to therapy, which documents the change in maximal diameter, cross-sectional area of the tumor via the product of the maximal perpendicular tumor diameters, or full volume determination [1]. Gadolinium-enhanced T1-weighted images are often used, but T2-weighted or other MR contrast strategies may be employed for this purpose. However, comparisons of tumor burden are usually made between pretreatment scans and those obtained weeks to months following the conclusion of a therapeutic protocol [2]. The typical radiologic assessment is somewhat interpretive and based on the spatial extent and location of anomalous contrast. The actual image contrast values are rarely quantified as these are usually arbitrarily scaled and do not have a simple relationship to tissue properties. It is thought that there is significant untapped potential for MRI techniques designed to provide additional functional, structural, or molecular information related to tumor biology and physiology. Such information may be derived from quantitation of tissue properties which reflect, for example, perfusion dynamics, oxygenation levels, biochemistry/metabolism, cellularity, and levels of gene expression. Since the spatial information is retained, regional heterogeneity in these tissue properties, and their change with therapy, is also measurable.
While tissue function, perfusion, oxygenation, and metabolism are actively being studied in relation to brain tumors, the specific interest in this overview is the application of MRI to provide information related to the microscopic cellular environment in solid tumors. The use of water diffusion as a surrogate marker to probe tissue cellularity is compelling since this parameter is strongly affected by molecular viscosity and membrane permeability between intra- and extracellular compartments, active transport and flow, and directionality of tissue/cellular structures that impede water mobility. Thus, diffusion MRI can be applied for a variety of tumor characterization purposes including distinguishing cystic regions from solid, highly cellular regions as well as detection of treatment response which is manifest as a change in cellularity within the tumor (Table 1).
Diffusion MRI: Application to Oncology

Methods of assessing treatment response that are not dependent on relatively slow changes in tumor volume may be capable of providing earlier indications of therapeutic outcome since molecular and cellular changes typically precede observable macroscopic changes in gross tumor size. Therefore, the use of a quantitative MRI surrogate marker scheme (i.e., water diffusion) to determine therapeutic-induced changes in the tumor cellular matrix as recently reported is an area of active research investigation.
Overview of the Diffusion Method
Many aspects of diffusion MRI sequences are technically elaborate. For this overview, however, we will not consider all technical details except to note that diffusion MRI sequences incorporate an additional pair of magnetic field gradient pulses to render an MR signal intensity that is dependent on the mobility of the signal source, namely, water molecules. In clinical applications, one is less interested in the physics of water mobility than its interpretation in relation to tissue structure. Thus, consider if the time interval between gradient pulses is sufficient to allow water molecules to migrate distances comparable to the size of and spacing between cells, then the apparent mobility will be reduced by the impediments of cellular membranes and tortuosity of the extracellular space (Figure 1). In addition, the directionality of cellular structures, such as in highly ordered white matter fiber tracts, can be probed by controlling the direction of the applied diffusion pulses. The study of diffusion directionality or “anisotropy” is itself a significant area of investigation. For the remainder of this review, however, we will avoid the issue anisotropic diffusion by simply stating that our diffusion measures are directionally independent via careful combination of data from several diffusion gradient directions [3,4].
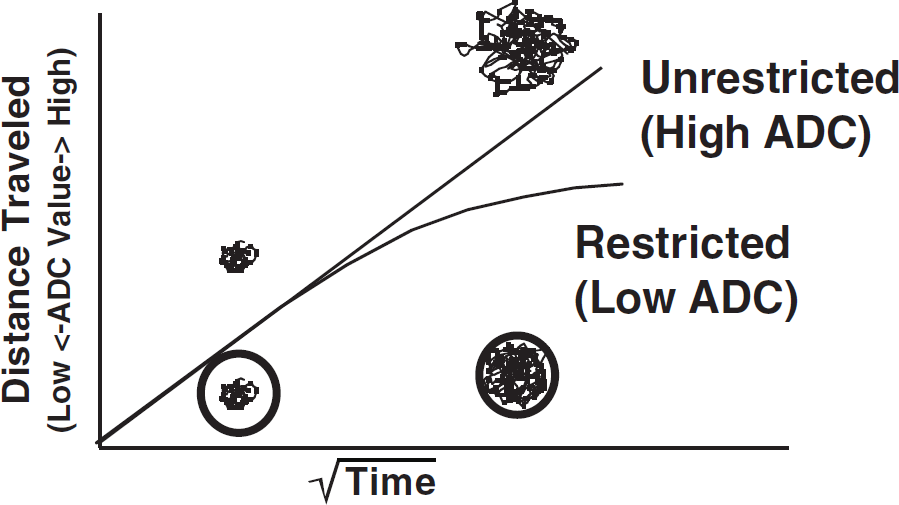
Effects of restricted (cellular) versus unrestricted (acellular) tissue environments on the diffusion of water molecules. This diagram shows that in an unrestricted environment, the movement of water molecules is higher per unit time than for regions of tissue with more restricted environments.
Often, inclinical practice, the raw “diffusion-weighted” image is utilized as a sensitive, albeit qualitative, diagnostic screen for acute ischemia in brain tissue [5–7]. The clinical interpretation is that regions of conspicuously bright signal on diffusion-weighted MR images suggest restricted diffusion in and among cells swollen by cytotoxic edema secondary to ischemic insult. Acquisition of images at multiple diffusion sensitivities, however, allows the calculation of an apparent diffusion coefficient (ADC) at each point in the image. The calculated ADC map also removes the influence of T2-relaxation, referred to as “T2-shine through,” which would otherwise lend to ambiguous contrast in the image. Water mobility is reduced in the restricted environment of cellular-dense tissues relative cellular-sparse tissues that exhibit high diffusion properties. While it is an oversimplification of the biophysics involved, we will consider the ADC value to be inversely related to the cellularity of brain tumors [3,8,9]. Please note that the relative tissue contrast on an ADC image shows high diffusion/mobility areas as bright in acellular/cystic tissues is actually reversed from the contrast of diffusion-weighted MRI (Figure 2). While this can be a source of confusion, the key feature of the ADC representation is that it is quantitative. As such, ADC may be used for the diagnostic assessment of tumors, for comparison across individuals, or serially within an individual undergoing treatment.

Comparison of image information between conventional T2-weighted MRI, diffusion-weighted MRI, and a quantitative ADC image all from the same patient.
The central hypothesis in utilization of diffusion to assess the impact of therapy is that successful treatment of a tumor with cytotoxic agents results in significant damage and/or killing of cells, thus altering cell membrane integrity and the degree of cellularity. This has a net effect of increasing the fractional volume of the interstitial space due to cell loss resulting in an increase in the mobility (diffusion) of water within the damaged tumor tissue (Figure 3). The sensitivity of diffusion MRI for detection of therapeutic-induced changes depends upon the possible overall dynamic range, which can be observed by ADC measurements. For example, relatively solid tissue such as normal adult brain has an ADC value of 0.6-0.8 × 10⁻³ mm2/sec while CSF is about 3.0 × 10⁻³ mm2/sec (Figure 4); this represents the range of ADC values typically observed in the CNS. Enthusiasm for the use of diffusion MRI for therapy assessment stems from previous animal studies which have reported that this approach can be used to monitor early events in tumor treatment in a variety of tumors models [8–13] along with a preliminary application to patients with primary CNS tumors [3,9].
Cellular Density
Diffusion-weighted MRI (DWI) has proven to be a sensitive technique for identifying regions of ischemic tissue damage in animal models of stroke and in patients [5–7]. Monte Carlo simulations suggest that changes in tissue water diffusion following tissue damage are predominantly attributable to alterations in the volume and tortuosity of the extracellular space [14–16]. These properties of the extracellular space are primarily a function of cell density, and recent work has shown that tumor water diffusion is associated with tumor cellularity [17–19]. Moreover, the spatial gradation of increasing diffusion from cellular/solid viable tumor to the acellular necrotic region of human gliomas has been noted [3] and suggests that the temporal evolution from viable tumor to treatment-induced necrotic tumor should be documented by an increasing diffusion coefficient as well. Comparison of ADC values from individual tumors with biopsy-derived histological sections provides important validation of this approach for noninvasively assessing cellularity of tumor tissue (Figure 5). In one example, a chordoma was found to contain neoplastic cells from spindle fibrosarcoma-like cells to epithelial-like elements arranged in aggregates floating within the mucus. This is an especially fluid-like tumor, which was found to have a very high ADC value of 2.3 × 10⁻³ mm2/sec. In contrast, a biopsied PNET was determined to contain a very high neoplastic cell density which, when probed using diffusion MRI, was determined to have a relatively low ADC value of 0.6 × 10⁻³ mm2/sec. These two examples reveal that diffusion MRI can detect differences in tumor cellular density based upon the relative mobility of water contained within the tumor tissue. This ability can be exploited in the clinical setting where classification of a CNS lesion as a cyst or a tumor may be difficult based only upon the information obtained from anatomical images (Figure 6). In these examples, an arachnoid cyst and an epidermoid tumor both presented as hyperintense lesions on T2-weighted MRI in two different patients. However, diffusion MRI revealed the cyst as a lesion with an extremely high ADC value (3.0 × 10⁻³ mm2/sec) while the tumor had a low ADC value (0.9 × 10⁻³ mm2/sec). These examples reveal that diffusion MRI can provide valuable information reflecting the cellularity of a lesion within the CNS, which can aid in clinical diagnosis.

Schematic representation of the cellular changes associated with effective therapy on diffusion of water within tumor tissue. A tumor treated with an effective therapy will have a reduction in cell density resulting in an increase in the diffusion value of water molecules.

Dynamic range of diffusion values: solid versus fluid. An anatomical T2-image of a patient with an enlarged ventricle along with a quantitative diffusion map. Regions of interest (ROI) were drawn in the solid brain region and in the ventrical space. Histograms from these two ROIs were plotted to reveal the distribution of ADC values from within these voxels.
Treatment Assessment
Evaluation of the clinical potential of diffusion MRI for detection of early therapeutic-induced changes in tissue structure is ongoing. It is hoped that for treatment assessment, the use of diffusion MRI will provide early evidence of cancer treatment efficacy in an individual patient prior to the completion of the therapeutic regimen [9]. A patient with a primary CNS tumor, which responded to a fractionated therapeutic regimen, would be anticipated to show an increase in tumor ADC values over time during the therapeutic regimen. For example, a 56-year-old female diagnosed with an anaplastic oligo-astrocytoma had failed chemotherapy and was entered into a diffusion MRI study. This patient was subsequently treated with radiotherapy (70 Gy in 35 fractions) which was completed 6 weeks later (Figure 7). Shown are T2-wt, FLAIR-wt, and ADC images from pre-XRT and week 6. All images were co-registered to the pretreatment T2-wt image. The clinical/radiological assessment revealed that radiotherapy provided a substantial benefit to this patient. This positive therapeutic effect was also detected in the first few weeks by an increase in the tumor diffusion value. In a second example, a 64-year-old male diagnosed with an anaplastic oligo-astrocytoma was also treated with radiotherapy initiated on week 0 (70 Gy to the tumor in 35 fractions) (Figure 8). Shown are T2-wt, FLAIR, and ADC images from pre-XRT and at week 16. All images were co-registered to the pretreatment T2-wt image for cross-comparison over time [20]. The radiological assessment on week 6 revealed only modest change in extent of the tumor mass. The fact that the tumor diffusion value did not increase also suggested that the treatment produced minimal positive therapeutic benefit. In fact, the diffusion value decreased slightly throughout the treatment protocol, which could be interpreted as a lack of cell killing effect during this treatment protocol. The results presented from these two patients reveal that tumor diffusion values could be measured during treatment and appear to reflect dynamic therapeutic-induced changes (or lack thereof) in tumor tissue structure. The early increase in diffusion, which was observed early into treatment of the first patient, is consistent with the clinical diagnosis of a partial therapeutic response (Figure 7). The data obtained from this patient indicated that diffusion MRI was sensitive enough to detect tumor cell kill. A stronger diffusion shift might be anticipated in patients more responsive to treatment. A therapeutically nonresponsive tumor revealed no significant increase in diffusion values throughout the treatment protocol of the second patient (Figure 8). These data support the hypothesis that the magnitude of change in tumor water mobility as assessed using diffusion MRI is related to the numbers of cells killed and hence, therapeutic efficacy.
For all clinical studies, written informed consent was obtained from all subjects presented here and all images and medical records were obtained according to protocols approved by the University of Michigan Medical School Institutional Review Board.
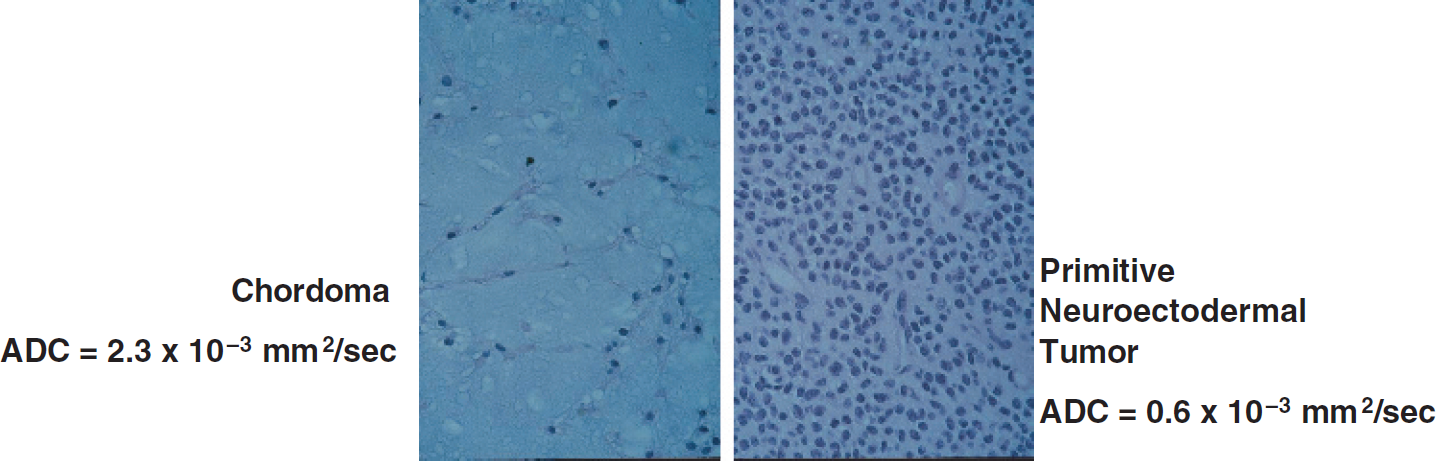
Histological examples of two different brain tumor sections with very different cellular densities. Also shown are their respective ADC values values which reflect the differences in cellularity.
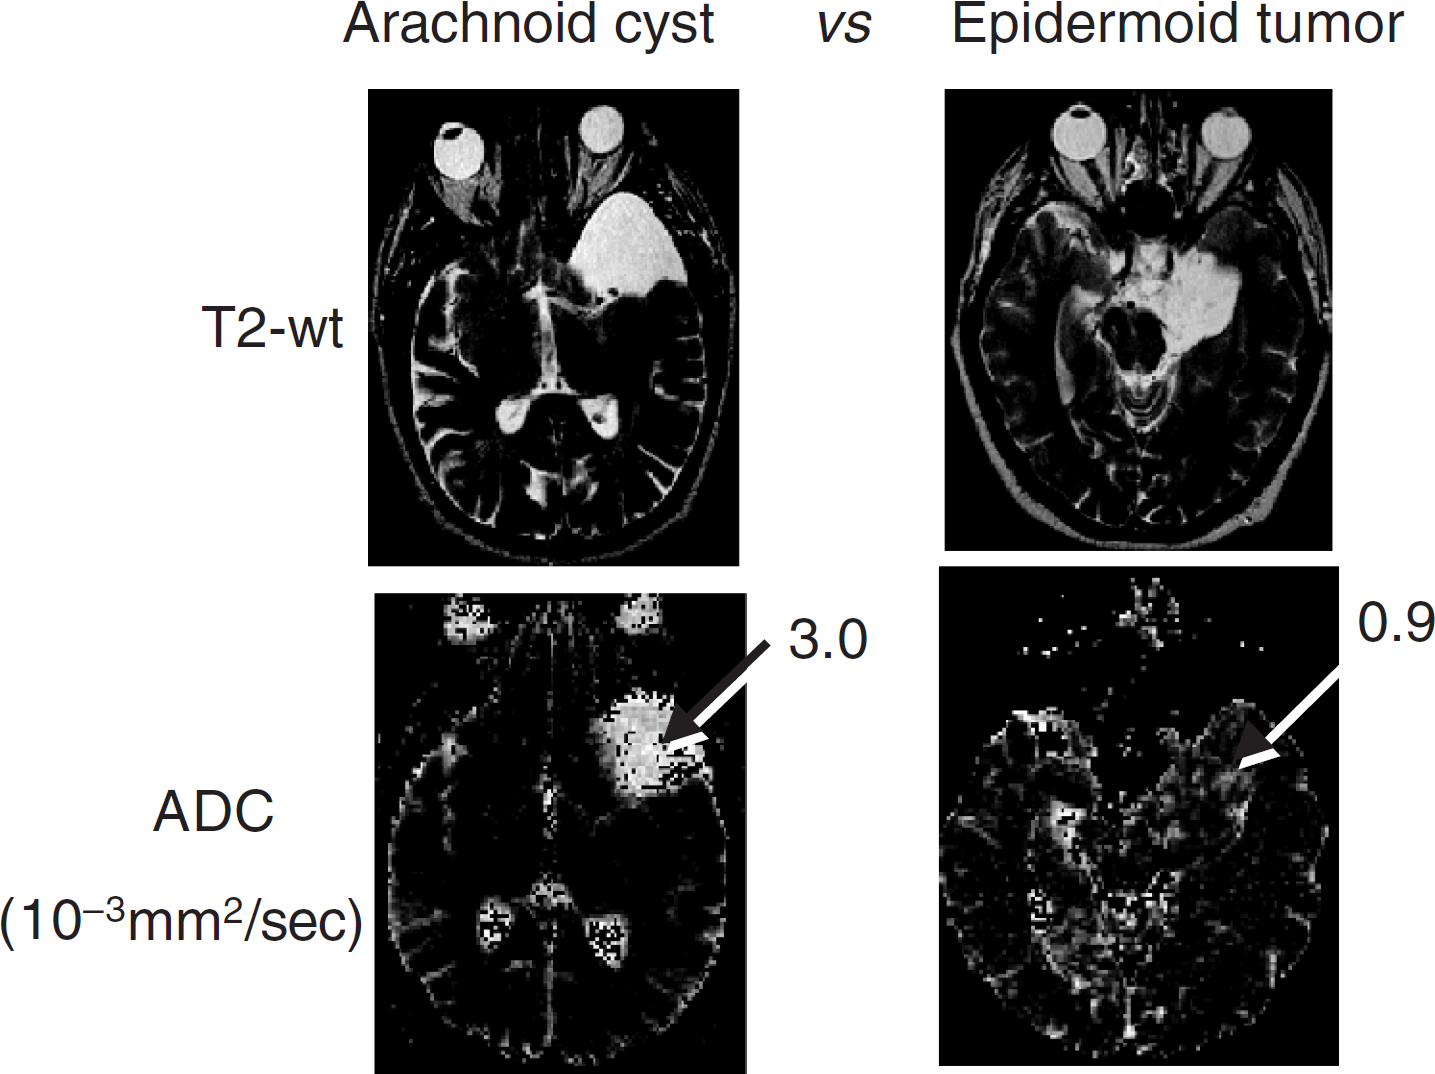
Application of diffusion MRI to assess cellular density. In these examples, the T2-weighted images (top two panels) shared similar intensities of the two lesions and were thus not useful for distinguishing cystic versus solid lesions. The diffusion maps (lower two panels) revealed the cyst to have very high diffusion values (3.0 × 10⁻³ mm2/sec) versus the tumor tissue which had a low diffusion value (0.9 × 10⁻³ mm2/sec).
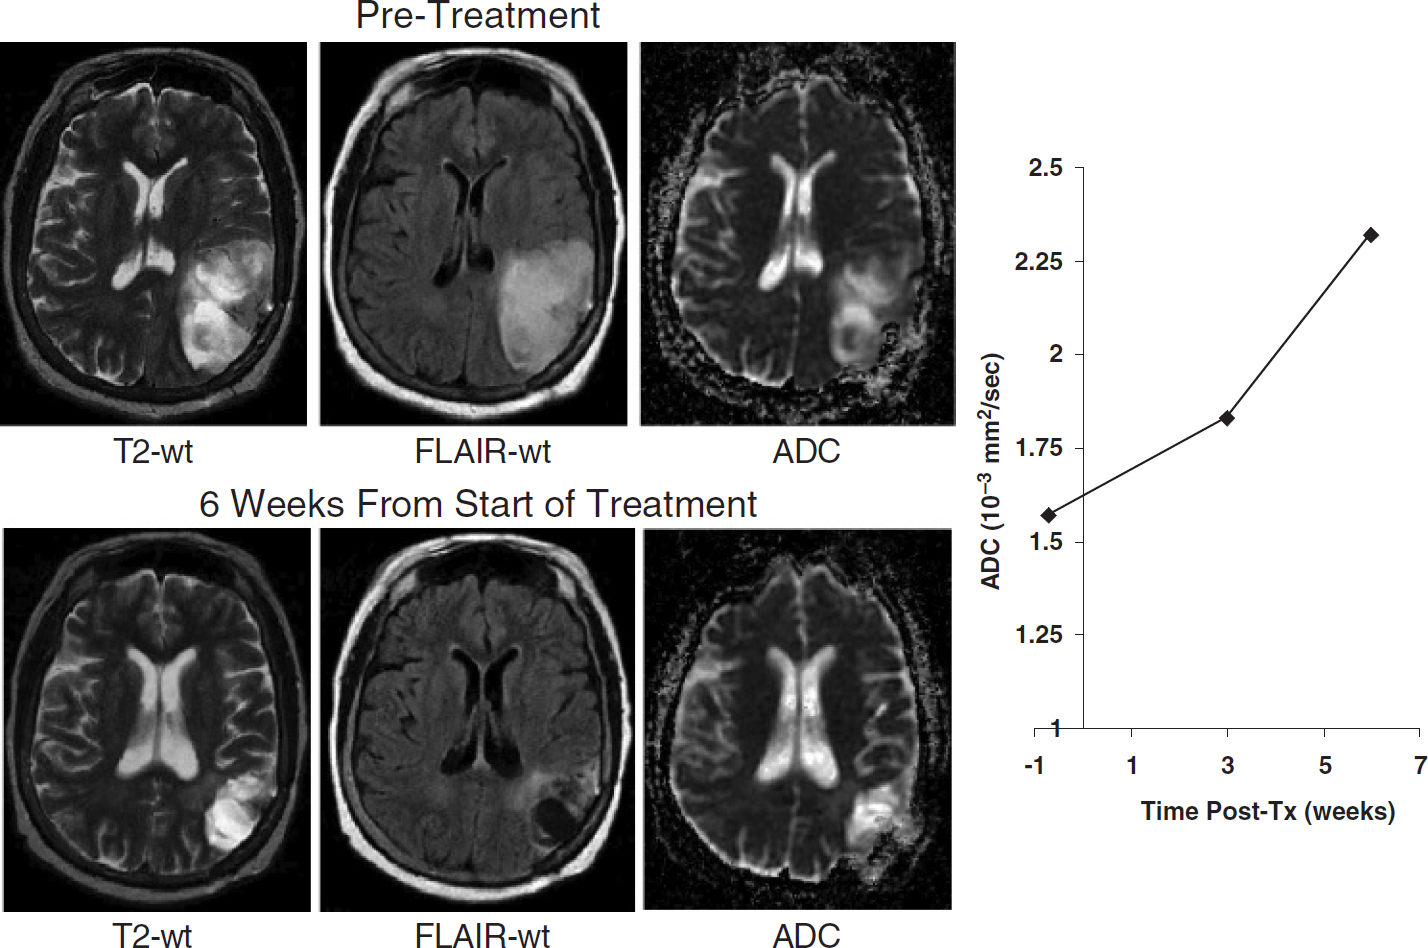
MRI study of a brain tumor before (top panel) and 6 weeks following therapy (bottom panel). Images shown are T2-weighted, FLAIR-weighted, and ADC maps from pre- and posttreatment. Note a significant reduction in tumor mass had occurred by 6 weeks, which was also reflected in a dramatic increase in diffusion values (right graph) as early as 3 weeks into therapy.
Tumor Heterogeneity
Tumors are known to be highly heterogeneous in terms of cell viability, perfusion, and oxygenation level. Since these biophysical properties are factors that can modulate efficacy of chemo- and radiotherapies, one could reasonably expect that therapy-induced changes may be heterogeneous within a given tumor. Since ADC images are quantitative, they can be used to regionally map therapy response. Such information has the potential to be valuable to guide spatially directed therapies such as gamma knife radiosurgery or intratumoral injection of agents. Since tissue “change” is of key interest, temporal shifts in diffusion coefficients are measurable by select regions-of-interest defined on ADC images. Alternatively, an “ADC difference” map provides an efficient means to survey regional tissue alterations. Figure 9 illustrates this concept in an individual treated by radiotherapy for a right temporal–frontal gliobastoma multiforme. Heterogeneity of tissue changes within and near the tumor are variable, whereas the majority of the brain remains unchanged.

MRI study of a brain tumor before (top panel) and 7 weeks following therapy (bottom panel). Images shown are T2-weighted, FLAIR-weighted, and ADC maps from pre- and posttreatment. The tumor mass had no significant shrinkage by the end of the 7-week period. There was no increase in tumor diffusion values (right graph) over this time frame, which was interpreted as a lack of significant tumor cell killing.
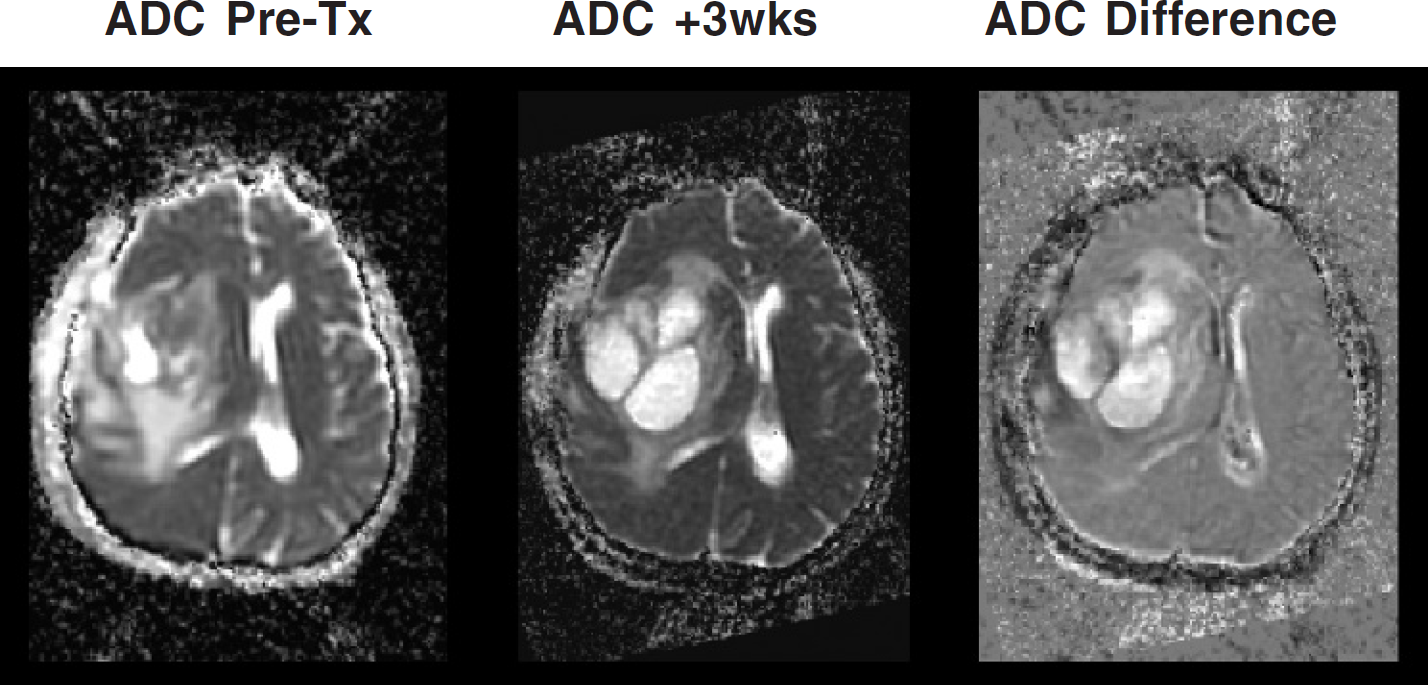
ADC Images of a brain tumor before treatment (left image) and 3 weeks into therapy (middle image). The two images were digitally co-registered and subtracted and displayed as a subtracted image (right image). This ADC-difference image reveals the spatial heterogeneity of tumor response, which occurred rapidly during the initial course of treatment in this patient.
Discussion
The use of diffusion MRI has potential for monitoring early changes in tumor cellularity, which may be reflective of treatment response. It is envisioned that imaging approaches such as this may assist physicians in tailoring treatments for individual patients and allow for alternative therapies to be attempted in a more timely fashion if a tumor is found to be resistant. This approach also provides the significant potential of assessing the regional/spatial heterogeneity of therapeutic response within a tumor. The heterogeneity of response may be accentuated in applications involving direct intratumoral administration of the therapeutic agent as is done in certain therapeutic protocols involving cancer gene therapy. Information regarding response heterogeneity may also be valuable to guide spatially directed therapies such as radiosurgery.
The examples shown in this brief overview reveal that diffusion MRI has potential for assessment of treatment response in individual patients. Early, reliable prognostic information may help physicians tailor treatment plans to individual patients and allow alternative therapies to be attempted in a more timely fashion if a tumor appears resistant. The sensitivity of diffusion MRI to changes in tissue structure may also advance experimental therapeutics by providing new tools for analyzing therapeutic outcomes both in laboratory models and in clinical trials. Further work is required to determine whether the observed changes in tumor diffusion are a universal response to the successful killing of tumor cells and to delineate more fully the prognostic ability of diffusion MRI.
Footnotes
Acknowledgments
This work was supported in part by research grants from the Charles A. Dana Foundation, the NIH (5R24CA83099, 1PO1CA85878, and 1P50CA93990), and the University of Michigan Comprehensive Cancer Center.