
Abstract
To correlate brain metabolic status with the molecular events during cerebral ischemia, a cDNA array was performed after positron emission tomography scanning in a model of focal cerebral ischemia in baboons. Cluster analysis for the expression of 74 genes allowed the identification of 4 groups of genes. In each of the distinct groups, the authors observed a marked inflection in the pattern of gene expression when the CMR
Ultimate tissue infarction is directly correlated with critical values of brain metabolism (Touzani et al., 2001). Several pathophysiologic mechanisms may contribute to the progressive enlargement of the final lesion: electro-physiologic, hemodynamic, and molecular perturbations. The penumbra, often qualified as potentially salvable tissue following appropriate therapy, displays many molecular modifications (Sharp et al., 2000; Touzani et al., 2001; Baron, 2001). It is now accepted that changes in expression of putatively beneficial or detrimental genes will determine its fate (Lipton, 1999; Sharp et al., 2000). However, the molecular mechanisms that underlie the switch of cerebral tissue from potentially rescuable to inexorably infarcted area are not far from defined.
Microarrays have been used in different rodent models of cerebral ischemia to identify genes that are abnormally up- or down-regulated (Soriano et al., 2000; Jin et al., 2001; Keyvani et al., 2002). In the studies previously cited, the analyses of gene expression were based on heterogeneous ischemic tissue samples without knowledge of the severity of ischemia. It is therefore necessary to undertake integrative investigations to understand the dynamics of gene expression after cerebral ischemia (Read et al., 2001). In the present study, to evaluate and correlate gene expression with the metabolic status of ischemic tissue after middle cerebral artery occlusion (MCAO) in the nonhuman primate, cDNA array analysis was performed based on positron emission tomography (PET) scanning.
MATERIALS AND METHODS
Surgical procedures
All experiments were carried out according to the French national legislation that governs animal experimentation. As described previously (Young et al., 1996), six male baboons (Papio anubis, 13 to 15 kg) were anesthetized, curarized and ventilated with 67% N2O in O2 under etomidate (0.3 mg · kg−1 · h−1; Hypnomidate; Janssen Pharmaceutical, Antwerp, Belgium). During surgical interventions isoflurane (0.5% to 1.5%; Forene; Abbott Laboratories, Queensborough, U.K.) was added. After enucleation, a small craniectomy was performed to expose the MCA. The dura mater and arachnoid were dissected to allow the permanent placement of two microvascular clips: one on the proximal main MCA trunk and the other on the orbitofrontal branch. Reconstruction of the orbit and tarsorrhaphy were performed and the animals were allowed to recover from anesthesia.
Physiologic (arterial pressure, heart rate, temperature) and biochemical (Pa
Positron emission tomography procedures
Two weeks before the MCAO, a magnetic resonance image (MRI; T2) examination was performed, as described previously (Young et al., 1996). The baboons underwent two PET examinations: one two weeks before occlusion and the second 24 hours after the induction of ischemia. With the 15O2 steady-state technique, parametric images of cerebral oxygen metabolism (CMR
After the second PET scan (i.e., 24 hours after MCAO), the baboons were deeply anesthetized with 2 to 3% isoflurane. Heparin (5,000 IU) was administered intravenously. The thorax was opened, a cannula inserted into the ascending aorta and heparinized saline was perfused until the perfusate from the right atrium was free of formed elements. Tissue was then harvested for both histologic and gene expression analyses.
Tissue sampling
The brain of a single representative animal was removed quickly and cut into 1-cm-thick coronal sections. Then, the section that showed the largest metabolic disturbances according to the PET scan was cut into 1-cm3 regions with the help of a grid, which was “superimposed” on the MRI and PET images. Accordingly, the coordinates, metabolic values, and histologic status of each cube of brain tissue were known before the cDNA array analyses.
RNA preparation
The tissue sample (50 mg) was suspended in 1 mL of TRI reagent (Euromedex, Mundosheim, France) and homogenized with Polytron (Kinematica AG, Basel, Switzerland). The total RNA (50 μg) was mixed with 1 mL of Dynabeads (Dynal Biotech, Oslo, Norway) to perform mRNA purification.
Expression profiling on microarrays
Preparation of cDNA clones
Inserts from human cDNA clones from an infant brain library (1NIB) and from the IMAGE Consortium were amplified by polymerase chain reaction (PCR) using primers (500 nmol/L) flanking the cloning site of the vector: M13 reverse primer (5'-AACAGCTATG-ACCAG-3') or T3 primer (5'-TAACCCTCACTAAAGGGA-3') and M13 forward primer-20 (5'-GTAAAACGACGGC-CAGT-3') or T7 primer (5'-AATACGACTCACTATAG-3'). Polymerase chain reaction fragments were visualized on 1% agarose gel to ensure PCR product amplification and purity. Each clone was sequenced (ESGS, Evry, France) and homology searches were performed using the BLAST program.
Spotting conditions
Each PCR product was spotted in triplicate onto a Hydond N+ nylon membrane (Amersham, U.K.) using a robot (Flexys; Genomic Solution, Huntingdon, U.K.) as previously described (Piétu et al., 1996).
Probe preparation
Complex cDNA probes were derived from polyA+ RNA (250 ng) and labeled (Decraene et al., 1999).
Hybridization and signal analysis
Filters were hybridized in duplicate with labeled complex probe in 10 mL of ExpressHyb (Clontech, Palo Alto, CA, U.S.A.) for 2 hours and washed twice in 1x sodium chloride-sodium citrate (SSC)/0.1% sodium dodecyl sulfate (SDS) for 30 minutes and twice in 0.1 x SSC/0.1% SDS for 30 minutes. Image acquisition and spot quantification were realized as described (Piétu et al., 1996). The six hybridization intensity values (Im) were normalized by dividing by the average of all the hybridization intensity values on each membrane and validated when up to 5 of the 6 hybridization intensity values were similar (SD < 25% of the mean) The hybridization background varied from one probe to an other (Im 0.13 to 0.32). A clone is considered detectable when Im is greater than 0.5.
Data analyses
Microsoft Excel was used for designing queries and data handling signal intensity as a function of CMR
Statistics
All results are presented as mean ± SD. Statistical analyses were performed with ANOVA followed by a Bonferroni test.
RESULTS
Middle cerebral artery occlusion
Twenty-four hours after MCAO, the selected baboon exhibited contralateral hemiparesis and histologic investigation revealed the presence of infarcted brain tissue. As stated in Materials and Methods, physiologic parameters were monitored and kept within physiologic limits. The post-MCAO PET scan revealed a large zone of decreased CMR
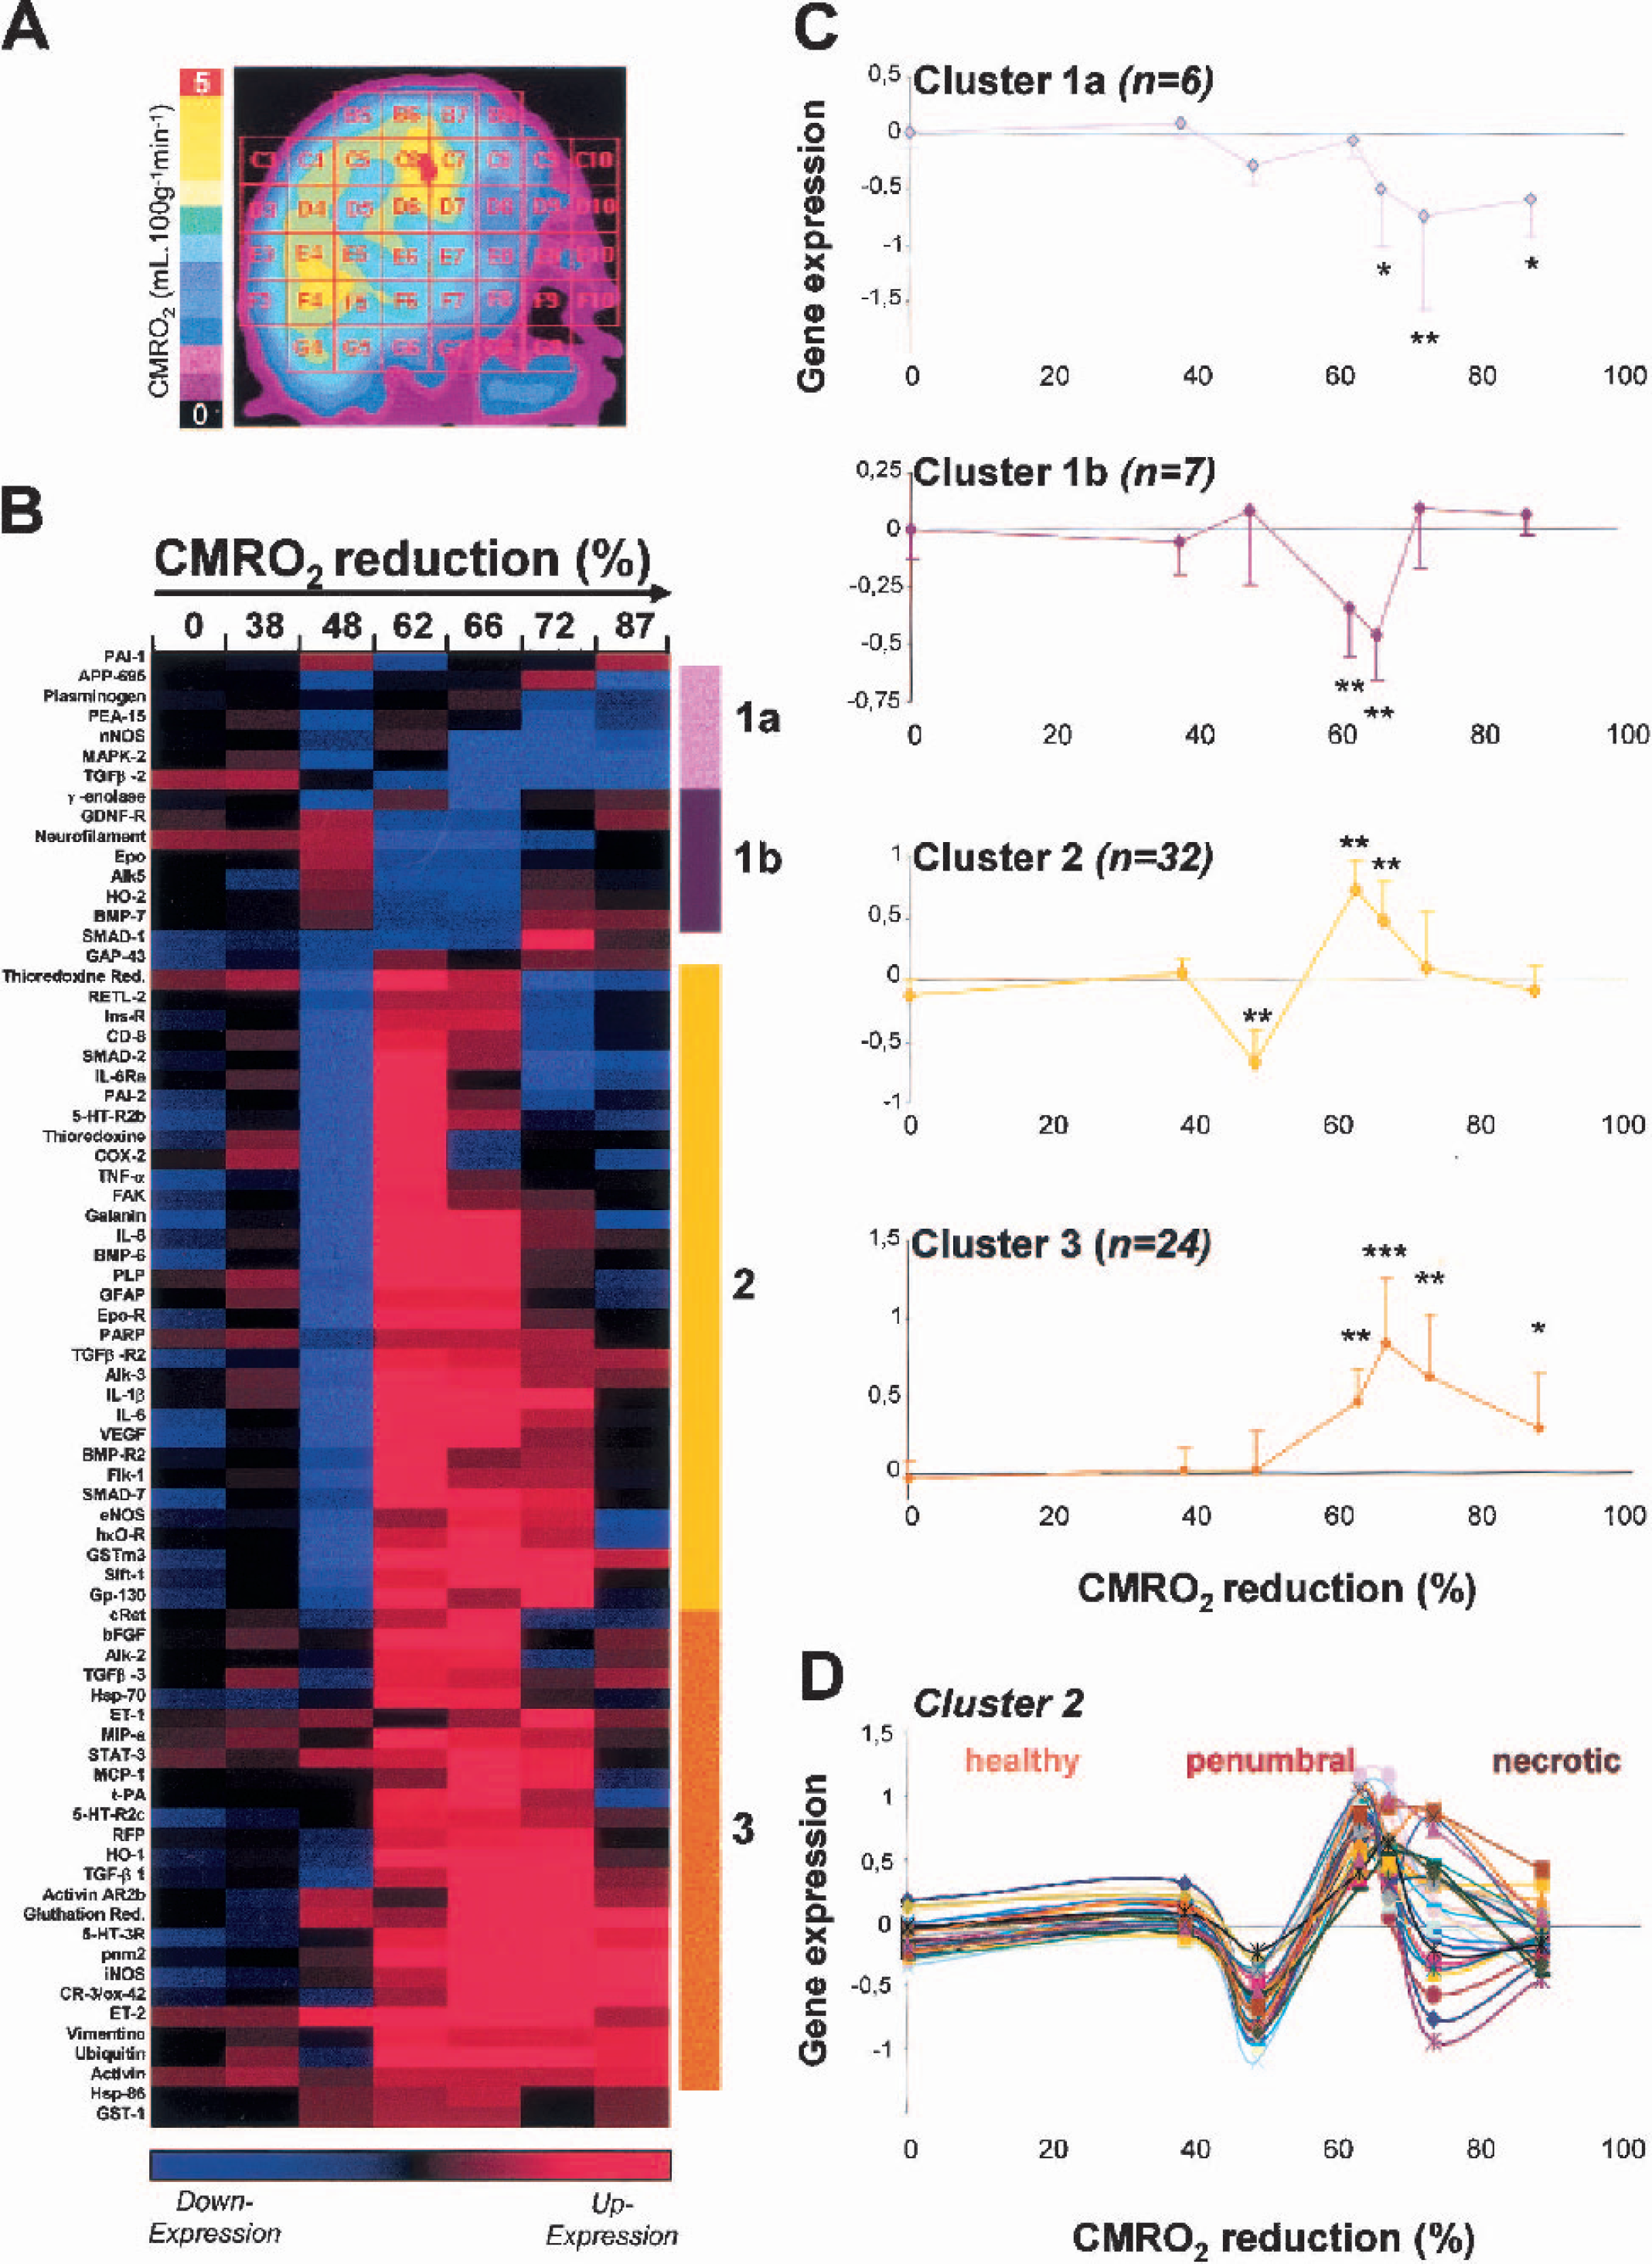
(A) A parametric positron emission tomography image of CMR
Microarray analysis
The extraction of total RNAs was performed in all cubes referred to in Fig. 1A. To avoid misinterpretation with genes lowly expressed, only those clones with a hybridization signal twice the background were considered. cDNA array analysis was repeated (x6) with each sample. Only the genes for which the variability was less than 25%, were cluster analyzed.
The relative expression (i.e., ratio between gene expression in the ipsilateral and mirror-image cube) of 74 cDNA clones was presented as a function of ΔCMR
Cluster analysis
The analysis of gene expression based on ΔCMR
Changes in gene expression were never seen when ΔCMR
DISCUSSION
The sequencing of the human genome has promoted considerable discovery, interest in the application and development of gene targets for the treatment of cerebral injuries such as ischemic stroke. Previously, the identification of gene targets for neuroprotective strategies has proven difficult. These problems could be related to the multitude of animal models, with either genetic heterogeneities (e.g., transgenic models) or variabilities in surgical approaches. Further difficulties of interpretation are inherent to the various methods used to analyze gene expression. Because of their large throughput, microarrays analyses have been used recently. The originality of the present investigation is to combine gene expression with metabolic parameters in tissue samples.
A review of the literature has identified a list of stroke-associated genes (Read et al., 2001). Interestingly, in our study, we confirm the overexpression of genes such as IL-1β, TNF-α, TGF-β1, VEGF receptor, MCP-1, MIP-1α, and heat-shock protein (hsp)-70 in injured tissue, compared with healthy contralateral areas. The results obtained with the expression pattern of TGF-β1 based on the present microarray technique are in agreement with our previous data in the same model of cerebral ischemia in the baboon, when estimated by either RT-PCR or immunoblotting (Ali et al., 2001). The present study confirms that the microarray analysis is a powerful tool for the identification of differential gene expression in experimental stroke and thus the development of potential therapeutic targets.
This study provides a brain mapping of the transcription of sets of injury-related genes in a primate model of cerebral ischemia as function of the severity of ischemia-induced hypometabolism. The penumbra has been defined, in rodent, as the area displaying a suppression of protein synthesis with preservation of the ATP content (Hata et al., 2000). Theses authors correlated the metabolic penumbra with an overexpression of hsp-70, c-fos, c-jun and jun-B. They found that hsp-70 was specifically expressed in the penumbra. Our data confirm an overexpression of hsp-70 in tissue with a ΔCMR
Although a causal and functional implication of these 74 genes, in the pathogenesis of ischemic brain damage, cannot be inferred, our present analytical approach shows that it is feasible to correlate gene expression with the severity of ischemic damage. Finally, our original data could provide molecular restriction points for the development of the ischemic infarct and may lead to a molecular definition of penumbra.
Footnotes
Acknowledgements
The authors thank Prof. Jean-Michel Derlon, Dr. Alan R. Young, Laurent Chazalviel, and Didier Divoux for their participation in the middle cerebral artery occlusion surgery and histologic analyses. The authors also thank the members of the Cyclotron Unit at Cyceron for the production of radioactive tracers.