
Abstract
Thrombolysis within 3 to 6 hours of symptom onset is recommended therapy for acute middle cerebral artery (MCA) stroke, but recent imaging studies in humans suggest that the penumbra may last much longer in some patients. It is therefore important to study the events that take place with occlusions that last longer than 6 hours. Based upon positron emission tomography (PET), the tissue with high oxygen extraction fraction (OEF) is at risk of infarction. In a previous sequential PET study in anesthetized baboons, we documented that when reperfusion was initiated at 6 hours after MCA occlusion, the region with the acutely highest OEF was not incorporated within the final magnetic resonance imaging (MRI)-defined infarct, suggesting reperfusion prevented such demise. In agreement with this hypothesis, we report here using the same sequential PET paradigm with final chronic-stage volume MRI that a 20-hour MCA occlusion resulted in, on average, 36% of the highest OEF area being recruited into the final infarct. We also found that the portion of the highest OEF area that went on to infarct had at the earliest time-point significantly lower cerebral blood flow and cerebral oxygen metabolism (mean reductions relative to unoccluded side, 56% and 32%, respectively) than the portion that did not (41% and 11%, respectively) and that some reperfusion occurred in the latter at second time-point, that is, before recanalization. Thus, apart from duration of occlusion, the fate of the at-risk tissue is predicated by the initial severity of the ischemia as well as by early secondary events such as partial spontaneous reperfusion.
Keywords
Despite increased risk of hemorrhagic transformation, thrombolysis is recommended therapy for acute middle cerebral artery (MCA) ischemic stroke. According to clinical trials, the benefit from intravenous (IV) thrombolysis fades approximately 270 minutes after onset of the stroke (Fisher and Brott, 2003), whereas that from intraarterial thrombolysis appears to last at least up to 6 hours after onset in selected patients (Furlan et al., 1999). Nonetheless, more delayed treatment has not been tested as yet. Physiologic imaging in stroke patients has documented that neurologic recovery is related to efficient reperfusion of the ischemic penumbra (Baron et al., 1995; Furlan et al., 1996; Heiss et al., 1998; Marchal et al., 1993; Wintermark et al., 2002). Accordingly, a promising avenue would be to select for thrombolysis only those patients with tissue at risk of infarction based upon neuroimaging techniques (Marchal et al., 1993), such as diffusion and perfusion-weighted magnetic resonance imaging (MRI) Kidwell et al., 2002; Saver et al., 2001).
Using positron emission tomography (PET), the at-risk tissue is characterized by high oxygen extraction fraction (OEF) (Baron, 1999; Heiss, 2000). Sequential studies in anesthetized baboons with permanent MCA occlusion (MCAO) have documented the demise of the high OEF tissue as a process that can last up to 24 hours (Touzani et al., 1995). Recruitment of the high OEF tissue into the core of irreversible damage begins in the initial minutes or hours after occlusion, at first concerning the striato-capsular area and gradually involving the overlying cortex until maximal infarct expansion is reached (Heiss et al., 1997; Pappata et al., 1993; Touzani et al., 1995). In a previous study, we documented that when reperfusion was initiated at 6 hours after MCAO, the region with the highest OEF (observed at MCAO + 1 hour) was not incorporated into the final infarction defined on coregistered MRI (Young et al., 1996), resulting in a significantly smaller histologic infarct than with permanent MCAO (Touzani et al., 1995; Young et al., 1997). To explain these findings, we hypothesized that occlusion times greater than 6 hours should result in incorporation of (at least part of) the highest OEF area into the final infarct.
In the present study, we tested this hypothesis by inducing reperfusion after a 20-hour MCAO period in anesthetized baboons. According to our model (Fig. 1), a 20-hour MCAO should result in substantial overlap between the region with initially highest OEF and the final MRI-defined infarct. We were also interested in knowing whether there would be differences in key hemodynamic and metabolic variables (e.g., cerebral blood flow, cerebral oxygen metabolism) between the highest OEF region that evolves to infarction (if any) and that which does not, that is, what characterizes the tissue at greatest risk of infarction. To compare this investigation with our previous work (Young et al., 1996), we used the same general experimental protocol and imaging procedures to monitor sequentially the cerebral blood flow (CBF), OEF, and cerebral oxygen metabolism (CMRO2) with PET and map the final infarct with coregistered MRI.
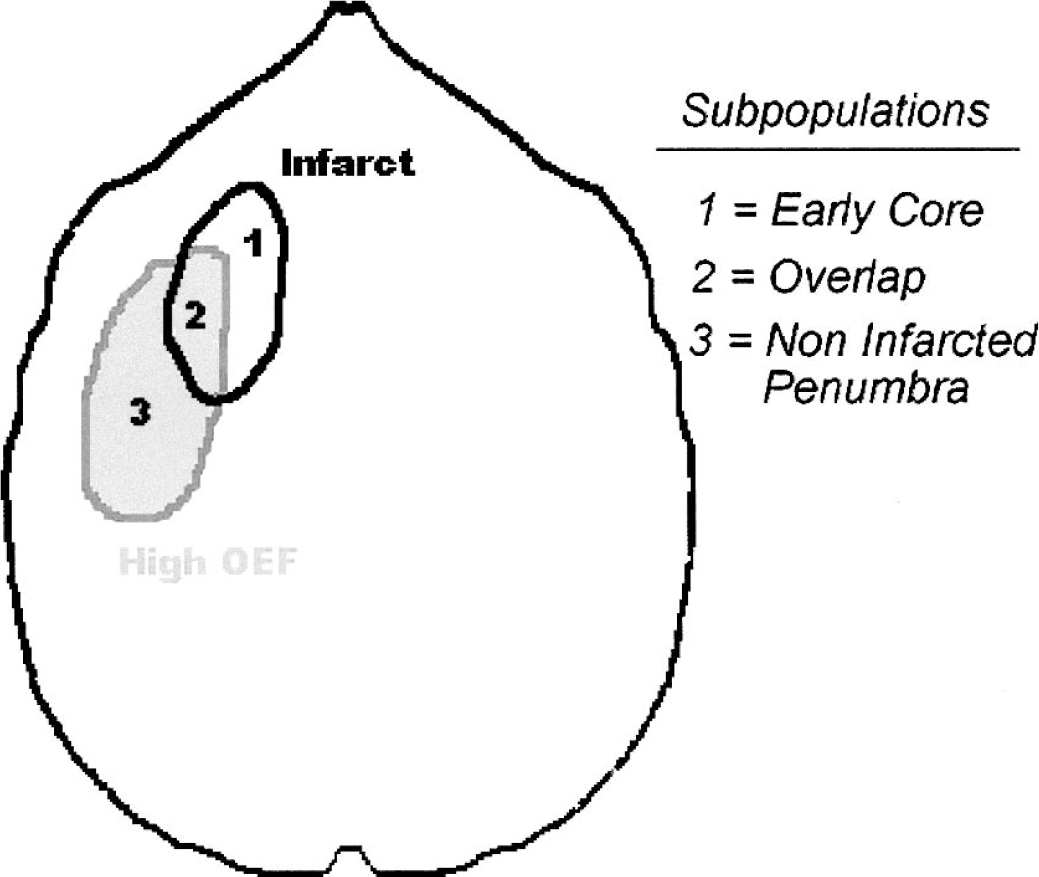
Idealized model of the geographic intersection between the region with PET-defined high OEF early after MCA occlusion (regions 2 and 3) and the final infarct as defined on chronic-stage MRI (regions 1 and 2), resulting in three distinct tissue subtypes: the intersection of these two ROIs (Overlap), the infarcted tissue not overlapping with the high OEF area (Early Core), and the ultimately noninfarcted high OEF zone (Noninfarcted Penumbra). See Introduction. PET, positron emission tomography; OEF; oxygen extraction fraction; MCA, middle cerebral artery; ROI, region of interest.
METHODS
Apart from the PET device used (see next sections), the experimental protocol (including anesthesia) was unchanged from our previous studies (Young et al., 1996). Experiments were performed in five adolescent male baboons (Papio anubis) with body weights ranging from 7 to 19 kg. The studies were performed in accordance with the ethics rules of the INSERM Bureau of Animal Experimentation. The baboons were lodged in individual cages maintained at 24°C with 50% relative humidity on a 12/12 hour light/dark cycle and were fed commercial chow supplemented with fresh fruit and water ad libitum. The evening before investigation, all solid foods were withdrawn.
Anesthesia
The baboons were tranquilized with an intramuscular injection of short-acting ketamine/xylasine (0.06 mL/kg, 0.03 mL/kg). Subsequent to the placement of catheters in both external saphenous veins, anesthesia was induced by the administration of etomidate (3 mg/kg, IV). The hypnotic effects of etomidate were potentiated with clonidine (80 μg, infused intravenously over 10 minutes).
After the administration of atracurium (0.5 mg/kg, IV) so as to achieve muscular relaxation, endotracheal intubation was performed. All baboons were placed on intermittent positive pressure ventilation with periodic inflation to minimize atelectasis. A fixed respiratory rate (20 min−1) was used, and the tidal volume was adjusted so as to maintain normocapnia (39–41 mm Hg). In every case, anesthesia was maintained with 67% of nitrous oxide in oxygen (humidified at 38°C) along with intravenous infusion of etomidate (0.3 mg/kg-h) and atracurium (0.75 mg/kg-h). With this anesthetic regimen the mean arterial pressure remained stable throughout the entire duration of studies.
During all surgical interventions, inhalation of isoflurane (0.5%–1.5%) was added to the anesthesia protocol: isoflurane was stopped at least 90 minutes before any PET measurement.
Before placement and removal of the ear bars in the baboon (for the stereotaxic frame), atropine sulphate (0.25 mg, IV) was injected. Starting 1 hour before reperfusion, all baboons received an intravenous perfusion of heparin (50 IU at 3 mL/h). After each PET session, the baboon was allowed to fully recover before being returned to its cage.
Middle cerebral artery occlusion
The right MCA was approached transorbitally (Hudgins and Garcia, 1970). After enucleation, a small craniotomy was performed using a high-speed saline cooled dental drill to expose the right MCA. The dura was opened and the arachnoid dissected to allow the placement of two occlusive microvascular clips: one on the proximal part of the trunk, and the other on the orbitofrontal branch. During this procedure, warmed saline was used to reduce the risk of vascular spasm. The occlusion was temporary (mean 20 hours, range 18 hours 48 minutes to 21 hours 8 minutes) and straddled across 2 days. At the end of the first day, a temporary orbit closure was realized using aseptic gauze and eyelid suture, then the animal was allowed to fully recover and was returned to a clean cage for the night after control of its clinical status. On the second day, the animal was tranquilized and anesthetized as described above, the orbit was reopened, and the occlusive clips removed. Effective reperfusion was obtained in each animal. Reconstruction of the orbit under aseptic conditions was then performed, allowing postoperative recovery and survival into the chronic stage.
Postoperative care
Before recovery from the final surgical intervention, a blood transfusion was given (250 mL of concentrated erythrocytes; hematocrit > 80%; hemoglobin 20 g/L, preceded by 2 mg of dexamethasone intramuscularly. To reverse the atracurium, neostigmine was administered before weaning the baboon from the ventilator. Antibiotic administration with cephamandole was given over 5 days (15 mg/kg, intramuscularly).
Physiologic monitoring
End tidal CO2 and N2O concentrations were monitored continuously using an infrared absorption analyser. The concentration of O2 was continuously measured by an electrochemical system. A catheter was percutaneously inserted into each femoral artery for measurement of PaCO2, PaO2, pH, Ht, and hemoglobin concentration. Blood glucose concentration was regularly monitored. As vehicle for anesthetics, saline and Ringer solutions were infused intravenously (50 mL/h). In case of metabolic acidosis (defined as a base of >3 mEq/L), NaHCO3 was administered. A physiologic recording system was used to monitor the ECG, heart rate, and arterial pressure both by a plethysmograph and directly by a strain gauge system. Body temperature was maintained within normal limits (37°C to 38°C) by means of heating blankets.
Positron emission tomography procedures
A control PET session was performed 2 weeks before the surgery (Pre-MCAO). The second PET session (MCAO1) was performed as soon as possible after the MCA clips were placed and the baboon adequately positioned inside the field of view of the PET device; scanning started 1 hour 15 minutes (range 1 hour to 1 hour 35minutes) after MCAO. The third PET session (MCAO2) started 17 hours 30 minutes (range 16 hours 32 minutes to 18 hours 42 minutes) after MCAO and was immediately followed by clip removal, which took place, on average, 20 hours (range 18 hours 58 minutes to 21 hours 8 minutes) after MCAO. The fourth PET session (Rep1) took place as soon as possible (average 1 hour 40 minutes; range 1 hour to 2 hours 05 minutes) after clip removal and adequate repositioning of the animal. The final PET session (Rep2) took place in the chronic stage, on average, 30 days (range 21 to 47 days) after MCAO. The overall experimental plan is illustrated in Fig. 2.
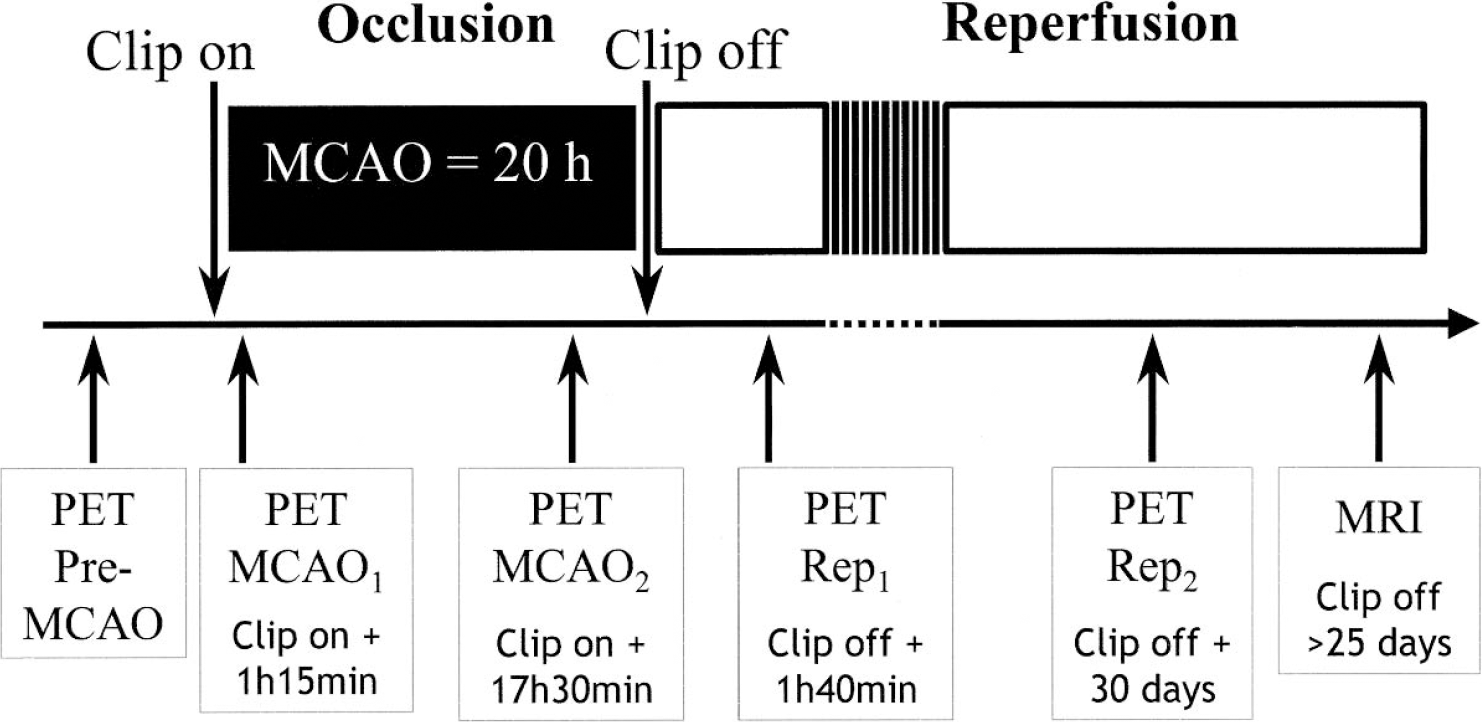
Experimental paradigm.
In this study, we used the fourth-generation ECAT HR+ PET device (SIEMENS, Knoxville, TN, U.S.A.), which has an intrinsic spatial resolution of 4.5 × 4.5 × 4.6 mm (x; y; z), allowing us to acquire 63 slices (voxel size: 1.471 × 1.471 × 2.425 mm, xyz). The baboon was placed supine on the couch, and its head was fixed in a specially designed frame with ear bars placed in the external bony auditory canal, which allowed optimally reproducible head positioning (both inter- and intra-animal). By means of the external laser beams, the canthomeatal plane was made parallel to the acquisition volume. A 10- to 15-minute 68Ga-68Ge-transmission scan was first performed, and then 15O-labeled CO, O2, and CO2 were successively administered via the tracheal tube until equilibrium was reached. PET acquisition for all three gases lasted 60 to 90 minutes and used the septa-out (3D) mode. Steady-state arterial blood concentration were measured for each gas as detailed in our previous article (Young et al., 1996). The PET images were transformed into parametric images of the CBF, cerebral oxygen metabolism (CMRO2), cerebral blood volume (CBV) and OEF, using equations that include CBV correction (Pantano et al., 1985).
Magnetic resonance imaging
To obtain both a precise brain anatomy of each animal and the exact topography and size of the final infarct, each baboon underwent a T1- and T2-weighted MRI procedure in vivo, more than 25 days after reperfusion (volume acquisition, 256 adjacent slices, 0.7 × 0.7 × 0.7 mm) (Sigma 1.5T, General Electric, Milwaukee, WI, U.S.A.). Animals were sedated with a mixture of ketamine/xylazine, and anesthesia was completed with Isoflurane (1%) added to O2:N2O (spontaneous respiration). Because we used a surface coil, the animal was placed in the sphinx position; the external bony auditory canals were aligned to external laser beams.
Image processing: image coregistration
For each animal, the Pre-MCAO PET data set was used as the reference. All remaining PET as well as MRI data sets were coregistered to this reference using AIR 3.0 (Woods et al., 1998) running on Sun O2 workstations. All coregistrations were individually verified and, if necessary, perfected using MPI-Tool (Multi Purpose Imaging Tool; Schuster A., Lucht H. and Vollmar S., Advance Tomo Vision Gmbh).
Regions of interest
Regions of interest (ROIs) were defined by the first author using the CAPP software (Clinical Application Packaging Program).
Highest OEF region of interest.
To be consistent with our previous study (Young et al., 1996), the planes of interest were centered on +21 mm relative to the canthomeatal plane. Because in this study a high-resolution PET was used, as compared with a low resolution device in Young et al. (1996) (in obsolescence since 1998), (5.5 × 5.5 × 9 mm; x;y;z), we used three adjacent planes (i.e., covering 7.275 mm in the z axis), with the middle plane centered at +21.825 mm relative to the canthomeatal plane. The highest OEF ROI was an automatically generated isocontour collecting all voxels > 80% of the peak pixel value; this cutoff was selected to match as closely as possible the data obtained by Young et al. (1996) with a cutoff of 88%, taking into account the difference in PET spatial resolution between the two devices. With this thresholding approach, the highest OEF ROI could comprise several distinct “islands” (see Fig. 3). A mirror ROI was generated onto the healthy hemisphere relative to the midsagittal plane, defined on the corresponding T1-weighted MRI scans cuts.
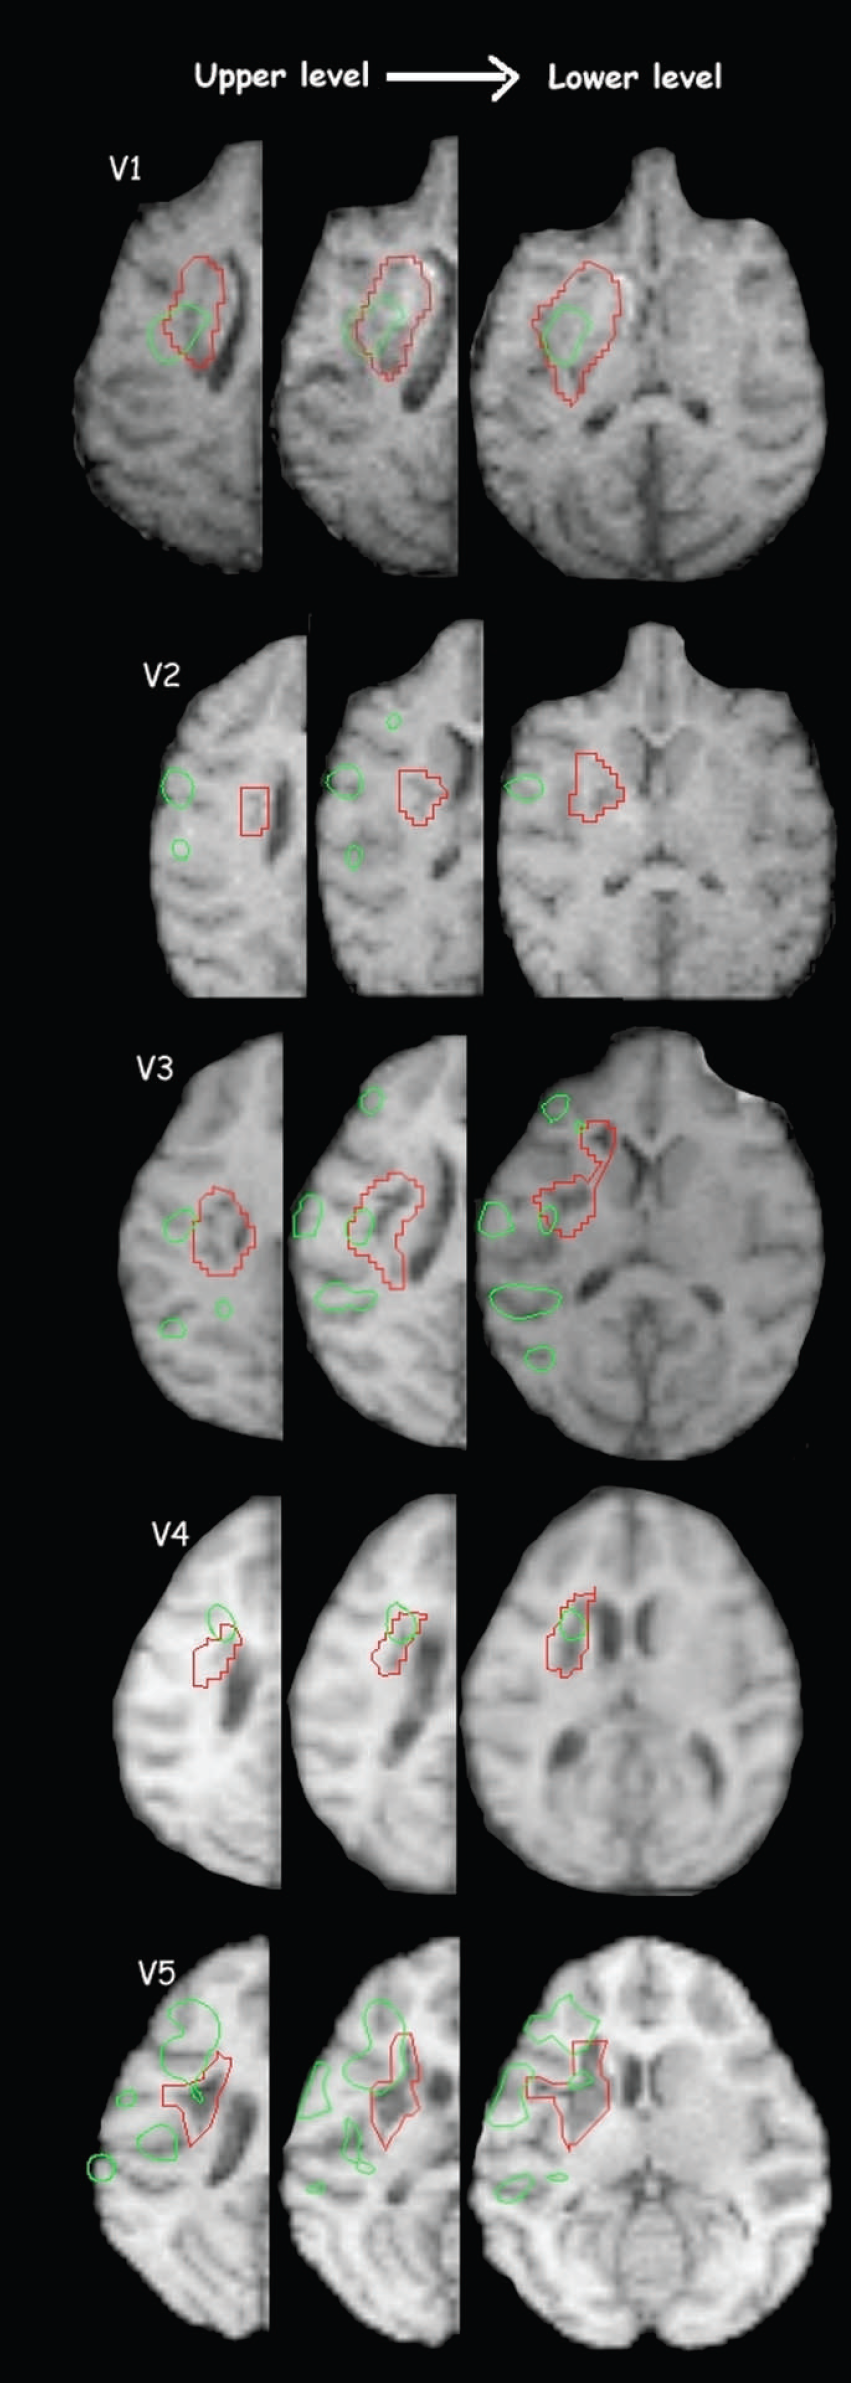
This graph shows the three adjacent axial T1 planes used for this study for each animal (V1 to V5). Infarct ROI (red contours). Highest OEF ROI defined at MCAO1 (green contours). Overlap between the two ROIs is seen in all baboons except V2. OEF, oxygen extraction fraction; ROI, region of interest; MCAO, middle cerebral artery occlusion.
Infarct region of interest.
On the coregistered MRI data sets, the infarct ROI was delineated on the three planes corresponding to the three selected PET planes. The ROIs were manually drawn on the hyperintense T2 lesion. The T1 data set was then used to verify and occasionally slightly adjust these infarct contours. Mirror ROIs were generated as described in the previous section.
Voxel population sorting
Following the definition of the highest OEF and infarct ROIs, and according to our goal (see Introduction and the model shown in Fig. 1), the next step was to identify in each animal the subpopulations of voxels that belonged to the following:
The Early Core: the part of the final infarct not displaying high OEF at MCAO1.
The Overlap: The part of the highest OEF ROI that progressed to infarction.
The Noninfarcted Penumbra: the part of the highest OEF ROI that did not progress to infarction.
To this end, we used an in-house software (Pixmoy3D), which identifies all the voxels belonging to a given ROI by their xyz coordinates and therefore allows access to all of the PET variables of each voxel across all PET sessions. To implement this, the highest OEF and infarct ROI contours defined with CAPP were transferred into Pixmoy3D. The individual voxel values, for each variable and each PET session, were then automatically transferred into Excel spreadsheets. With the help of a specially written macro-function, the voxels were then sorted into each of the three subpopulations defined above, and the voxel values were averaged to provide the means for CBF, CBV, CMRO2, and OEF for each subpopulation of voxels (and their mirror voxels) and each of the five PET sessions. The Pixmoy3D software automatically regrouped the voxels belonging to each ROI even if the latter comprised distinct “islands” (Fig. 3). The total number of voxels within each subpopulation was also directly accessible, which, knowing voxel size, provided the volume for these subpopulations.
In addition to computing the mean absolute CBF, CMRO2, and OEF for each voxel subpopulation (and for their unaffected-side mirrors) at each PET session, affected/unaffected ratios for each of these variables were also computed. The use of ratios controls for both global brain changes in the measured physiologic variables from one PET session to the next (hence allowing longitudinal analysis) and potential differences in the proportion of gray and white matter among the subpopulations (hence allowing comparisons among the three subpopulations; see Statistical analysis).
Statistical analysis
Physiologic and biochemical data.
The physiologic and biochemical data were analyzed using repeated measure ANOVAs followed by post hoc Bonferroni test. A cutoff of P>0.05 Bonferroni-corrected was judged as significant.
Positron emission tomography data.
Both the small sample (N = 5 animals; but N = 4 for the overlap, see next sections) and the previous hypotheses about the findings (see Introduction) were taken in consideration for the statistical analysis in three ways: 1) because this study is descriptive only, no correction for multiple tests was applied; 2) so as not to miss potentially meaningful trends, both parametric and nonparametric tests were applied; and 3) to constrain the risk of false positives, the number of statistical tests was kept to a minimum.
Within each voxel subpopulations, we performed the following analysis. We looked for significant side-to-side differences by comparing for each time-point and each PET variable the absolute values for the affected side with the corresponding values for the unaffected side, using paired t-tests and Wilcoxon tests. We assessed the time-course of changes by comparing the lesioned/unaffected ratios between each time-point and its immediately preceding time-point, also using paired t-tests and Wilcoxon tests. Among the voxel subpopulations, the lesioned/unaffected ratios were compared pair-wise, that is, for each time-point each subpopulation was compared separately with each of the two other subpopulations (for a total of three comparisons), using both paired t-tests and Wilcoxon tests.
For each of the above statistical comparisons, we considered a change as significant if the P>0.05 cutoff was reached in one of the two tests (i.e., parametric or nonparametric) and the P>0.1 cutoff in the other; note that with samples of n = 4, as occurred in this investigation for some analyses (see Results), the P>0.1 cutoff for the nonparametric test was considered equivalent to P>0.05, as this is the probability ceiling at this degree of freedom. Any significant finding according to these criteria was considered “highly significant” if both the P>0.01 level for one test and the P>0.05 for the other test (or P>0.10 for n = 4 with the nonparametric test) were reached.
In addition to these tests, comparisons among the three voxel subpopulations were also performed with repeated-measures ANOVAs, searching for significant Time and Group Effects, as well as Time x Group interactions.
Finally, data from the present study were compared with corresponding data from the Young et al. (1996) study by means of Fisher's exact test, which compares proportions in independent samples.
The CBV data will not be shown nor discussed in the next sections because no finding important to the understanding of the pathophysiologic phenomena investigated in this study emerged. To get an idea of the range of CBV values and changes in CBV induced by MCA occlusion and recanalization in this baboon model, the interested reader is referred to our previous investigation (Young et al., 1996).
RESULTS
Physiologic and biochemical data
The physiologic and biological data are presented in Table 1. Although all values remained within physiologic range, the ANOVAs revealed significant (P>0.05) changes relative to Pre-MCAO for all variables except PaCO2 and body temperature (which were strictly controlled as per protocol). Briefly, these significant changes were as follows:
Physiologic and biochemical data
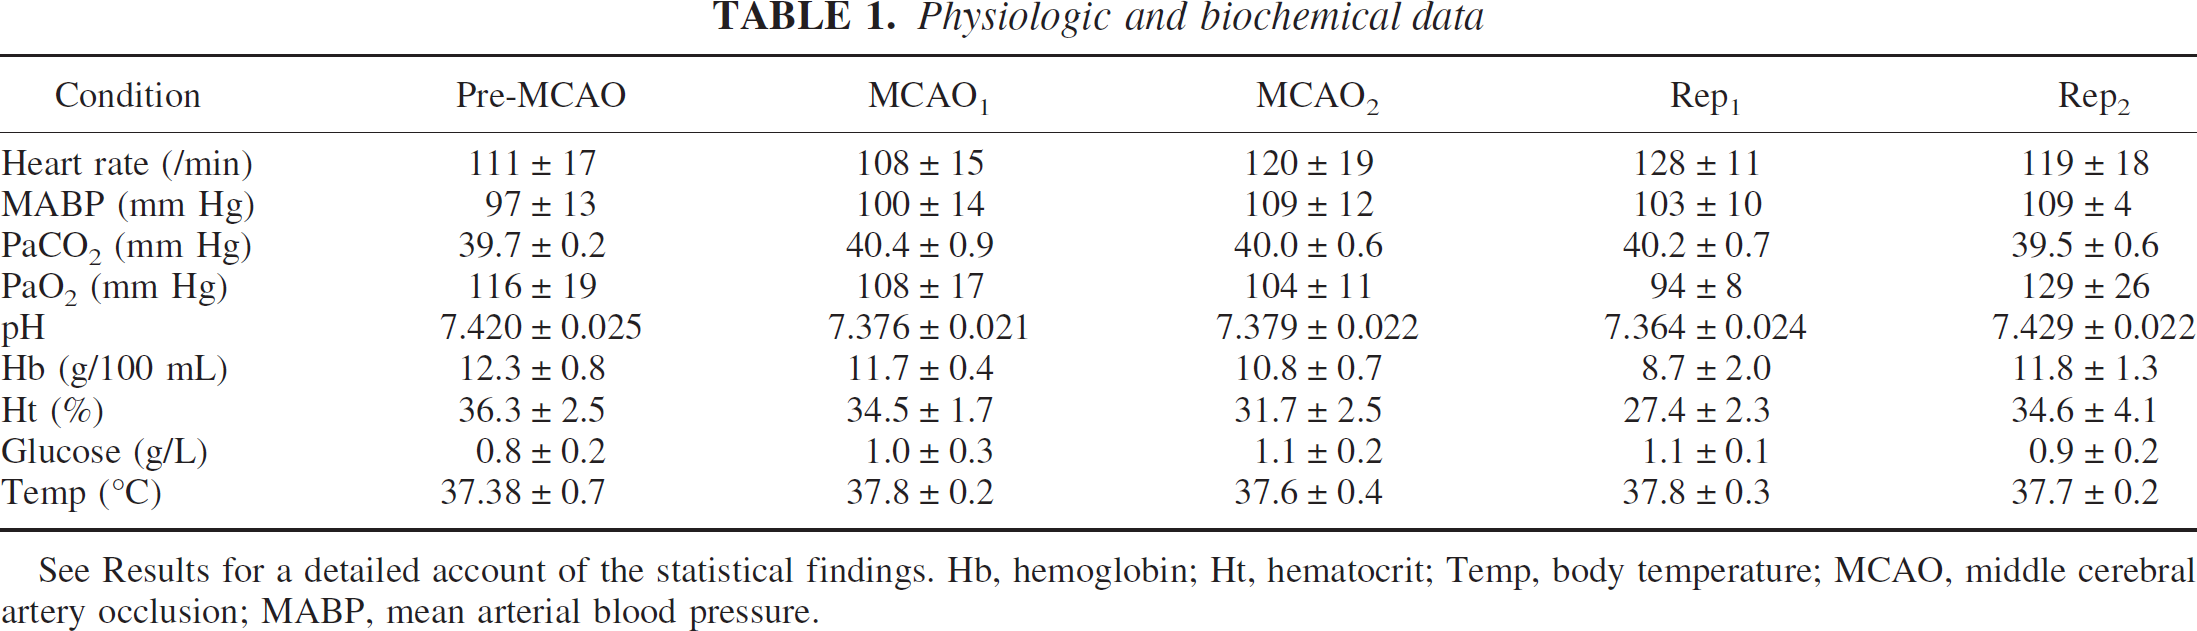
See Results for a detailed account of the statistical findings. Hb, hemoglobin; Ht, hematocrit; Temp, body temperature; MCAO, middle cerebral artery occlusion; MABP, mean arterial blood pressure.
The heart rate (HR) decreased from Pre-MCAO to MCAO1, then increased to reach its maximum at Rep1.
The mean arterial blood pressure (MABP) increased from Pre-MCAO to MCAO2, decreased at Rep1 and increased again at Rep2.
The PaCO2 showed an increase from Per-MCAO to Rep1, and then decreased to Rep2.
The PaO2 decreased continuously from Pre-MCAO to Rep1, and increased at Rep2.
The pH decreased from Pre-MCAO to Rep1, and recovered a normal value at Rep2.
The hemoglobin (Hb) continuously decreased from Pre-MCAO to Rep1 and then regained a normal value at Rep2.
The hematocrit followed the same evolution as the Hb.
Neurologic outcome
All five baboons recovered consciousness within 20 minutes after etomidate was discontinued. Left hemiparesis was observed in all animals, involving both lower and upper limbs. Excessive turning of head, shoulders, and eye to the right was also observed. Neurologic recovery was readily discernible within 1 week, where all animals regained normal mobility of their lower limb. Recovery of upper limb function took place during week 2 but was variable from animal to animal. Before euthanasia, all animals still exhibited a substantial motor impairment of the left hand.
Size and topographic distribution of regions of interest
The infarct ROI involved the basal ganglia and internal capsule area in all animals and extended into the external capsule in V1 and in the insular area in V5.
The highest OEF ROI involved the deep MCA territory in all animals, except in V2, and the cortical MCA area (in a patchy fashion) in all animals except V4 (Fig. 3). The ROI volumes are shown in Table 2.
Volume and percentage volume of the ROIs and voxel subpopulations
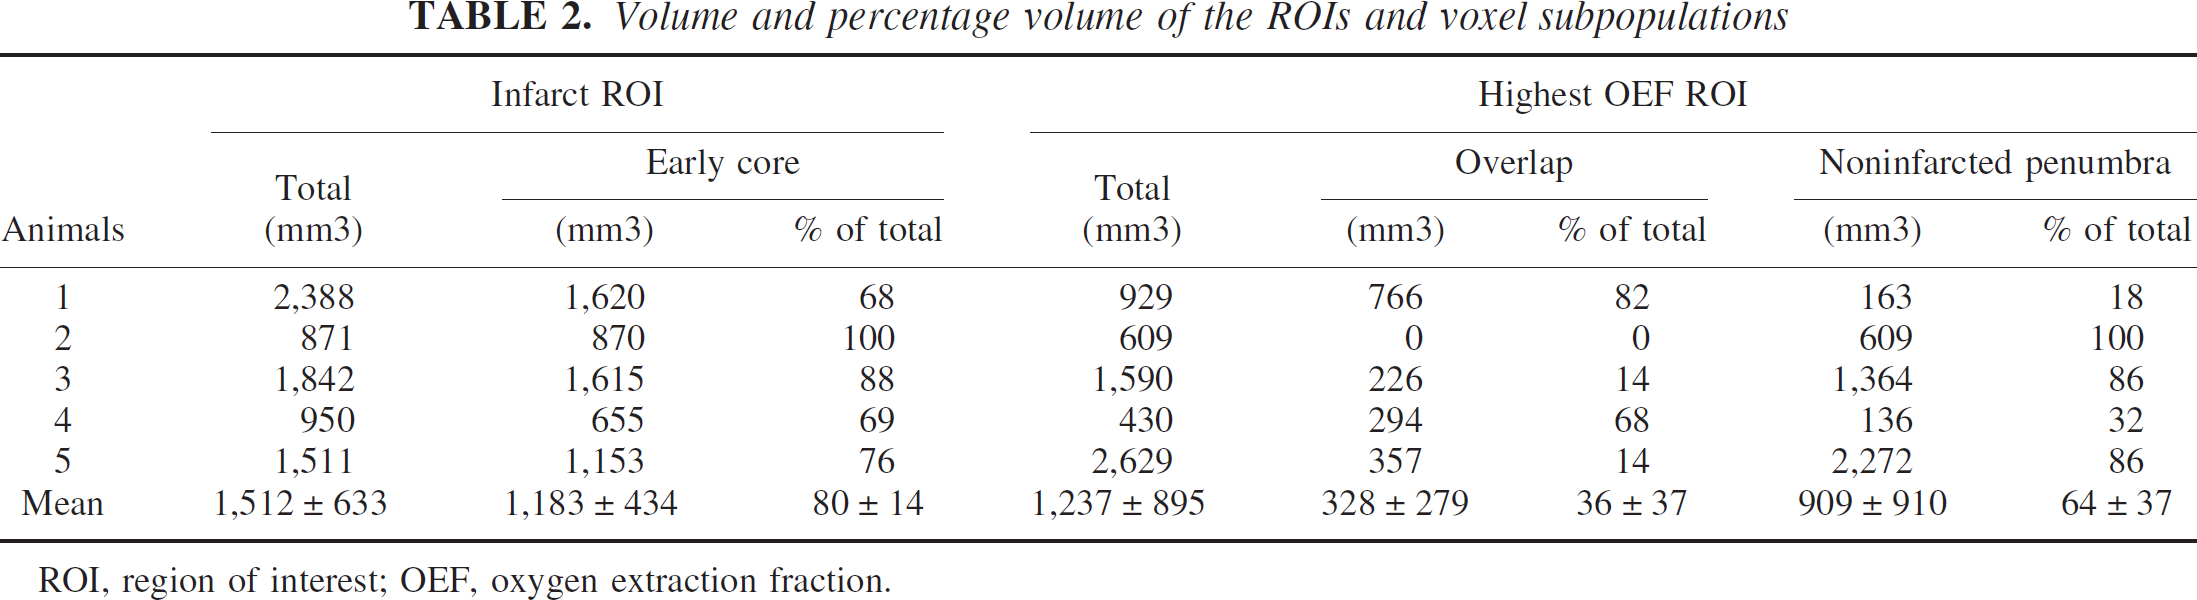
ROI, region of interest; OEF, oxygen extraction fraction.
Overlap
An overlap between the infarct and highest OEF ROIs was present in 4 of 5 animals (all except V2) (Fig. 3 and Table 2). The overlap almost exclusively concerned the deep MCA area. The volume of the overlap region was 0.33 ± 0.28 mL (N = 4), accounting on average for 36% of the highest OEF ROI (range 0%–82%) and 20% of the infarct ROI (range 0%–32%).
Time course of the positron emission tomography variables within the three subpopulations
Tables 3, 4, and 5 show for each voxel subpopulation the mean (± 1 SD) absolute CBF, OEF, and CMRO2 values for the occluded and nonoccluded sides. Statistically significant differences in the prespecified side-to-side comparisons are also displayed in this table. Figures 46 display the individual lesioned/contralateral ratios for each voxel subpopulation and each PET variable and also show the results of the prespecified statistical analysis of the time course of PET variables within each voxel subpopulation. Table 6 shows the mean (± 1 SD) lesioned/contralateral ratios for each voxel subpopulation at each time-point.
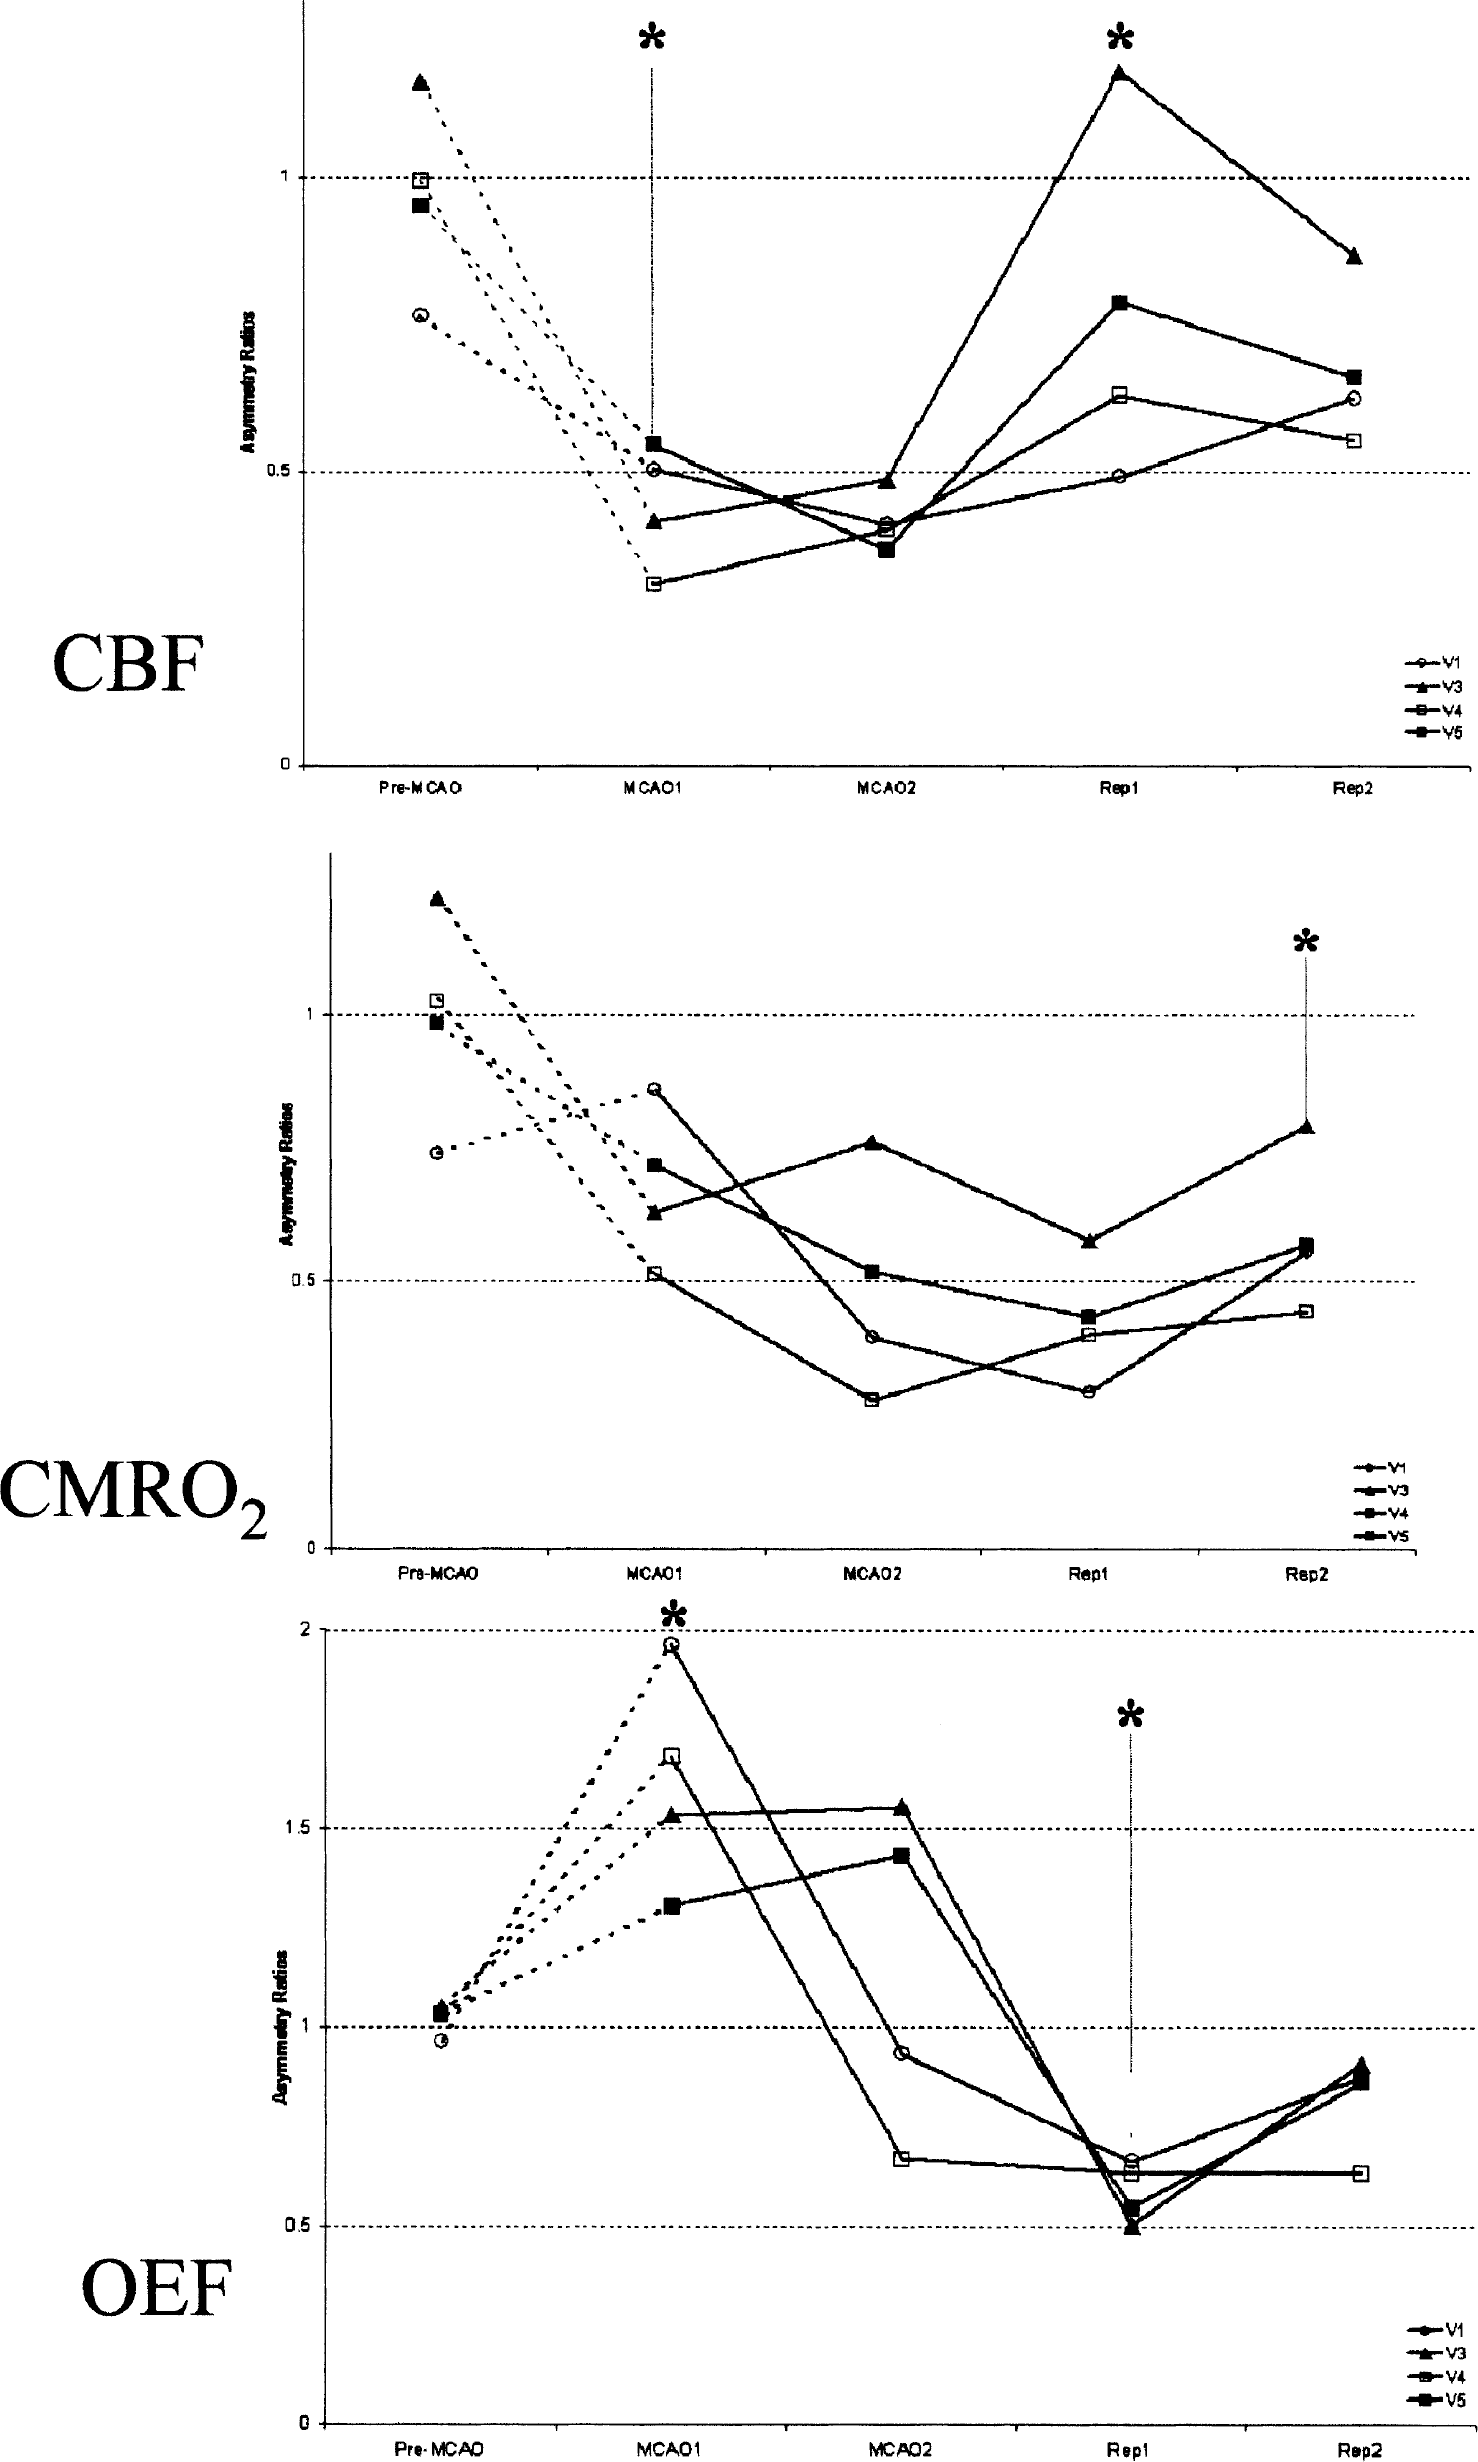
Time course of the individual CBF, CMRO2, and OEF ratios (lesioned/contralateral) for the Early Core (see Fig. 1 for illustration of this subregion). *Statistically significant difference in PET ratio between a particular time point and its immediate predecessor; **Highly significant difference (see Methods for details). CBF, cerebral blood flow; CMRO2, cerebral oxygen metabolism; OEF, oxygen extraction fraction; PET, positron emission tomography.
Absolute values for Early Core
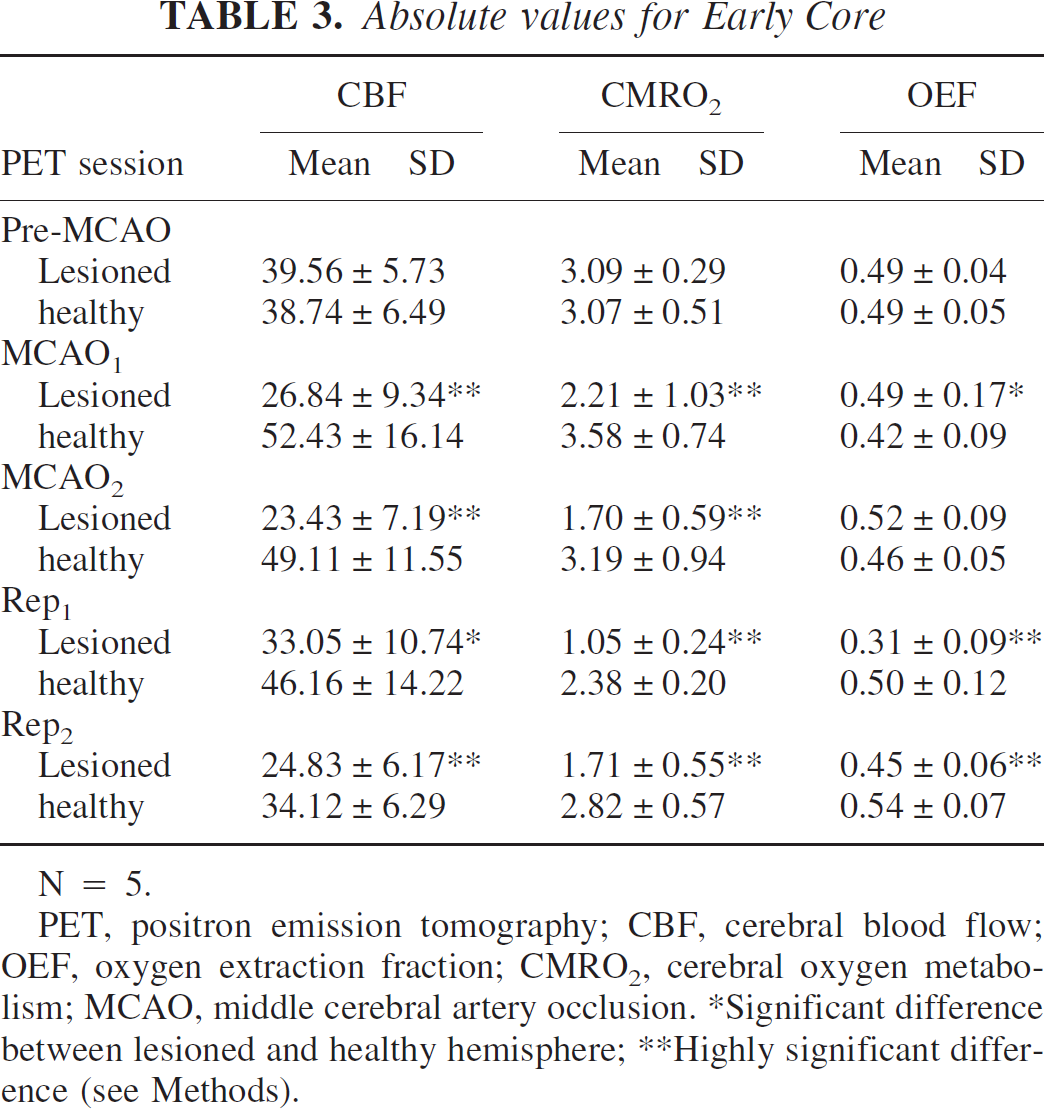
N = 5.
PET, positron emission tomography; CBF, cerebral blood flow; OEF, oxygen extraction fraction; CMRO2, cerebral oxygen metabolism; MCAO, middle cerebral artery occlusion.
Significant difference between lesioned and healthy hemisphere;
Highly significant difference (see Methods).
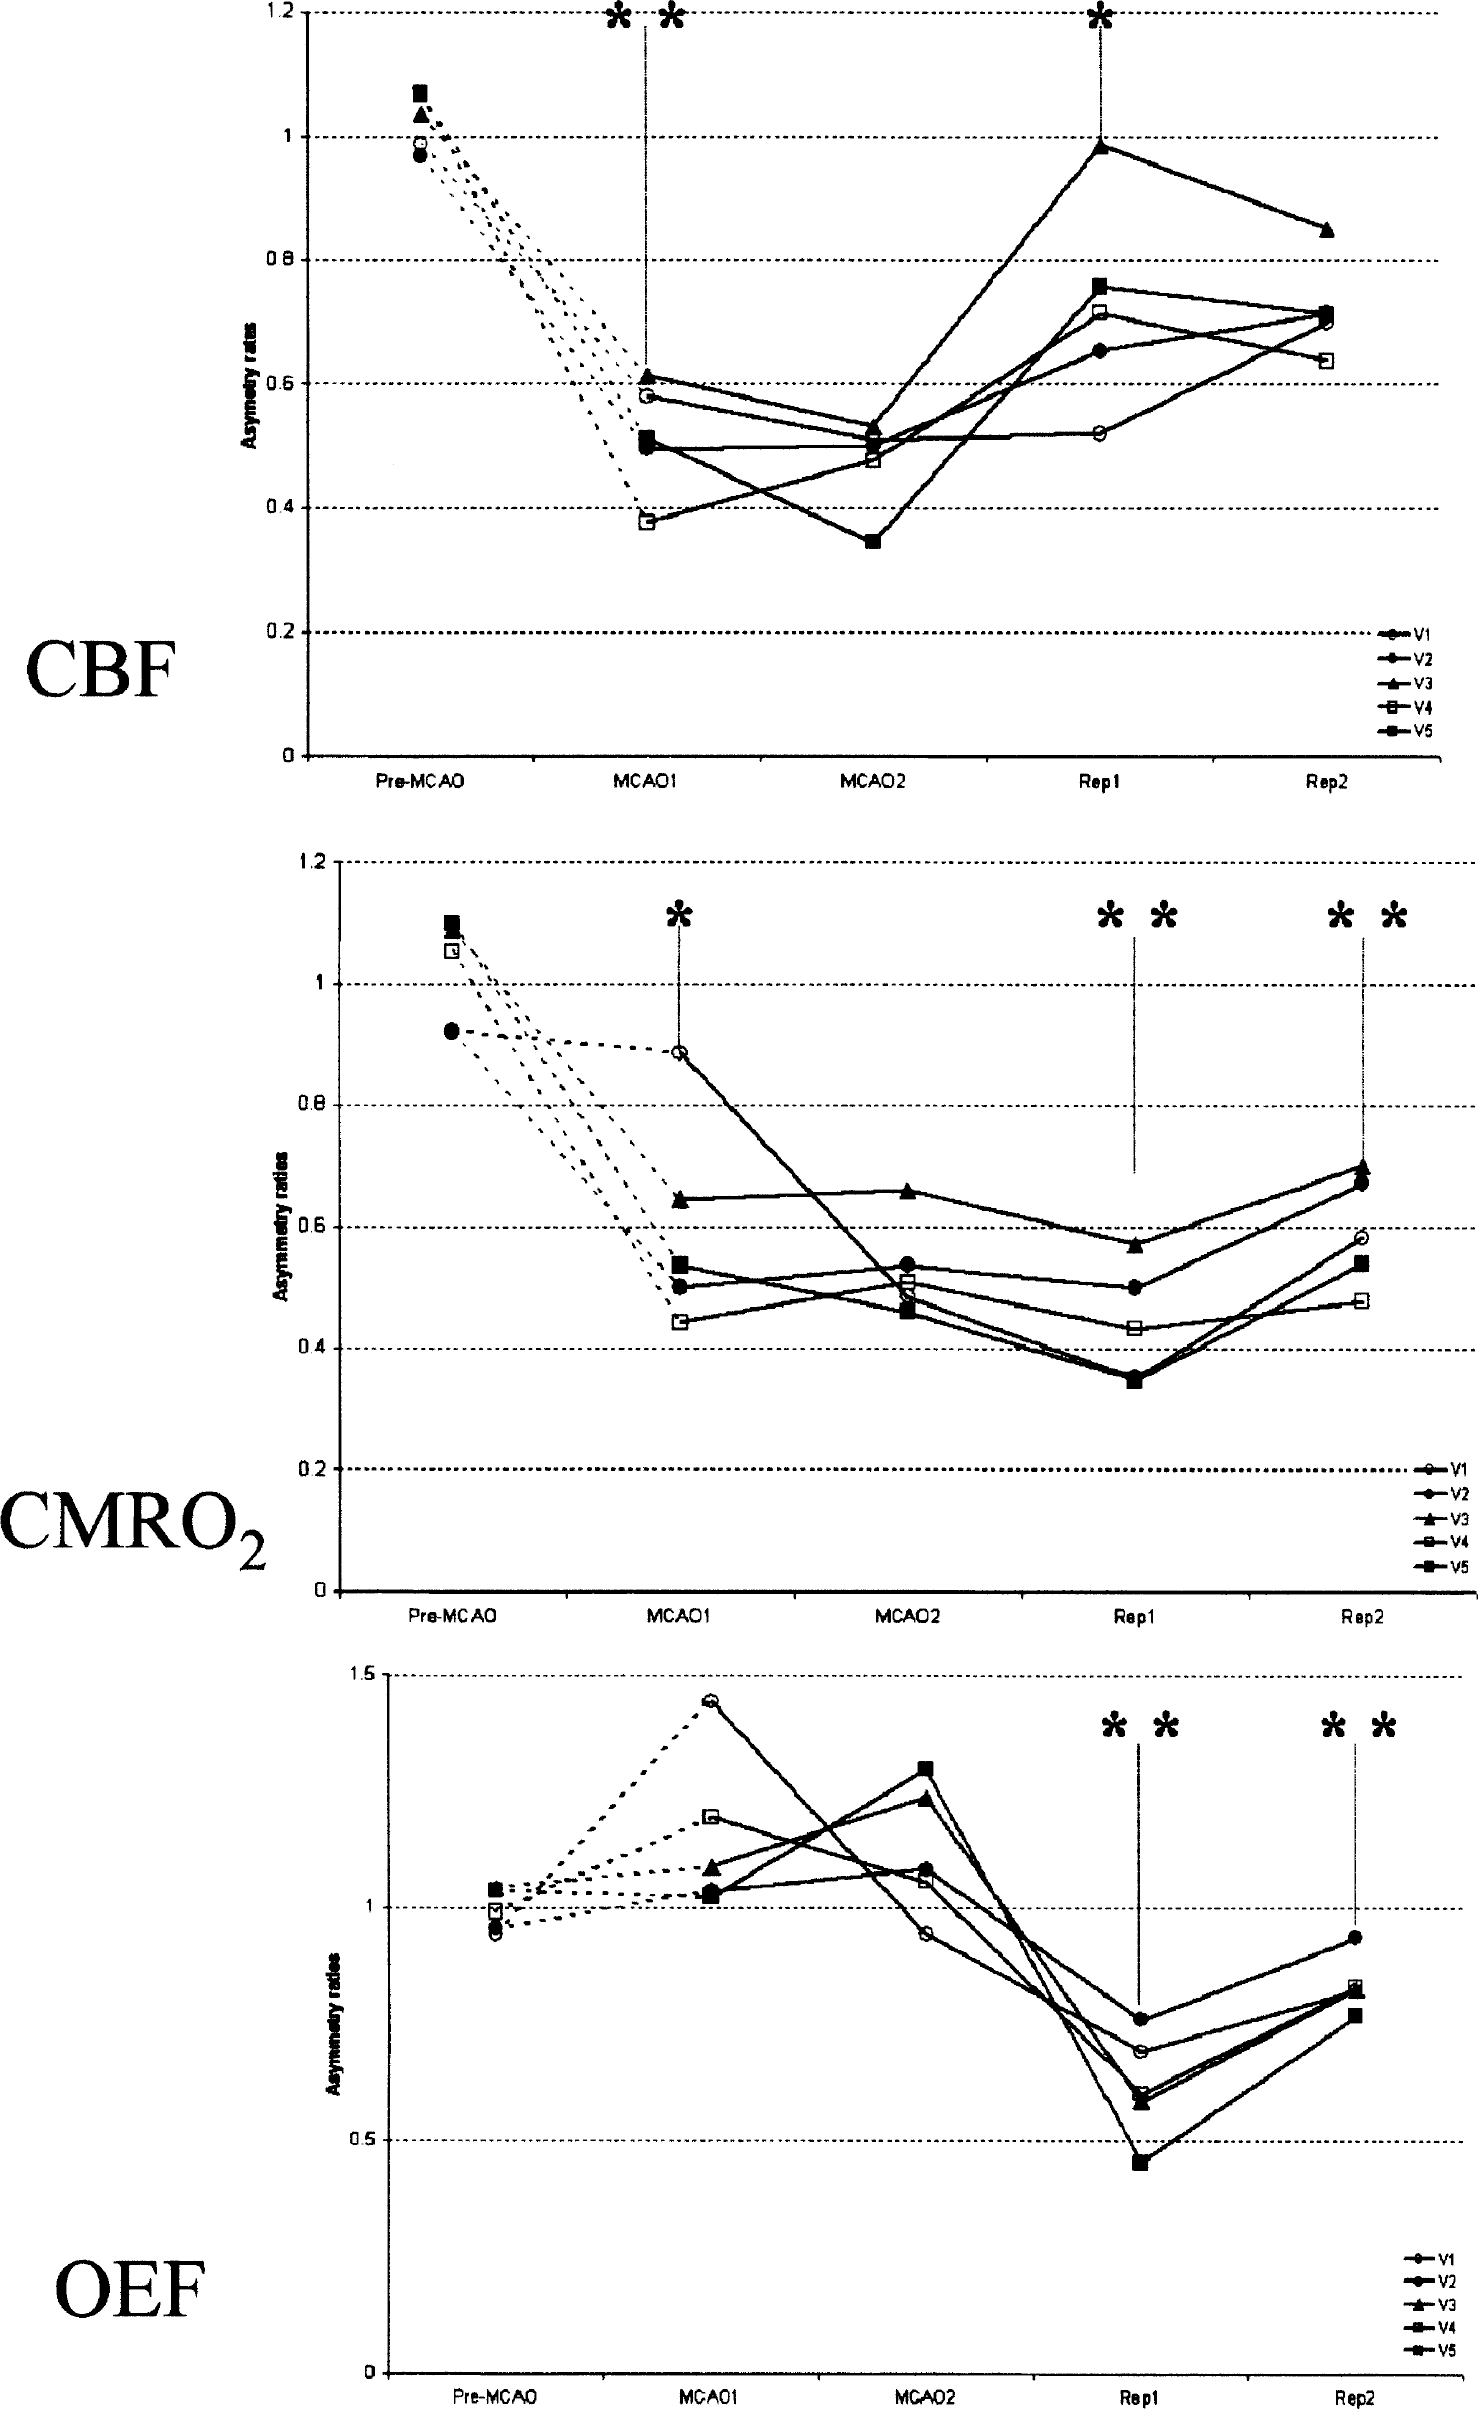
Absolute values for Noninfarcted Penumbra
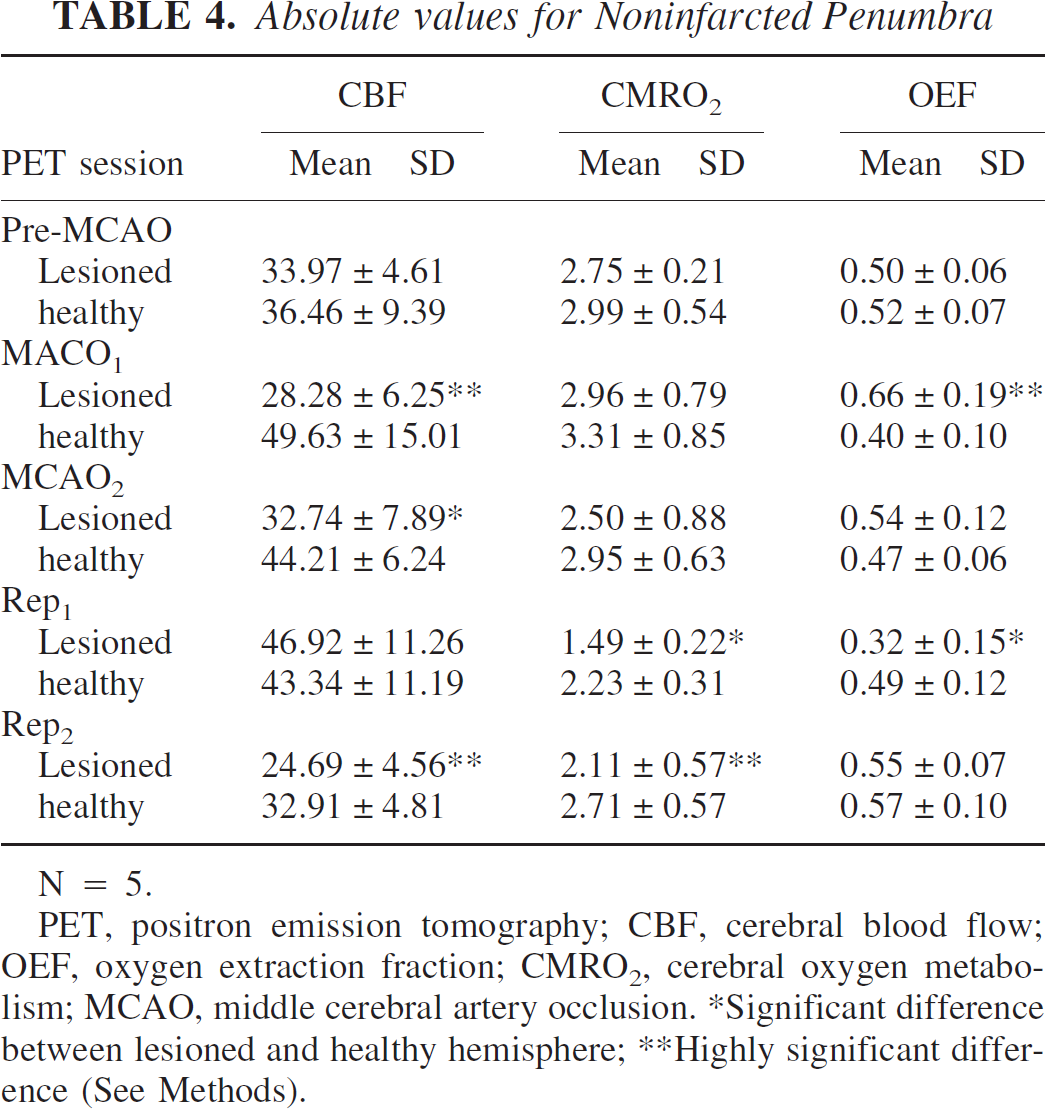
N = 5.
PET, positron emission tomography; CBF, cerebral blood flow; OEF, oxygen extraction fraction; CMRO2, cerebral oxygen metabolism; MCAO, middle cerebral artery occlusion.
Significant difference between lesioned and healthy hemisphere;
Highly significant difference (See Methods).
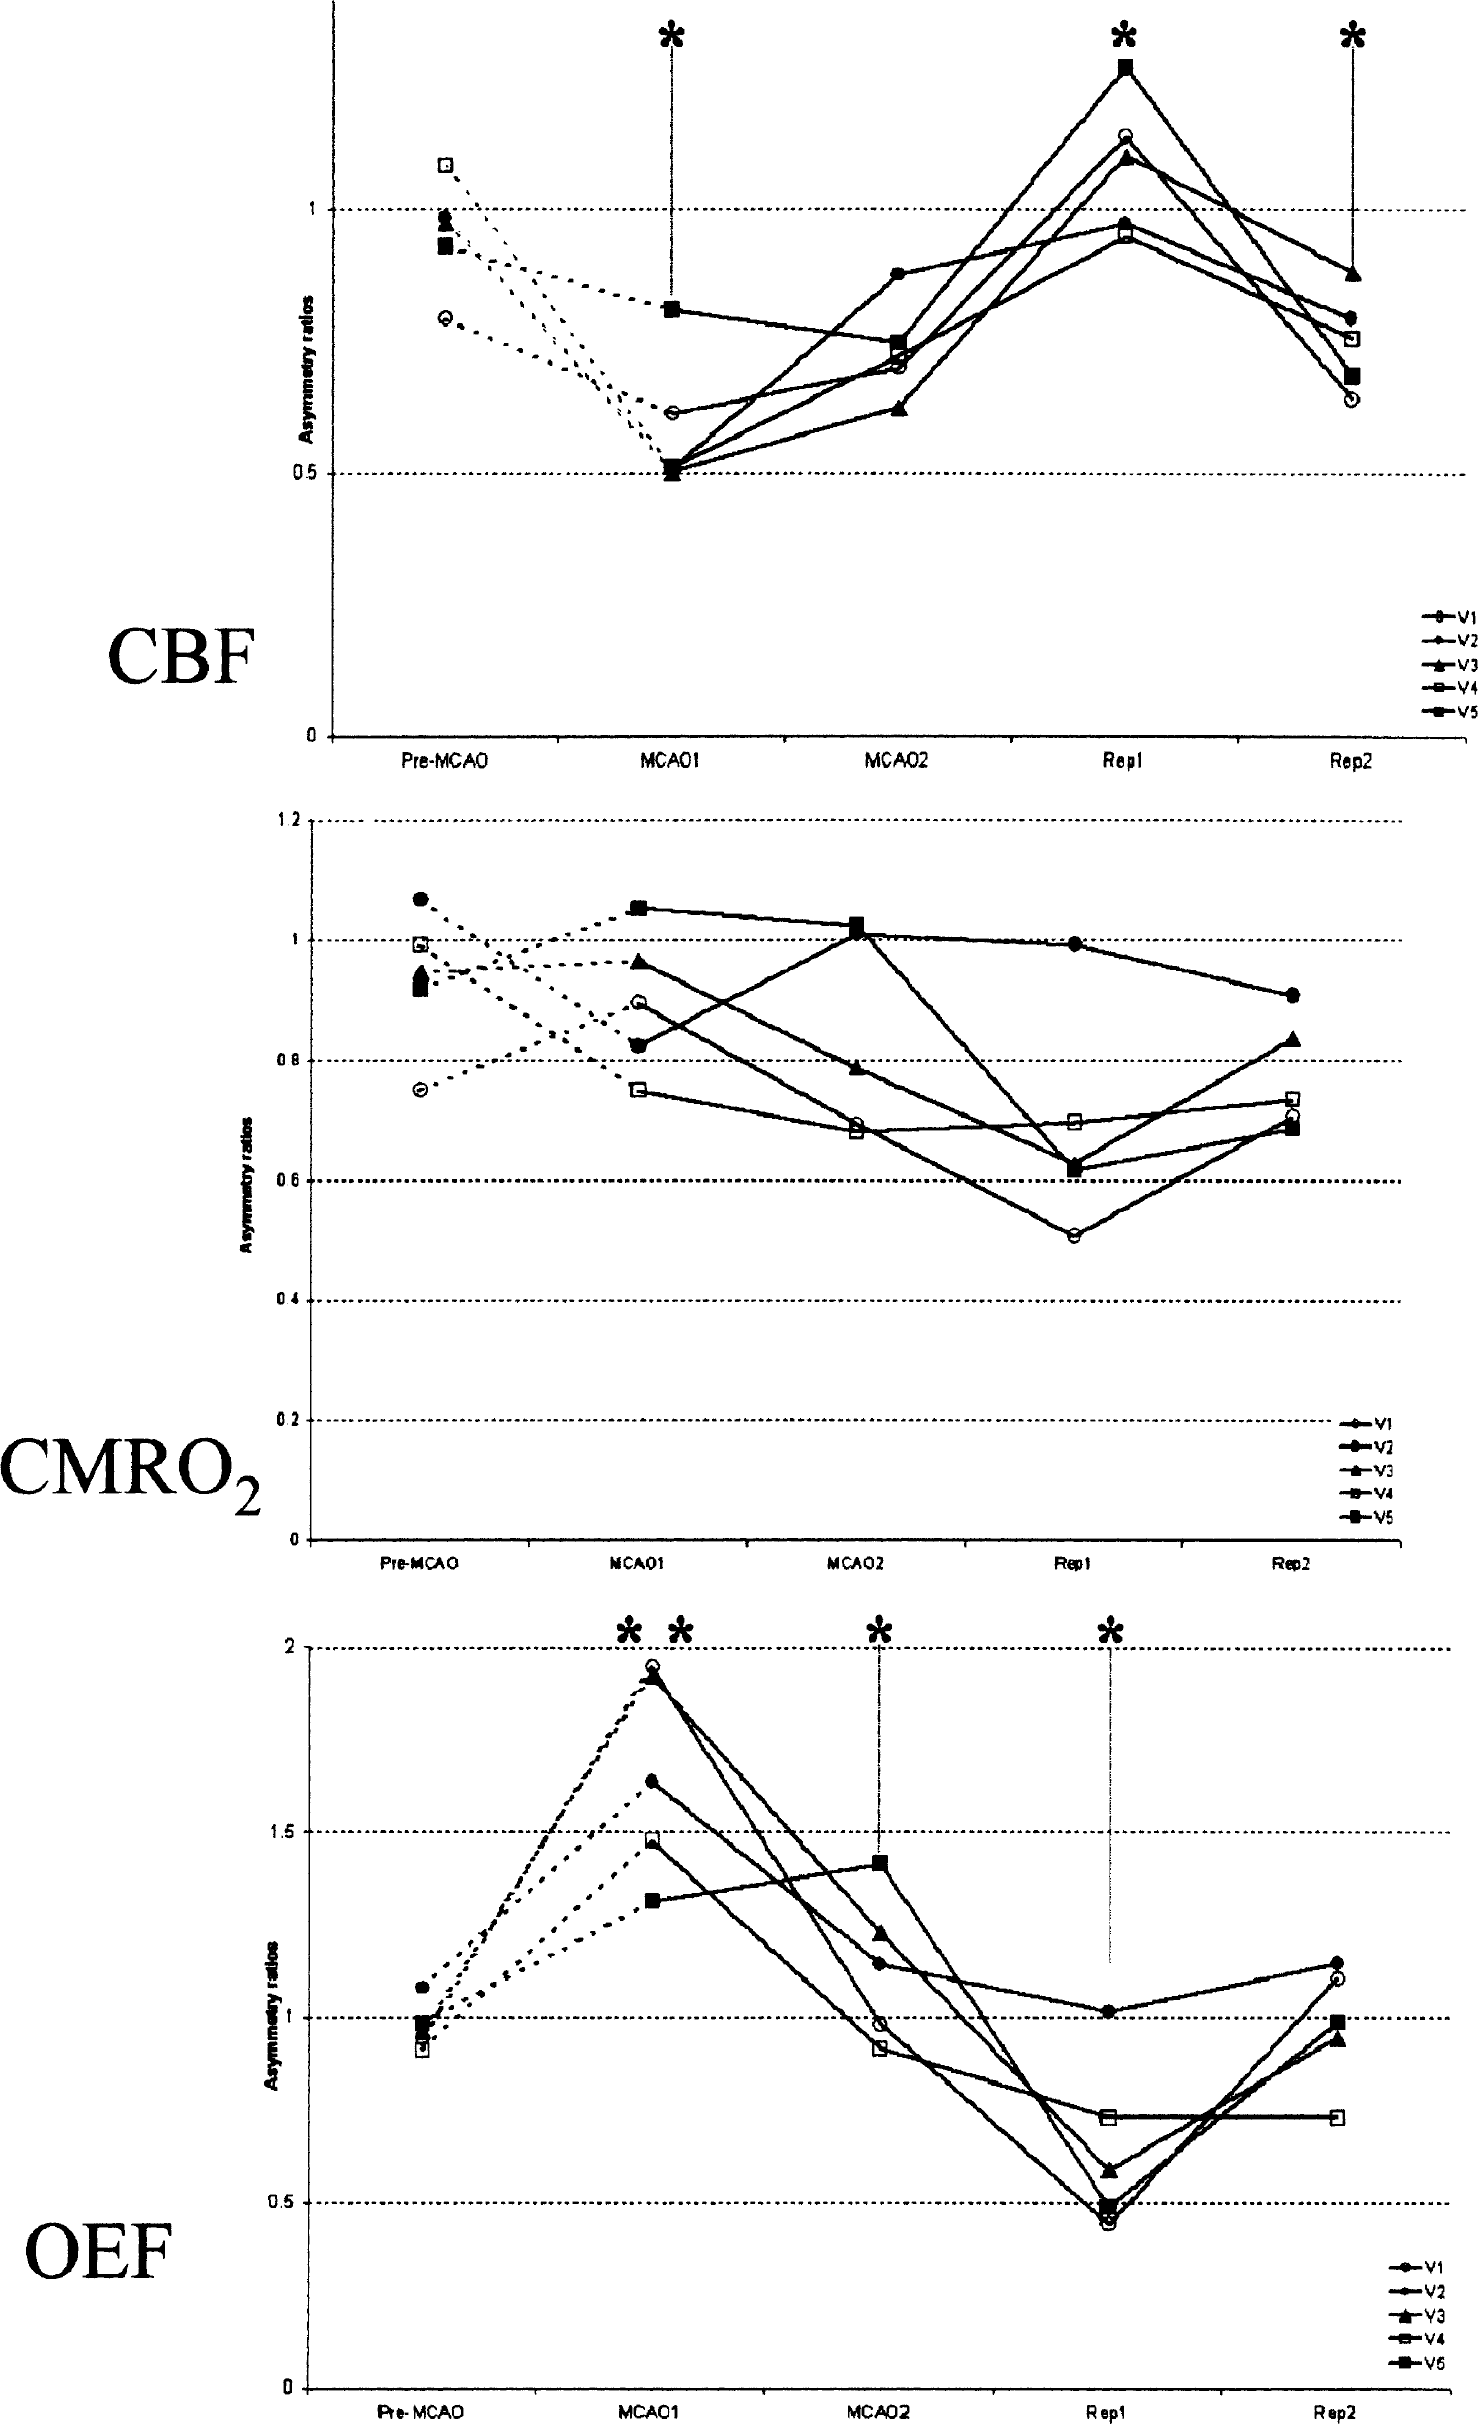
Absolute values for Overlap
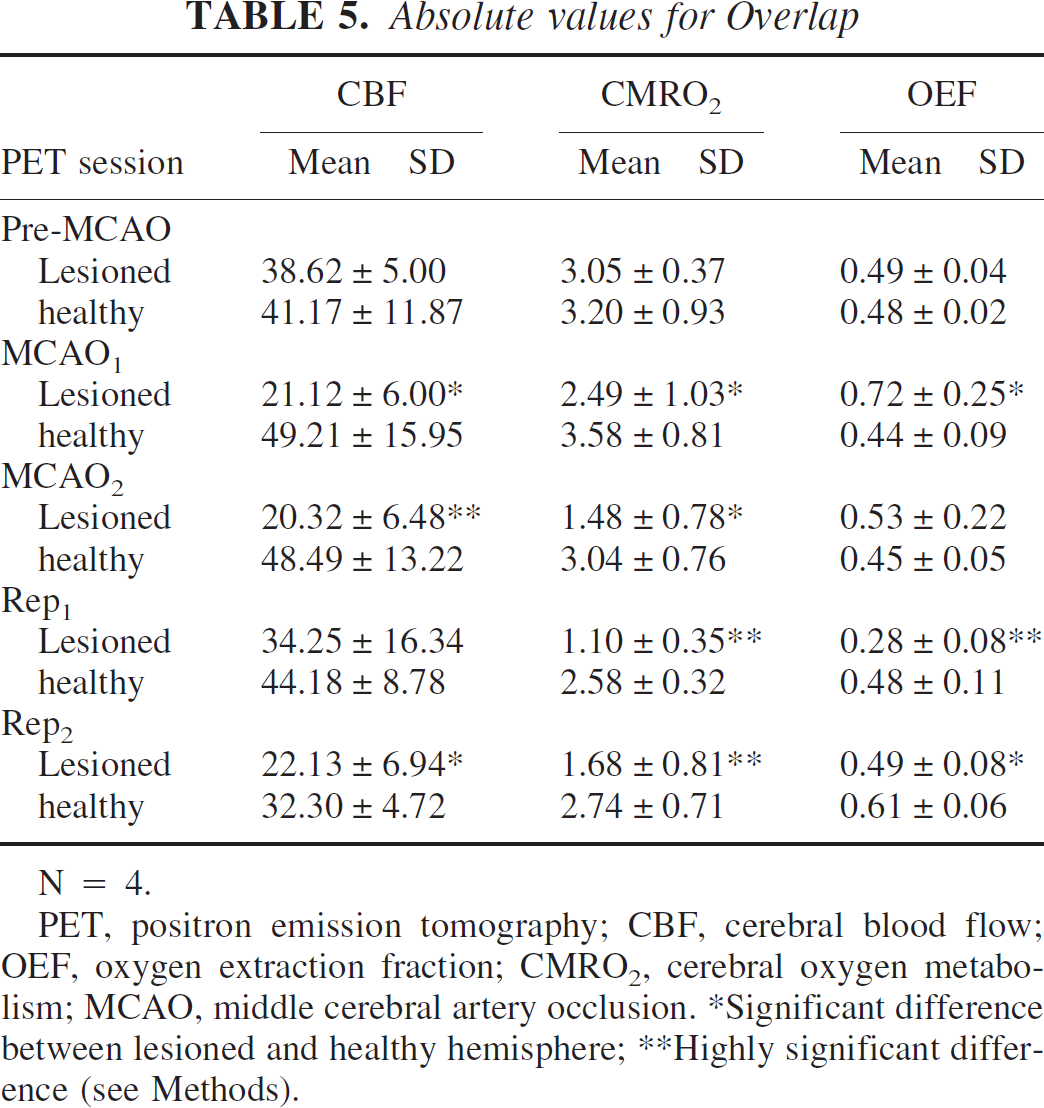
N = 4.
PET, positron emission tomography; CBF, cerebral blood flow; OEF, oxygen extraction fraction; CMRO2, cerebral oxygen metabolism; MCAO, middle cerebral artery occlusion.
Significant difference between lesioned and healthy hemisphere;
Highly significant difference (see Methods).
Comparison of the ratios (lesioned/contralateral) among the three voxel subpopulations
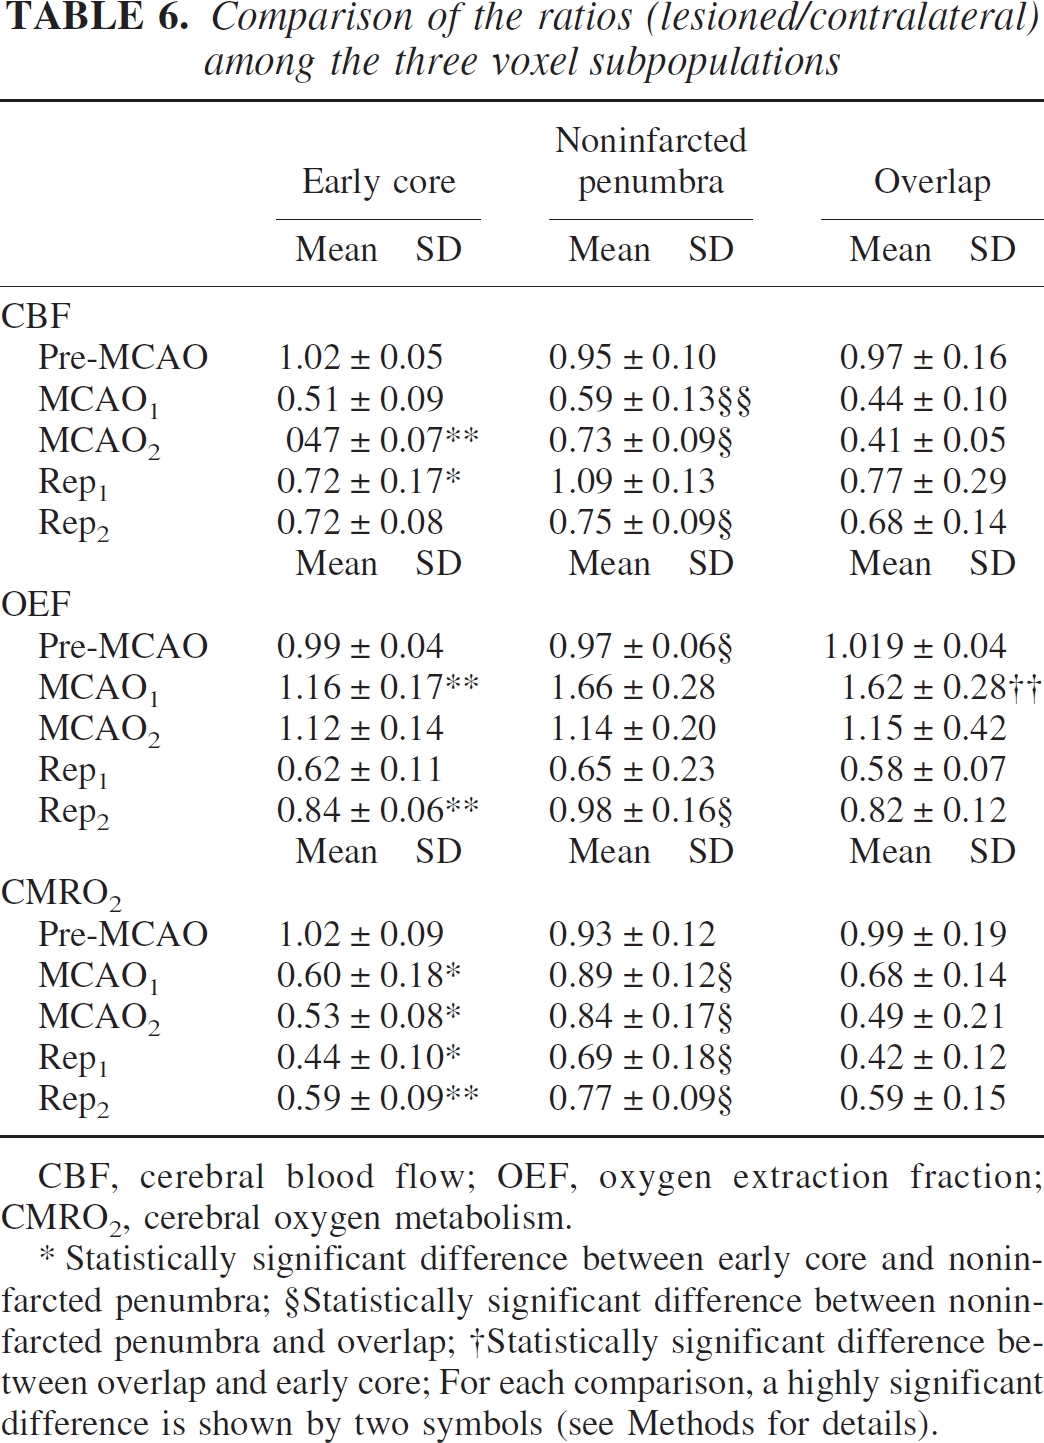
CBF, cerebral blood flow; OEF, oxygen extraction fraction; CMRO2, cerebral oxygen metabolism.
Statistically significant difference between early core and noninfarcted penumbra;
Statistically significant difference between noninfarcted penumbra and overlap;
Statistically significant difference between overlap and early core; For each comparison, a highly significant difference is shown by two symbols (see Methods for details).
A brief summary of the main findings, integrating the detailed information presented in Tables 3–6 and Figs. 46 is given below.
Early Core (N = 5).
At MCAO1, there was a highly significant decrease in CBF and CMRO2 with a mildly significant increase in OEF.
Subsequently, the CBF remained low until reperfusion, after which it increased significantly, although it remained reduced. This was followed by a secondary CBF decrease (note also a CBF reduction in the contralateral ROI).
The CMRO2 was affected by a continuous and significant striking decrease uninfluenced by reperfusion, whereas a moderate but significant rise was noted at Rep2.
The OEF remained mildly elevated until reperfusion, at which point it dramatically fell. Thereafter, it significantly increased, although it remained lower than normal at Rep2.
Noninfarcted Penumbra (N = 5).
At MCAO1, there was a significant decrease in CBF together with the expected increase in OEF, but the CMRO2 remained unchanged.
Subsequently, the CBF increased (with a significant decline in the OEF) even before reperfusion, after which it significantly rose to reach values higher than the contralateral area (although not significantly so), together with a significant reduction in OEF.
The CMRO2 remained essentially normal and was stable until after reperfusion, at which point it was significantly decreased (with a similar trend for the contralateral ROI).
In the chronic stage, there was a matched moderate reduction in CBF and CMRO2, with normal OEF.
Overlap (n = 4).
At MCAO1, there was significant reduction in CBF and the expected increase in OEF, with a significant though mild decrease in CMRO2.
Subsequently, the CBF remained very low until reperfusion where it significantly increased though remained lower than the contralateral ROI in 3 of 4 baboons. In the chronic stage, the CBF was again significantly reduced (note a CBF reduction also in the contralateral ROI).
The CMRO2 further decreased before reperfusion in most animals, with a variably increased OEF. After reperfusion, there was a further decrease in CMRO2, together with a significant drop in OEF. In the chronic stage, the CMRO2 significantly increased but remained significantly lower than the contralateral side, with a still mildly reduced OEF.
Comparison of the positron emission tomography variables among the voxel subpopulations
Table 6 shows the mean (± 1 SD) lesioned/contralateral ratios at each time point and for each voxel subpopulation, as well as the results of the pre-specified statistical comparisons between pairs of voxel subpopulations.
According to the aim of this study (see Introduction), the main comparison was that between the two components of the highest OEF ROI, namely the Overlap and the Noninfarcted Penumbra. There were several significant differences between these two areas; especially both CBF and CMRO2 were significantly lower in the Overlap than in the Noninfarcted Penumbra at MCAO1. Similar differences persisted at the MCAO2 study. After reperfusion, there was no difference in CBF between the two subpopulations, but the CMRO2 remained significantly lower in the Overlap. In the chronic stage, both the CBF and the CMRO2 were lower, with a marginally significantly reduced OE in the Overlap. These findings were corroborated by the ANOVA, which showed significant Time and Group effects with significant interaction for both CBF and CMRO2, whereas there was only a Time effect for the OEF.
Regarding the comparison between the Overlap and the Early Core, the only difference that reached the cutoff for significance was the expected higher OEF in the former at MCAO1. Accordingly, the ANOVAs showed a significant group effect only for the OEF, with a significant Time x Group interaction.
Finally, the comparison between the Noninfarcted Penumbra and the Early Core showed many significant, including several highly significant, differences. The CBF was not different at MCAO1 but became significantly lower in the Early Core at the two subsequent time-points. The CMRO2 was significantly lower at all time points in the early core. In the chronic stage, both the OEF and the CMRO2, but not the CBF, were significantly lower in the Early Core. These findings were corroborated by the ANOVAs, which showed significant Time and Group effects with significant interactions for all three PET variables.
DISCUSSION
In agreement with our working hypothesis (see Introduction), our main finding documents that, in contrast with the 6-hour MCAO model, a 20-hour MCAO in our baboon focal stroke model resulted in the recruitment of part of the initial highest OEF area into the final MRI-defined infarct. This overlap therefore represents that tissue potentially salvageable by efficient reperfusion if the latter is induced between 6 and 20 hours after occlusion. The second main finding was that there were significant differences in both CBF and CMRO2 from the earliest time-point between the component of the highest OEF ROI that evolved to infarction (i.e., the overlap) and that which did not (i.e., the noninfarcted penumbra). Two striking differences emerged: 1) the CBF and CMRO2 were significantly lower at MCAO1 in the former, indicating the presence of a more severe ischemia; and 2) at MCAO2 the CBF tended to increase (with preserved CMRO2) in the latter, contrasting with a stable CBF and a further decrease in CMRO2 in the former, suggestive of a spontaneous partial reperfusion of the noninfarcted penumbra despite persistent occlusion. Overall, therefore, our data show that the fate of the at-risk tissue after MCAO is predicated not only by the duration of the occlusion and the initial severity of the ischemia, in agreement with classic primate studies (Garcia et al., 1983; Jones et al., 1981), but also by early subsequent events, more specifically spontaneous partial reperfusion. In addition to these two main findings, the intriguing observation that, even with very long-lasting occlusion, not all of the highest OEF tissue was recruited in the final infarction will also be discussed in this section.
The main finding from the present study is that the extent of the high OEF tissue that evolves to infarction depends upon the duration of the occlusion. Thus, in the 6-hour MCAO study, none of the highest OEF tissue evolved to infarction (Young et al., 1996), whereas this occurred in most subjects with a 20-hour occlusion. Effectively, four of five animals exhibited an overlap, whereas in the 6-hour MCAO study, no overlap was observed in the six baboons with infarction, and no infarct developed in the remaining five animals (despite high OEF). This difference in evolution to infarction of the highest OEF area between the two studies is statistically significant (P = 0.015, Fisher's exact test). Also, six of eleven animals were found to have unquestionable infarction at MRI in the 6-hour MCAO study, whereas five of five did so in the present study (P = 0.10, Fisher's exact test). Consistent with those observations from imaging, the histologic infarct was significantly smaller with the 6-hour than the 20-hour MCAO (Giffard et al., submitted).
Regarding topography, the highest OEF area was mainly located over the MCA cortical territory (with multiple disjointed islands) in three baboons (V2, V3, and V5), whereas it was mainly subcortical, in the deep MCA territory, in the remaining two (V1 and V4) (Fig. 3). These differences would explain why the three animals of the former category exhibited the lowest percentage of overlap (Table 2). It is indeed well-established (Astrup et al., 1981; Siesjo, 1992) that, after MCAO, the cortical territory has better collateral blood supply than the deep MCA territory, affording the cortex the capacity to survive a longer occlusion.
The second major finding from this study is the striking difference, already present at MCAO1 and further accentuated at MCAO2, in the physiologic status between the two highest OEF subpopulations, namely that which will evolve to infarction and that which will not. Although both populations exhibited a marked decrease in CBF and a moderate decline in CMRO2, the overlap sustained a significantly greater decrease in both variables than the noninfarcted penumbra already at MCAO1. At MCAO2, both the CMRO2 and the CBF further declined in the overlap, whereas in the noninfarcted penumbra the CBF tended to return towards normality, and the CMRO2 was stable with still significant differences between the two voxel subpopulations. These findings suggest that the ultimate fate of the penumbra depends not only upon the initial severity of the ischemia but apparently also upon subsequent events such as, in this case, spontaneous partial tissue reperfusion. This may have occurred here as a result of development of collaterals as is classically surmised but likely also from subtle changes in local hemodynamic and systemic physiology. Whatever the mechanism, these observations suggest that even mild secondary changes in local perfusion may tilt the balance of outcome of the at-risk tissue one way or the other, a notion which has obvious clinical implications.
To compare the fate of the region with initially highest OEF between the 6-hour (Young et al., 1996) and the present 20-hour MCAO study, the method for delineating the highest OEF ROI was adapted to take into account the difference in PET device and image characteristics (see Methods). Effectively, there was no significant difference in the volume of the highest OEF ROI between the two studies (P > 0.05, Student's t-test). Thus the MCAO induced a similar acute pathophysiology in both studies, which can therefore be safely compared in terms of fate of the penumbra. Although the two studies were identical with respect to the experimental protocol, changes in some biochemical and physiologic variables occurred in the present study, which reflected the unavoidably longer periods of anesthesia and repeated PET studies with blood sampling in less than 24 hours. Although statistically significant with repeated-measures ANOVAs, these changes were moderate in magnitude and should not have influenced the main findings. Regarding specifically the changes in hemoglobin, only negligible effects on the quantification of PET measures, if any, would be expected because all the blood data necessary for the measurement of CBF and CMRO2 were measured at each PET session.
One well-known constraint of PET is the limited spatial resolution, which results in partial volume effects (PVE). Even though we used a fourth-generation high-resolution PET device (see Methods), this remains inadequate relative to the size of the baboon's brain structures, which is often in the few millimeters range. Apart from the PVE, two additional effects impacted on the PET measurements: the long physical range of the positron emitter 15O (∼2 mm), and the diffusion of labeled water between physiologic tissue compartments (Baron et al., 1989; Pappata et al., 1993). All these combined effects will result in acutely low CBF being overestimated due to “spilling in” from surrounding areas with higher CBF, and this will be particularly marked for small “comma-shaped” voxel clusters such as observed here for the Early Core and Overlap. These effects in turn account for the CBF values in the ischemic compartment being higher than the classic penumbra literature based upon local perfusion measured with implanted tissue probes (Astrup et al., 1981; Garcia et al., 1983). For instance, neither the Early Core nor the Overlap had CBF values below the classic penumbra threshold of approximately 20 mL/100g/min−1, although both fell very close. This issue has been already addressed extensively in previous baboon PET studies using second and third generation devices (Pappata et al., 1993; Young et al., 1996). Nonetheless, despite these limitations (Baron et al., 1989), the steady-state 15O model remains the most suitable and accurate PET model for studying the ischemic tissue. Likewise, these effects should not detract from using the voxel-based approach, which is the most appropriate and objective for studying the heterogeneous process of cerebral ischemia.
Potential effects from the anesthetic regimen used on the measured variables should also be considered. The only anesthetic agent used during PET data acquisition was etomidate. Previous studies that have tested the effects of this agent on CBF or CMRO2 have reported marked decreases in both variables (in the 35% to 50% range) in animals (Davis et al., 1986; Frizzell et al., 1991; Milde et al., 1985) as well as in humans (Renou et al., 1978), but all used many-fold higher doses than reported here. The single study performed in the baboon and using the same regimen of etomidate reported a smaller though clear decrease in the cerebral metabolic rate of glucose (Miyazawa et al., 1993). It is therefore expected that the anesthetic regimen used here will have resulted in global though moderate reductions in both CBF and CMRO2, with possibly some neuroprotective effects (Touzani et al., 1995). However, there is no alternative to the use of substantial anesthesia for this type of experiment, and our choice of etomidate was guided by its lack of direct cerebrovascular effects (which can be a confound when studying cerebral ischemia).
The already mentioned observation of milder reductions in CBF here than reported in similar PET experiments in cats, which used halothane (Heiss et al., 1997), as well as in awake patients with acute stroke (Heiss et al., 1998) may in part result from these effects of etomidate on baseline CBF and CMRO2. Other potentially contributing factors are the vascular architecture of the baboon (which has a fully developed Circle of Willis) and the fact that we used young adults.
One may argue that in this study the infarct ROI was drawn manually, which may lack objectivity and hence affect the overall results. However, there is no validated method to automatically outline the infarcted area on MRI because of the irregular, anfractuous contours of most infarcts and the heterogeneity of the infarcted tissue, which may include variable water and lipid contents, inflammatory cell infiltration, and red cell leakage, defying any unitary MR description. To assess the interoperator reliability of the infarct ROI definition, a second set of ROIs was drawn by an independent operator (J-CB) who was blind to the first set. There were no significant systematic differences in ROI surface between the two operators (P = 0.68, N = 5, Wilcoxon rank test), with an average overlap of 75% (range 54%–94%) between the two sets. It is of importance that there was no change in the main result from this work; namely, the overlap between the highest OEF and infarct ROIs found in four of five animals was independent of the set of infarct ROIs used.
One particularly important feature of our study is that it allows an individual analysis of the events that followed MCAO and reperfusion. Thus scrutiny of Figs. 46 illustrates some interesting individual differences. For instance, the OEF ratio for the Overlap (Tables 3–6) showed a different behavior at MCAO2 between animals V1 and V4 versus V3 and V5, with a sharp fall in the former but a stable high OEF in the latter. This can be explained by the topography of the ROIs (Fig. 3), as in V3 and V5, the Overlap was mainly cortical (and patchy), whereas in V1 and V4 it was mainly located in the deep part of the MCAO territory. This would be consistent with the fact that the demise of the penumbra occurs earlier in the latter area, whereas in humans it can linger for more than 12 hours in the cortex yet evolve to infarction eventually (Marchal et al., 1996; Wise et al., 1983a). This type of individually diverging behavior of PET variables explains some of the marginal statistical findings in this limited-sample study (especially for the Overlap with n = 4).
The percent fraction of the final MRI-defined infarct that overlapped with the highest OEF area at MCAO1 (i.e., the tissue potentially salvageable with reperfusion) was on average 20% (range 0%–31%) (Table 2). This may seem small, especially compared with studies in humans that show this fraction to be on average 35% to 45% and ranging up to 52% to 85% (Heiss et al., 2001; Marchal et al., 1996). However, to allow a comparison to Young et al. (1996), the analyzed brain cuts encompassed only the level of the basal ganglia, where early after occlusion the core is largest as compared with rostral levels.
In agreement with studies in humans (Furlan et al., 1996), this study documents that, in the baboon, the tissue that initially exhibits a very high OEF is not destined to evolve to infarction if efficient reperfusion is induced even as late as 20 hours post ictus. It is, however, intriguing that some high OEF tissue does not evolve to infarction despite such an extremely long MCAO. As discussed above, the at-risk tissue may escape infarction if spontaneous partial reperfusion occurs, or if the cascade of secondary events such as glutamate release from the core and depolarization waves spontaneously fades out.
After reperfusion, although the CBF increased in all three tissue categories, it increased most in the Noninfarcted Penumbra, reaching values higher than contralateral in three of five animals (Table 5). There were no differences in CBF between Noninfarcted Penumbra and Overlap subpopulations at this time-point (Table 6), whereas the Early Core displayed lower CBF and CMRO2 than both the contralateral region and the Noninfarcted Penumbra. This would be consistent with the observation that early hyperperfusion is a marker of good tissue outcome after spontaneous recanalization in humans (Marchal et al., 1999). In the Early Core and the Overlap, the CBF increase was much milder (except in V3 for the overlap), did not affect tissue outcome, and was followed by delayed hypoperfusion, as previously observed with respect to the core (Young et al., 1996). That reperfusion was incomplete may reflect partial blockade of capillaries by small thrombi and leukocyte adhesion after occlusion (Corbett et al., 1999; Mori et al., 1992), so-called “no reflow phenomenon.”
In the chronic stage, one interesting finding was the late increase in CMRO2 in the Overlap and Early Core (Tables 3 and 5), which most likely reflects infiltration of the necrotic tissue by inflammatory cells (Wise et al., 1983b). More surprising is the CMRO2 decrease (with matched CBF reduction) in the Noninfarcted Penumbra (Table 4), also present in the contralateral ROI. This has been previously noted in humans (Baron et al., 1996) and is thought to represent periinfarct neuronal loss from the temporary ischemic insult, disconnection effects in the infarct surroundings, or both (Iglesias et al., 2000).
CONCLUSION
This investigation for the first time to our knowledge documents that it is possible, though labor-intensive, to perform prolonged, temporary MCAO in the baboon. In the present era of thrombolysis for clinical stroke, this model allows studying the effects of delayed reperfusion. The main finding from this study is that, as predicted, at least part of the tissue early showing very high OEF is at risk of infarction between 6 and 20 hours after arterial occlusion. This further supports the notion that mapping the OEF in clinical stroke is important for selecting patients for therapy, even perhaps after the 3 to 6 hour window is closed. Another important observation from this work is that not only the severity of the initial ischemic insult but also early secondary events such as mild partial spontaneous reperfusion have a major influence on the eventual outcome of the at-risk tissue.
Footnotes
Acknowledgment
The authors thank Annick Brocquehaye, Florence Mezenge, Marie-Hermine Noël, Marie-Christine Onfroy, Vincent Baudouin, and the cyclotron team for their technical support in this study.