
Abstract
Ischemia induces a complex response of differentially expressed genes in the brain. In order to understand the specific mechanisms of injury in the developing brain, it is important to obtain information on global changes in the transcriptome after neonatal hypoxia-ischemia. In this study, oligonucleotide arrays were used to investigate genomic changes at 2, 8, 24, and 72 hours after neonatal hypoxia-ischemia, which was induced in 9-day-old mice by left carotid artery ligation followed by hypoxia (10% O2). In total, 343 genes were differentially expressed in cortex, hippocampus, thalamus, and striatum 2 to 72 hours after hypoxia-ischemia, when comparing ipsilateral with contralateral hemispheres and with controls, using the significance analysis for microarrays. A total of 283 genes were upregulated and 60 were downregulated, and 94% of the genes had not previously been shown after neonatal hypoxia-ischemia. Genes related to transcription factors and metabolism had mostly upregulated transcripts, whereas most downregulated genes belonged to the categories of ion and vesicular transport and signal transduction. Genes involved in transcription, stress, and apoptosis were induced early after the insult, and many new genes that may play important roles in the pathophysiology of neonatal hypoxiaischemia were identified.
Hypoxic-ischemic brain injury remains a common problem encountered in the perinatal period. The pathophysiologic insight of these lesions has increased over the past decade (Johnston et al., 2002), but we still lack a neuroprotective strategy whereby the severe consequences of hypoxia-ischemia (HI) can be minimized in newborns. We therefore need to increase our molecular understanding of hypoxic-ischemic injury in the immature brain.
It is now generally recognized that neurons and glial cells respond to ischemia, stress, or traumatic brain injury with a complex response involving differential gene expression. One approach is to perform global genomic searches for specific genes that are regulated after HI and that may participate in the neurochemical process leading to brain injury. Specific pathways related to susceptibility or resistance can be tracked and their roles can, subsequently, be studied in more detail. One way to get an overview of the genomic changes after an hypoxic-ischemic insult is to use DNA microarrays, which can investigate the expression of many thousands of genes in one small tissue sample.
Several studies have been performed studying changes in gene expression after ischemia in the adult brain using microarrays (Jin et al., 2001; Kim et al., 2002; Lu et al., 2003; Raghavendra Rao et al., 2002; Schmidt-Kastner et al., 2002; Schwarz et al., 2002; Tang et al., 2002), showing many new genes of interest. Many studies have, however, been limited to study the gene expression in a certain region at one specific time point (Kim et al., 2002; Lu et al., 2003; Schmidt-Kastner et al., 2002). In the setting of the immature brain, gene-expression studies directed at a particular group of genes using in situ hybridization or real-time quantitative reverse-transcription polymerase chain reaction (PCR) have been performed (e.g., Aden et al., 1994; Bona et al., 1999; Gubits et al., 1993; Vannucci et al., 1998). The differential gene response has been investigated in the immature brain after sublethal hypoxia (Bernaudin et al., 2002; Curristin et al., 2002), but there are no microarray studies on global gene expression at various time-points after HI accompanying the development of brain injury in the immature brain.
To identify different genes that change over time and those that may be related to brain damage or recovery processes after injury, we examined the genomic response in those regions of the gray matter where injury develops after neonatal HI (including cortex, hippocampus, thalamus, and striatum) at 2, 8, 24, and 72 hours after HI in the neonatal mouse. Using strict criteria, 491 genes were found to be differentially expressed after HI. Twenty-nine percent of the differentially expressed genes were characterized to belong to the group of immune-inflammatory–related genes that are further discussed in our companion article in this issue. Of the remaining 343 genes, 76% had not previously been reported after ischemia and 94% had not been detected after HI in the immature brain.
MATERIALS AND METHODS
Neonatal hypoxia-ischemia
C57BL/6 wild-type mice were obtained from Moellegaard Breeding and Research Center A/S (Skensved, Denmark). Neonatal HI was induced at postnatal day (PND) 9 according to methods described by Rice et al. (1981), but modified for mice (Hedtjarn et al., 2002; Sheldon et al., 1998). Mice of both sexes were anesthetized with enflurane (3% for induction and 1.5% for maintenance) in nitrous oxide/oxygen (1:1). The left common carotid artery was dissected and cut between ligatures of Prolene suture (6.0). After the surgical procedure, the wounds were closed and infiltrated with a local anesthetic and the pups were allowed to recover for 1 to 2 hours. The pups were then placed in a chamber perfused with a humidified gas mixture (10% oxygen in nitrogen) for 60 minutes at 36°C. The animals were kept in humidified air at 36°C for 10 minutes before and after the hypoxic exposure. After the hypoxic exposure, the pups were returned to their dams. This procedure results in brain injury in the ipsilateral hemisphere, consisting of cerebral infarction and selective neuronal death in the cortex, striatum, hippocampus, and the thalamus, leaving the contralateral hemisphere undamaged. Control littermates were neither operated on nor subjected to hypoxia. The Animal Ethical Committee of Göteborg approved all animal experiments (no. 269/01).
RNA preparation
Pups were killed by decapitation at 2, 8, 24, and 72 hours after HI and controls at PND 9 and PND 12 (n = 5 at each time point). Brains were removed and rapidly frozen on powdered dry ice. Cortex, hippocampus, thalamus, and striatum were microdissected from each hemisphere in a frozen state. Total RNA was then isolated from each region individually according to the manufacturer's instructions, using the Rneasy mini kit (Qiagen GmbH, Hilden, Germany). The RNA was quantified by spectrophotometry at 260 nm, and the OD was determined by the 260/280 ratio. The OD of the RNA was between 1.9 to 2.1 and the quality of the RNA was further checked by running the RNA samples on a 1.1% agarose, 2.2 mol/L formaldehyde gel to ascertain that there was no degradation. Six micrograms of total RNA from cortex, hippocampus, thalamus, and striatum was thereafter pooled to represent a gray matter sample for each hemisphere.
GeneChip expression analysis
RNA from the ipsilateral (hypoxic-ischemic, n = 5 at each time point) and contralateral (hypoxic, n = 5 at each time point) hemispheres of each HI animal and left hemispheres from controls at PND 9 (n = 5) and PND 12 (n = 5) were analyzed as individual samples. Array expression analysis was performed according to the Affymetrix expression analysis technical manual at the Swegene facility in Lund, Sweden. Briefly, double-stranded cDNA was synthesized from total RNA and then an in vitro transcription reaction was performed to produce biotin-labeled cRNA from the cDNA. The cRNA was fragmented and hybridized to Affymetrix GeneChips (MG-U74Av2).
Each gene on the array is represented by 16 different probe pairs. The probe pairs are constituted of one oligomer (25 bp) that is complementary to a sequence of the gene of interest, called the perfect match (PM) probe and one oligomer called the mismatch (MM) probe, which is identical to the corresponding PM oligomer except for one base in a central position that has been altered to no longer complement the target gene. The MM probe is a control for nonspecific cross-hybridization. The Affymetrix GeneChip software MAS 5.1 (Affymetrix, Santa Clara, CA, U.S.A.) was used to calculate the intensity values for each probe set and the average difference intensity of PM – MM for all probe sets is called the signal for a certain gene. This signal directly correlates to the amount of mRNA for each gene. A chip-to-chip normalization was thereafter performed to correct for differences in hybridization between arrays.
Significance of microarrays analysis
Because about 12,000 transcripts are analyzed on each array, it is important to choose a statistical program that takes multiple comparisons into account. We therefore used the significance analysis of microarrays (SAM) (Tusher et al., 2001) for statistical analysis of the differentially expressed genes after HI. According to the SAM algorithm, genes are identified as differentially expressed based on the difference in expression among the sample groups and the consistency of this expression difference, and a score is assigned to each gene on the basis of its change in gene expression relative to the standard deviation of repeated measurements for that gene. A gene is called significant if its score surpasses a certain threshold. SAM calculates a false discovery rate (FDR), which is the median percentage of genes that are likely to be identified as significantly changed by chance. The threshold can be adjusted to identify different sets of putatively significant genes and the FDR is changed accordingly. The number of significantly changed genes in each experiment depends on a threshold with an acceptable FDR, selected by the investigator. In this study a FDR of less than 10% in each analysis was chosen because similar FDRs have been used in other studies (Chowers et al., 2003; Tusher et al., 2001), and it is important not to set the threshold too low because many relevant genes may be left undetected.
Two-class unpaired SAM analysis was performed between ipsilateral and contralateral hemispheres at all time points after HI (2, 8, 24, and 72 hours) and between controls at PND12 and ipsilateral hemispheres at 72 h after HI. A multiclass response analysis was also performed with controls at PND9 and ipsilateral hemispheres at 2 h, 8 h and 24 hours after HI. The FDR was set to be <10% in every analysis and the fold change to 1.5, which means that the expression of a certain gene had to change at least 50% up or down. In addition, only genes that turned out significant both when comparing ipsilateral hemispheres with contralateral hemispheres at a certain time point and when comparing ipsilateral hemispheres with corresponding controls were considered significantly changed in the analysis. These criteria are quite stringent and may have eliminated many additional genes that were actually regulated by HI, but they also guarantee that the changes in gene expression shown in this study are related to development of HI injury and not merely to hypoxia which is known to induce expression of several genes without causing any damage (Bergeron et al., 1997; Bernaudin et al., 2002), or to developmental changes in normal gene expression. Between PND 9 and PND 12, 1,490 genes were significantly changed (FDR < 10%, fold change 1.5), but no changes were found when comparing contralateral hemisphere at 72 hours with PND 12 (data not shown). In addition, at 24 hours after HI, which is the only time point without any age-matched nonhypoxic control, 29 genes were significantly changed between ipsilateral and contralateral hemisphere that were also developmentally changed from PND 9 to PND 12. However, 19 of these genes were also significantly changed at 72 hours after HI between ipsilateral and contralateral and between ipsilateral and corresponding age-matched controls, indicating that they were injury-induced and leaving only 10 genes at the 24-hour time point that putatively could be false positives due to developmental changes.
Database search
Information that was found when searching SOURCE (http://genome-www5.stanford.edu/cgi-bin/source/source Search hosted in the public domain by Stanford University, Stanford, CA, U.S.A.), Mouse Genome Informatics (MGI) homepage (http://www.informatics.jax.org), Horst Ibelgaufts' Cytokines Online Pathfinder Encyclopaedia (http://www.copewithcytokines.de), and PubMed were used to functionally characterize the significantly regulated genes and to divide them into different functional categories. Genes from expressed sequence tag (EST) clusters were identified by searching the SOURCE home page, and most of them had already been identified. Those ESTs that had less than 80% similarity to any other gene, had no information on the SOURCE homepage, or that were already present on the chip as genes were not included in the study.
Real-time polymerase chain reaction
The microarray data for Atf-3, calcyclin, cathepsin C, and cathepsin D was confirmed by real-time PCR by using a Light Cycler (Roche Diagnostics, GmbH, Mannheim, Germany). The confirmation by real-time PCR was performed at that time point after HI, where the highest amount of expression was detected with the microarray analysis. First-strand cDNA synthesis was performed with Superscript RNase H− reverse-transcriptase kit (Life Technologies, Gaithersberg, MD, U.S.A.), random hexamer primers, and dNTP (dATP, dCTP, dGTP, and dTTP, Roche Molecular) from the same total RNA that had been used for the microarray analysis.
Each PCR (20 μL) contained 1/50 of the cDNA synthesis reaction, 2 or 3 μmol/L MgCl2 (depending on the optimal concentration for each primer pair), 0.5 μmol/L forward and reverse primers, and 2 μL of Light Cycler–FastStart DNA Master SYBR Green I (Roche Molecular), which contains FastStart Taq DNA polymerase, reaction buffer, dNTP mix, and SYBR Green I dye. The following primer pairs (from CyberGene AB, Huddinge, Sweden), annealing temperatures, and elongation times were used: calcyclin: forward: 5′-CAAGGAAGGTGACAAGCACA-3′, reverse: 5′-CTGGATTTGACCGAGAGAGG-3′, 58°C, 11 seconds; ATF-3: forward: 5′-CAGAGCCTGGTGTTGTGCTA-3′, reverse: 5′-GCCTTCATTGTGTGACGTTG-3′, 57 °C, 13 seconds; GAPDH: forward: 5′-CATCACCATCTTCCAGGAGCG-3′, reverse: 5′-GAGGGGCCATCCACAGTCTTC-3′, 58°C, 15 seconds; cathepsin C: forward: 5′-GGCAAGAAGGTGGAAAGTCA-3′ reverse: 5′-TCAGATCTCGCAGGCTCATT-3′, 58°C, 8 seconds; cathepsin D: forward: 5′-ATACTGGCTCCTCTAACCTG-3′ reverse: 5′-ATACCTCCTGCCTTTGACTG-3′, 58°C, 9 seconds. The amplification protocol started with 10 minutes at 95°C, followed by 40 cycles of 95°C for 15 seconds, annealing temperature (see above) for 4 seconds and 72°C for 9 to 17 seconds (see above), depending on the product size. Each sample was assayed in duplicate. A melting curve was performed at the end of amplification to check that only one product had been produced, and the PCR product was run on a 1.5% agarose/0.5X TBE gel containing ethidium bromide to confirm that the product was of the expected size. For quantification and for estimating amplification efficiency, a standard curve for each gene product was generated using increasing concentrations of cDNA. The amplification transcripts were quantified with the relative standard curve and normalized against GAPDH.
RESULTS
Hypoxia-ischemia in the immature brain induced the expression of a significant number of genes. In total, 491 genes and ESTs were differentially expressed 2 to 72 hours after HI, using the criteria previously described (FDR < 10%, fold change at least 1.5 and significant change both when comparing ipsilateral hemisphere with contralateral hemisphere and with appropriate control). Twenty-nine percent of the differentially expressed genes were characterized to belong to the group of immune-inflammatory–related genes (data not shown), which are further discussed in our companion article in this issue. Of the remaining 343 differentially expressed genes and ESTs, 283 were upregulated and 60 were downregulated. When investigating the time course of gene expression after HI, it was found that 23 genes were upregulated and no genes were downregulated at 2 hours after HI, 79 genes were upregulated and 5 were downregulated at 8 hours after HI, 101 genes were upregulated and 24 were downregulated 24 hours after the injury, and 193 genes were upregulated and 45 genes were downregulated at the latest time point investigated (72 hours after HI). By searching PubMed and investigating all previous articles concerning changes in gene expression after ischemia, it was estimated that 261 (76%) of the 343 regulated genes had not previously been reported after cerebral ischemia, and 322 (94%) of the genes had not been reported after ischemia in the immature brain.
Real-time PCR
The four genes selected for confirmation by real-time PCR—Atf-3, calcyclin, cathepsin C, and cathepsin D—were also significantly upregulated when using real-time PCR (Fig. 2). The levels of Atf-3 were increased by almost 16 times with real-time PCR compared with the microarray where a fivefold increase was detected, whereas the increase of calcyclin, cathepsin C, and cathepsin D expression was rather similar between the microarray analysis and real-time PCR (Fig. 2). A number of other genes belonging to the immune-inflammatory group were also confirmed by real-time PCR, and in general there was a very good agreement between the two methods (see our companion article in this issue).
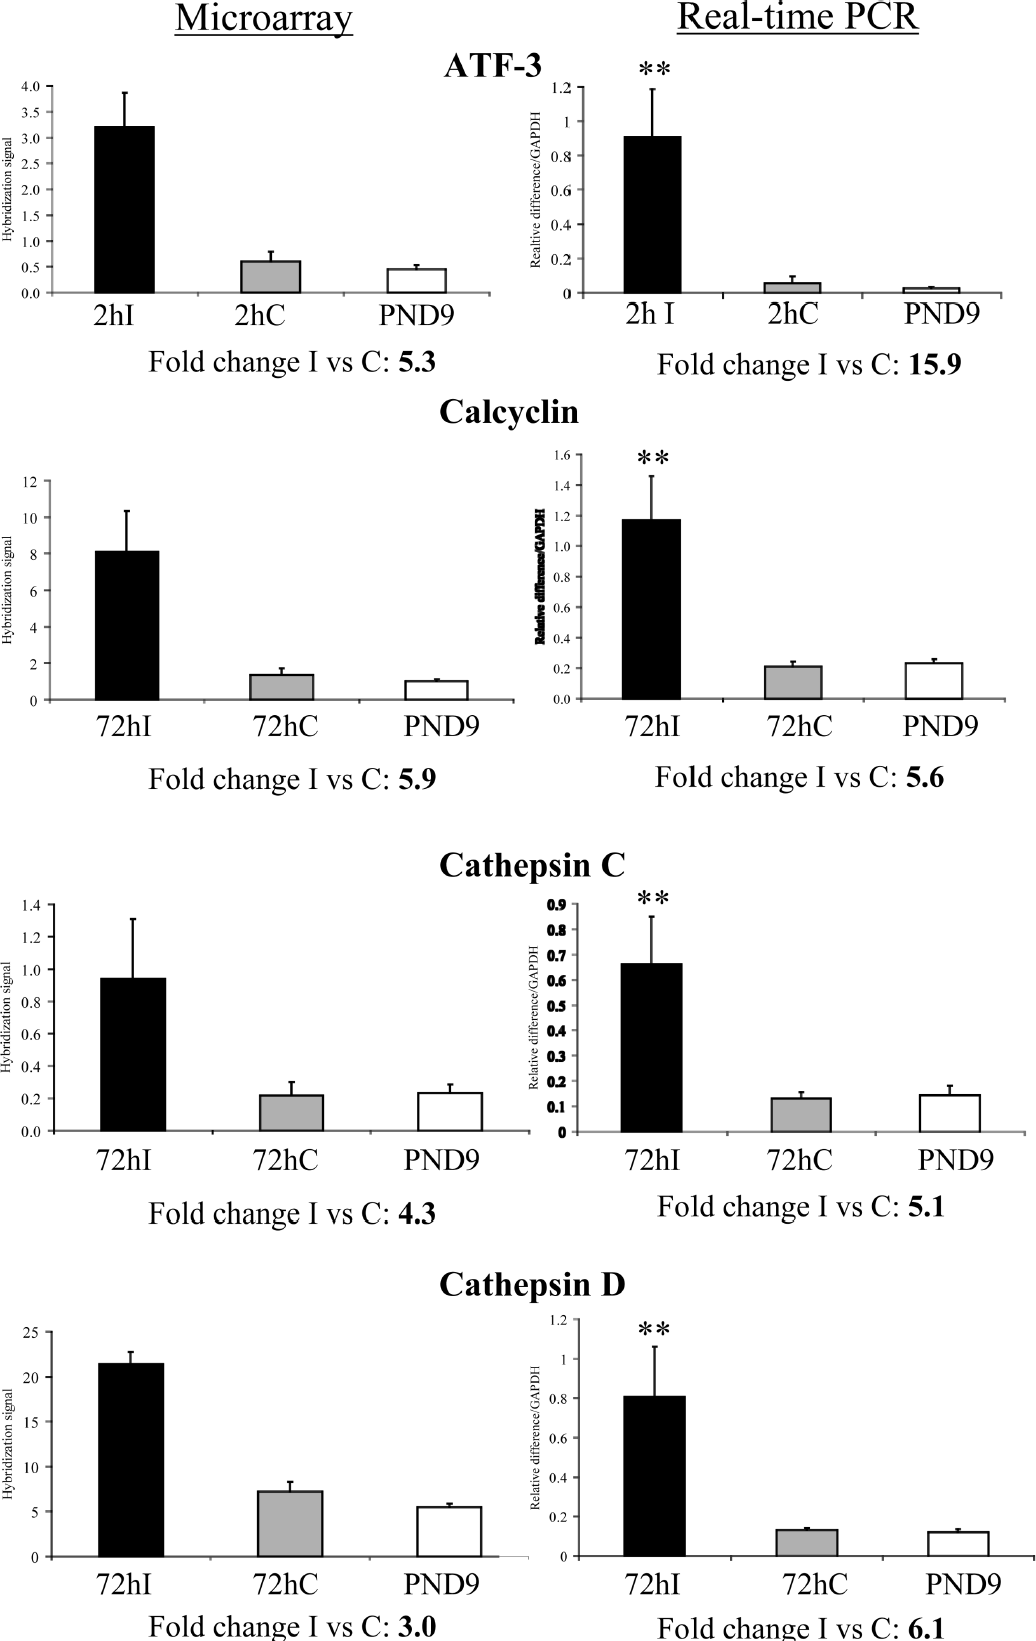
Confirmation with real-time PCR of genes that were detected as upregulated by the microarray analysis. The diagrams in the left column show the changes in expression found on the array, whereas the right column presents PCR results. Data are expressed as mean ± SD; **P < 0.01 when compared with contralateral hemisphere using the Mann-Whitney U test.
Functional categories of differently expressed genes
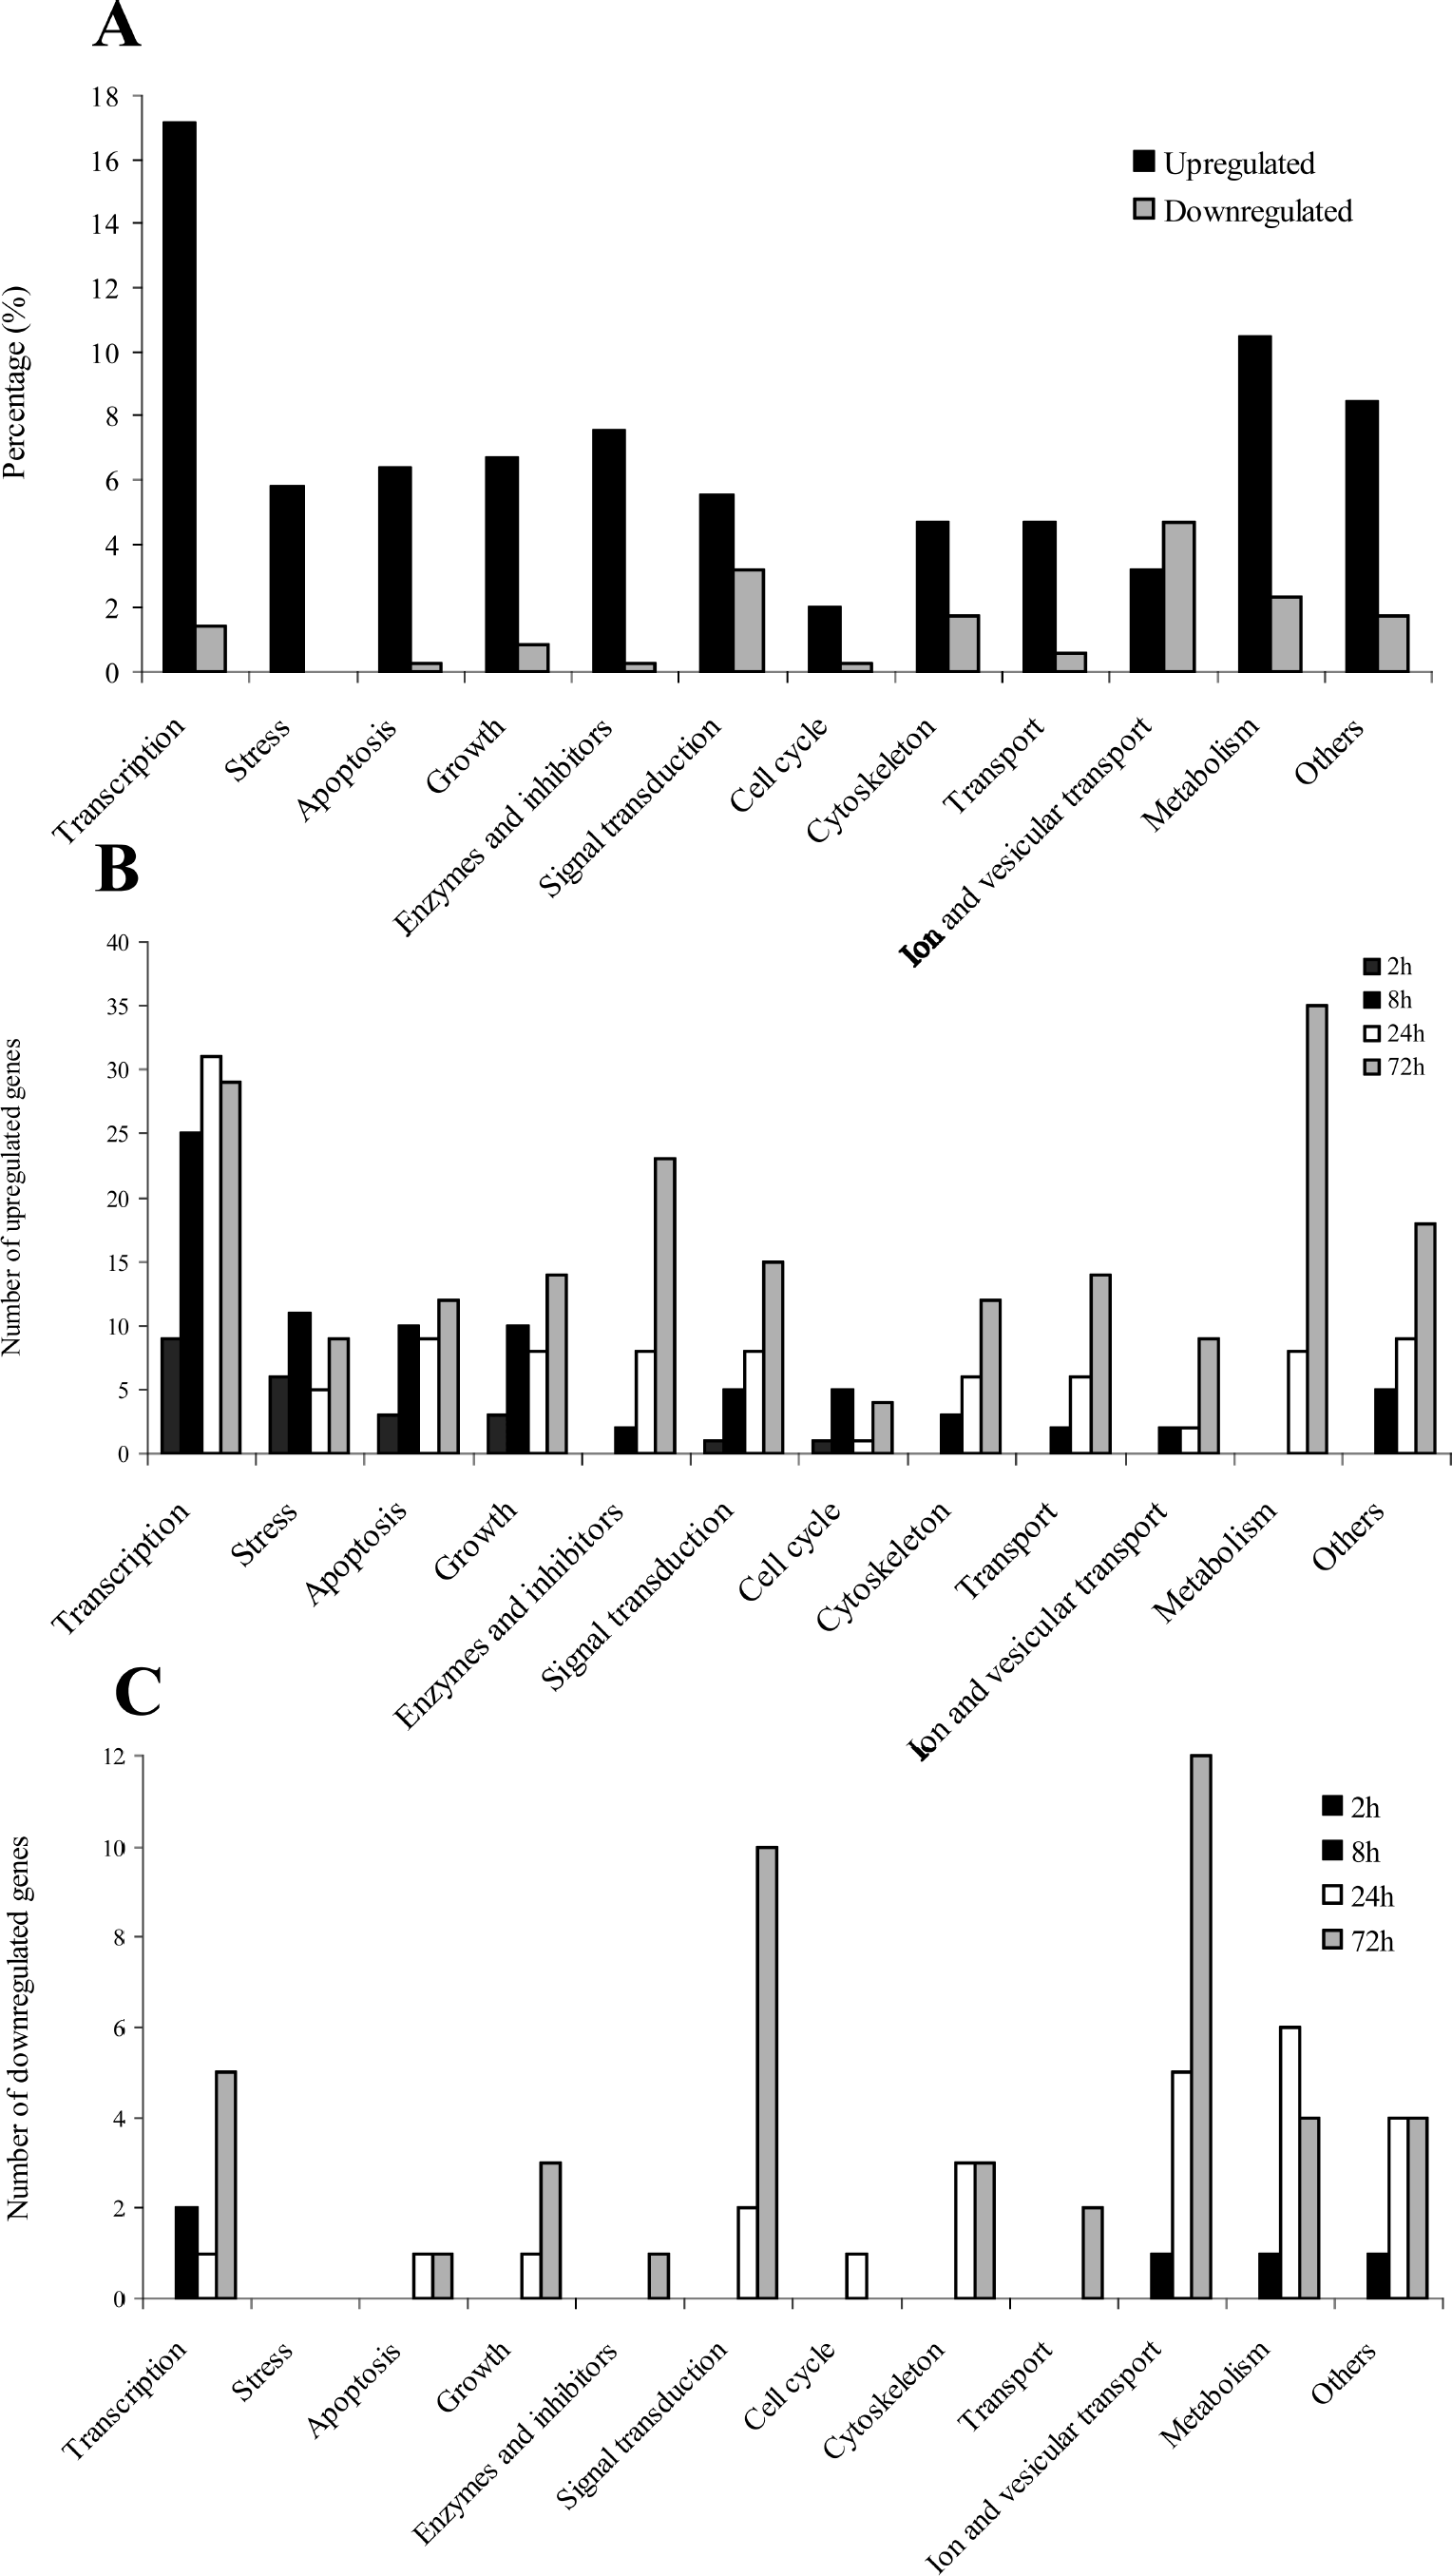
The differentially expressed genes were broadly divided into 12 different functional categories. The genes from six of the categories are shown in tables (Table 1–6), while the genes from the remaining categories are only referred to in the text. The categories with the most upregulated transcripts were the transcription factor–related genes (17% of total amount differentially expressed genes) followed by the metabolism-related genes (10%) and genes belonging to the others category (8%). Most of the downregulated genes were found in the categories with genes related to ion and vesicular transport, synaptic transmission, hormones, and neurotransmitters (4.7% of the total amount of differentially expressed genes), signal transduction (3.2%), and metabolism (2.3%) (Fig. 1A). The total number of upregulated and downregulated genes at each time point in the different categories is shown in Figs. 1B and C. Genes involved in metabolism, cytoskeleton, transport, genes for enzymes and inhibitors, and genes with other functions were mostly upregulated at rather late time points after HI (24 to 72 hours), whereas genes involved in transcription, stress, apoptosis, and growth had already started to become upregulated at 2 hours after HI and then showed a quite stable and elevated level of upregulation from 8 to 72 hours after HI (Fig. 1B). Most of the downregulated genes were found at rather late time points after HI (24 to 72 hours) (Fig. 1C).
Genes involved in transcriptional regulation
Ischemia is known to induce many transcription factors, both in the adult and the immature brain, including c-jun, c-fos, and jun-B, which were also upregulated in the present microarray analysis. Several other transcription factors known to be induced after ischemia in the adult brain but not previously linked to neonatal hypoxia-ischemia were also identified, including C/EBP beta and delta, ATF-3, krox-20, chop-10, STAT-1, interferon regulatory factor (Irf) 1 and 8. Hypoxia-ischemia in the immature brain also induced genes not previously described after ischemic brain injury (adult or immature) including HES-5, inhibitor of DNA binding 1 and 3, ATF-4, Atf-x, TGIF, Bach protein 1, Nrf2, Zfp 147, Irf (5, 7, and 9), and STAT-6 (Table 1).
Stress-related genes
Heat shock proteins 70 kd (70–3, 70–4) gadd45 alpha and heme oxygenase, known to be upregulated after ischemia, were also found to be upregulated on the array. Ier3 (gly96), dual specificity phosphatase 1, other heat shock proteins like hsp47 and hsp40, and members of the gadd45 family (beta and gamma), which previously have been shown to be upregulated after ischemia in the adult brain but not in the neonatal brain, were upregulated. Some genes related to oxidative stress but not previously detected after ischemia, like peroxiredoxin 6, gamma-glutamylcysteine synthetase, and glutathione peroxidase, responded to HI. Mitogen-inducible gene 6 protein homolog, hsp22, and heat-responsive protein 12 represent additional new genes in response to cerebral ischemia (Table 2).
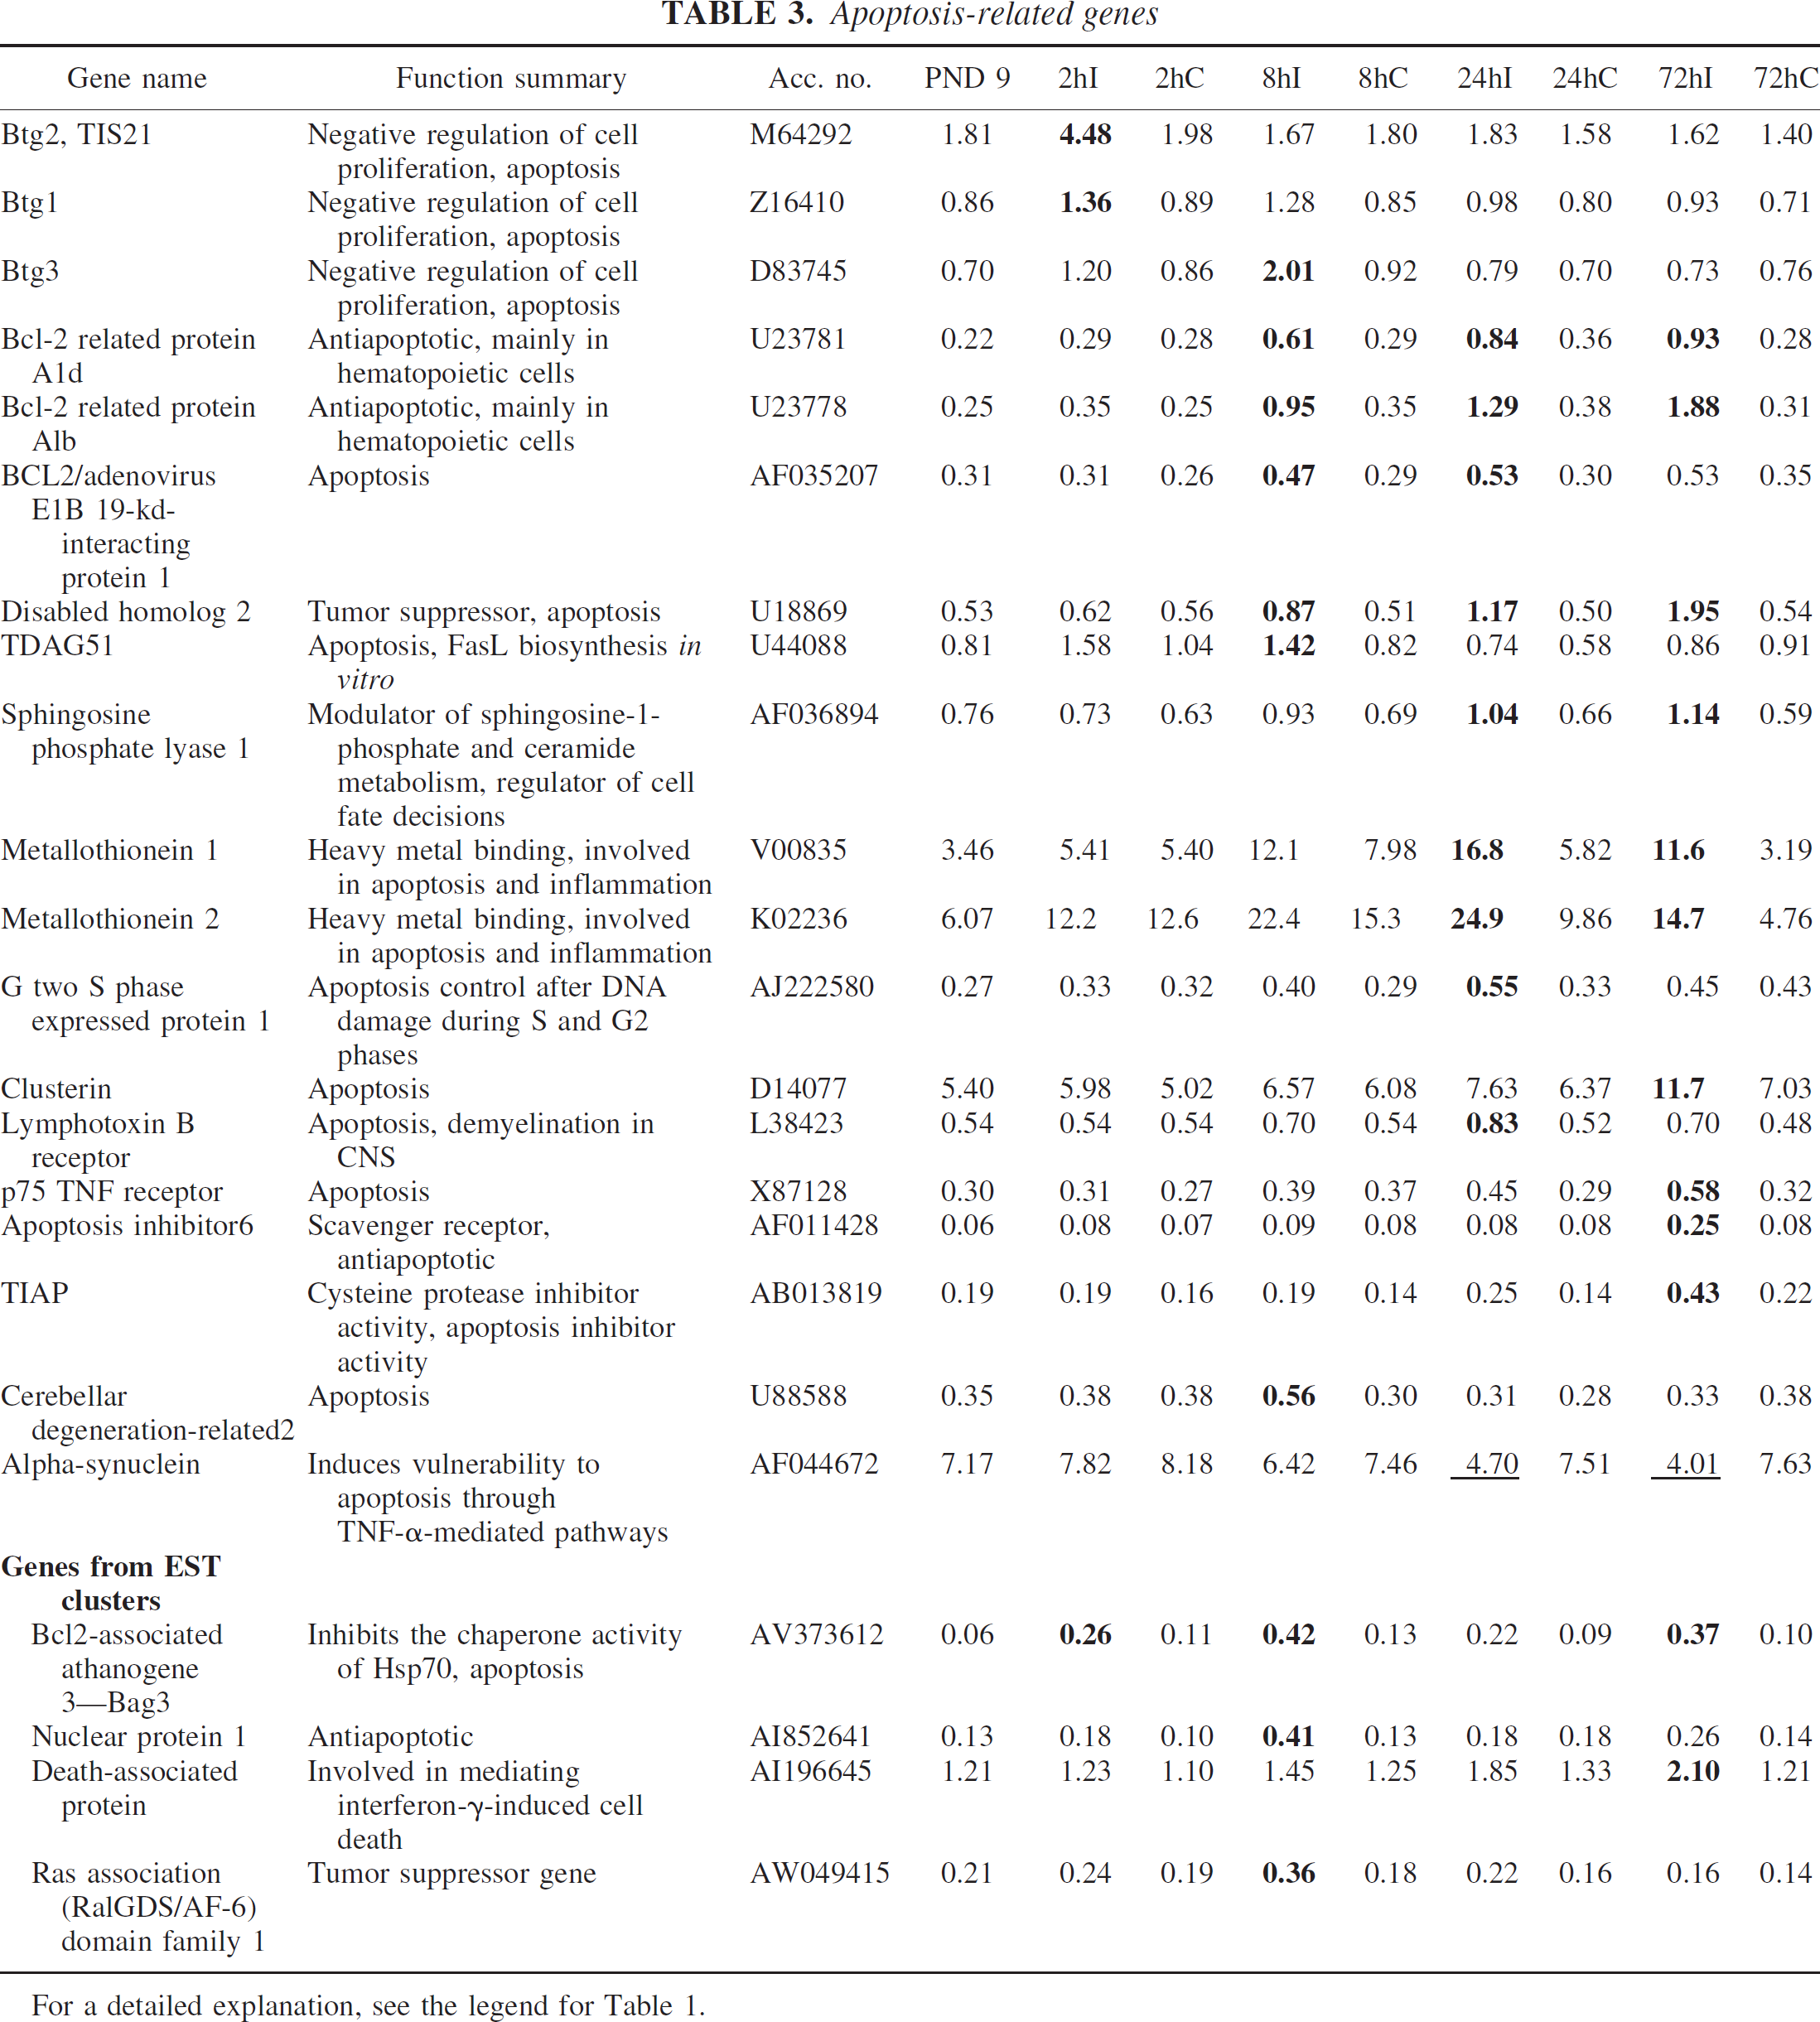
Apoptosis-related genes
Clusterin has been found to be upregulated after cerebral ischemia in both adult and neonatal brain, and was also upregulated on the array. Other apoptosis-related genes like metallothionein 1 and 2, Bag3, p75 TNF receptor, and TIAP, which are known to be induced by ischemia in the adult brain, also responded to neonatal HI. Several genes that have not previously been reported after ischemia, including B-cell translocation gene (Btg) 1 and 3, Bcl-2–related protein A1b and A1d, BCL-2/adenovirus E1B 19-kd–interacting protein 1, TDAG51, sphingosine phosphatase lyase 1, lymphotoxin B receptor, apoptosis inhibitor 6/AAC-11, and death-associated protein, were also upregulated on the array (Table 3).
Genes involved in transcription regulation
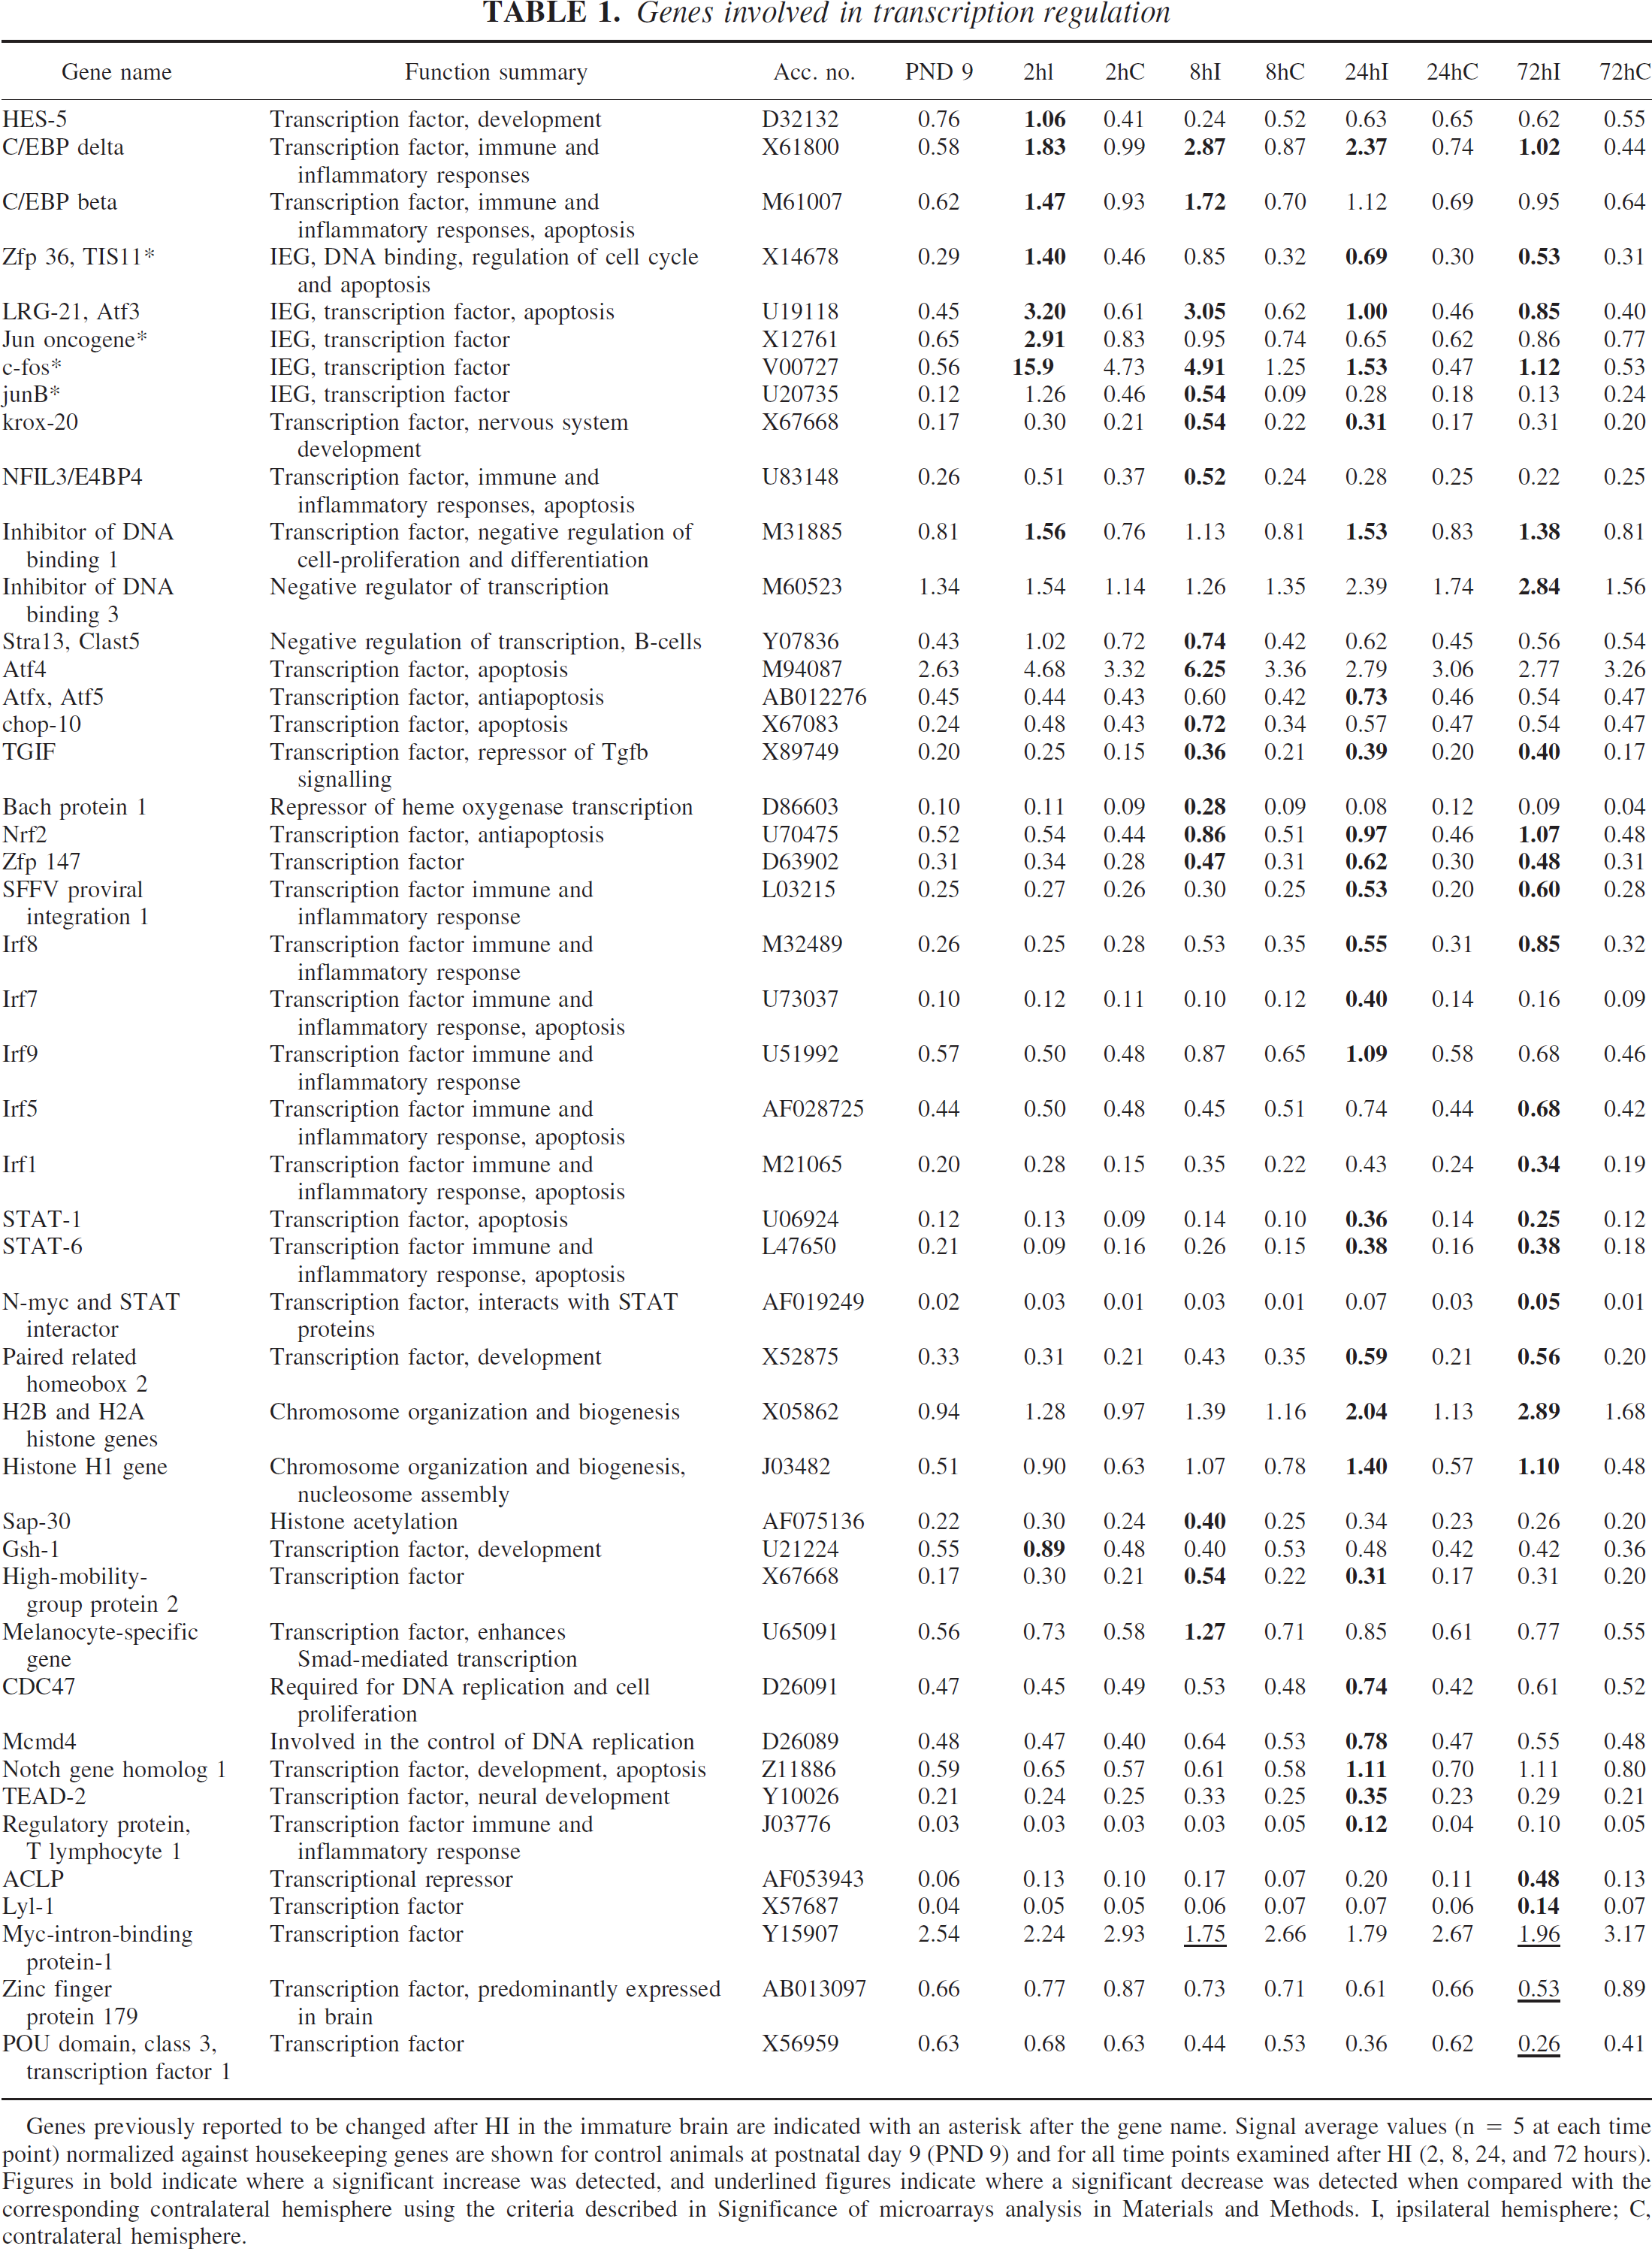
Genes previously reported to be changed after HI in the immature brain are indicated with an asterisk after the gene name. Signal average values (n = 5 at each time point) normalized against housekeeping genes are shown for control animals at postnatal day 9 (PND 9) and for all time points examined after HI (2, 8, 24, and 72 hours). Figures in bold indicate where a significant increase was detected, and underlined figures indicate where a significant decrease was detected when compared with the corresponding contralateral hemisphere using the criteria described in Significance of microarrays analysis in Materials and Methods. I, ipsilateral hemisphere; C, contralateral hemisphere.
Stress response genes
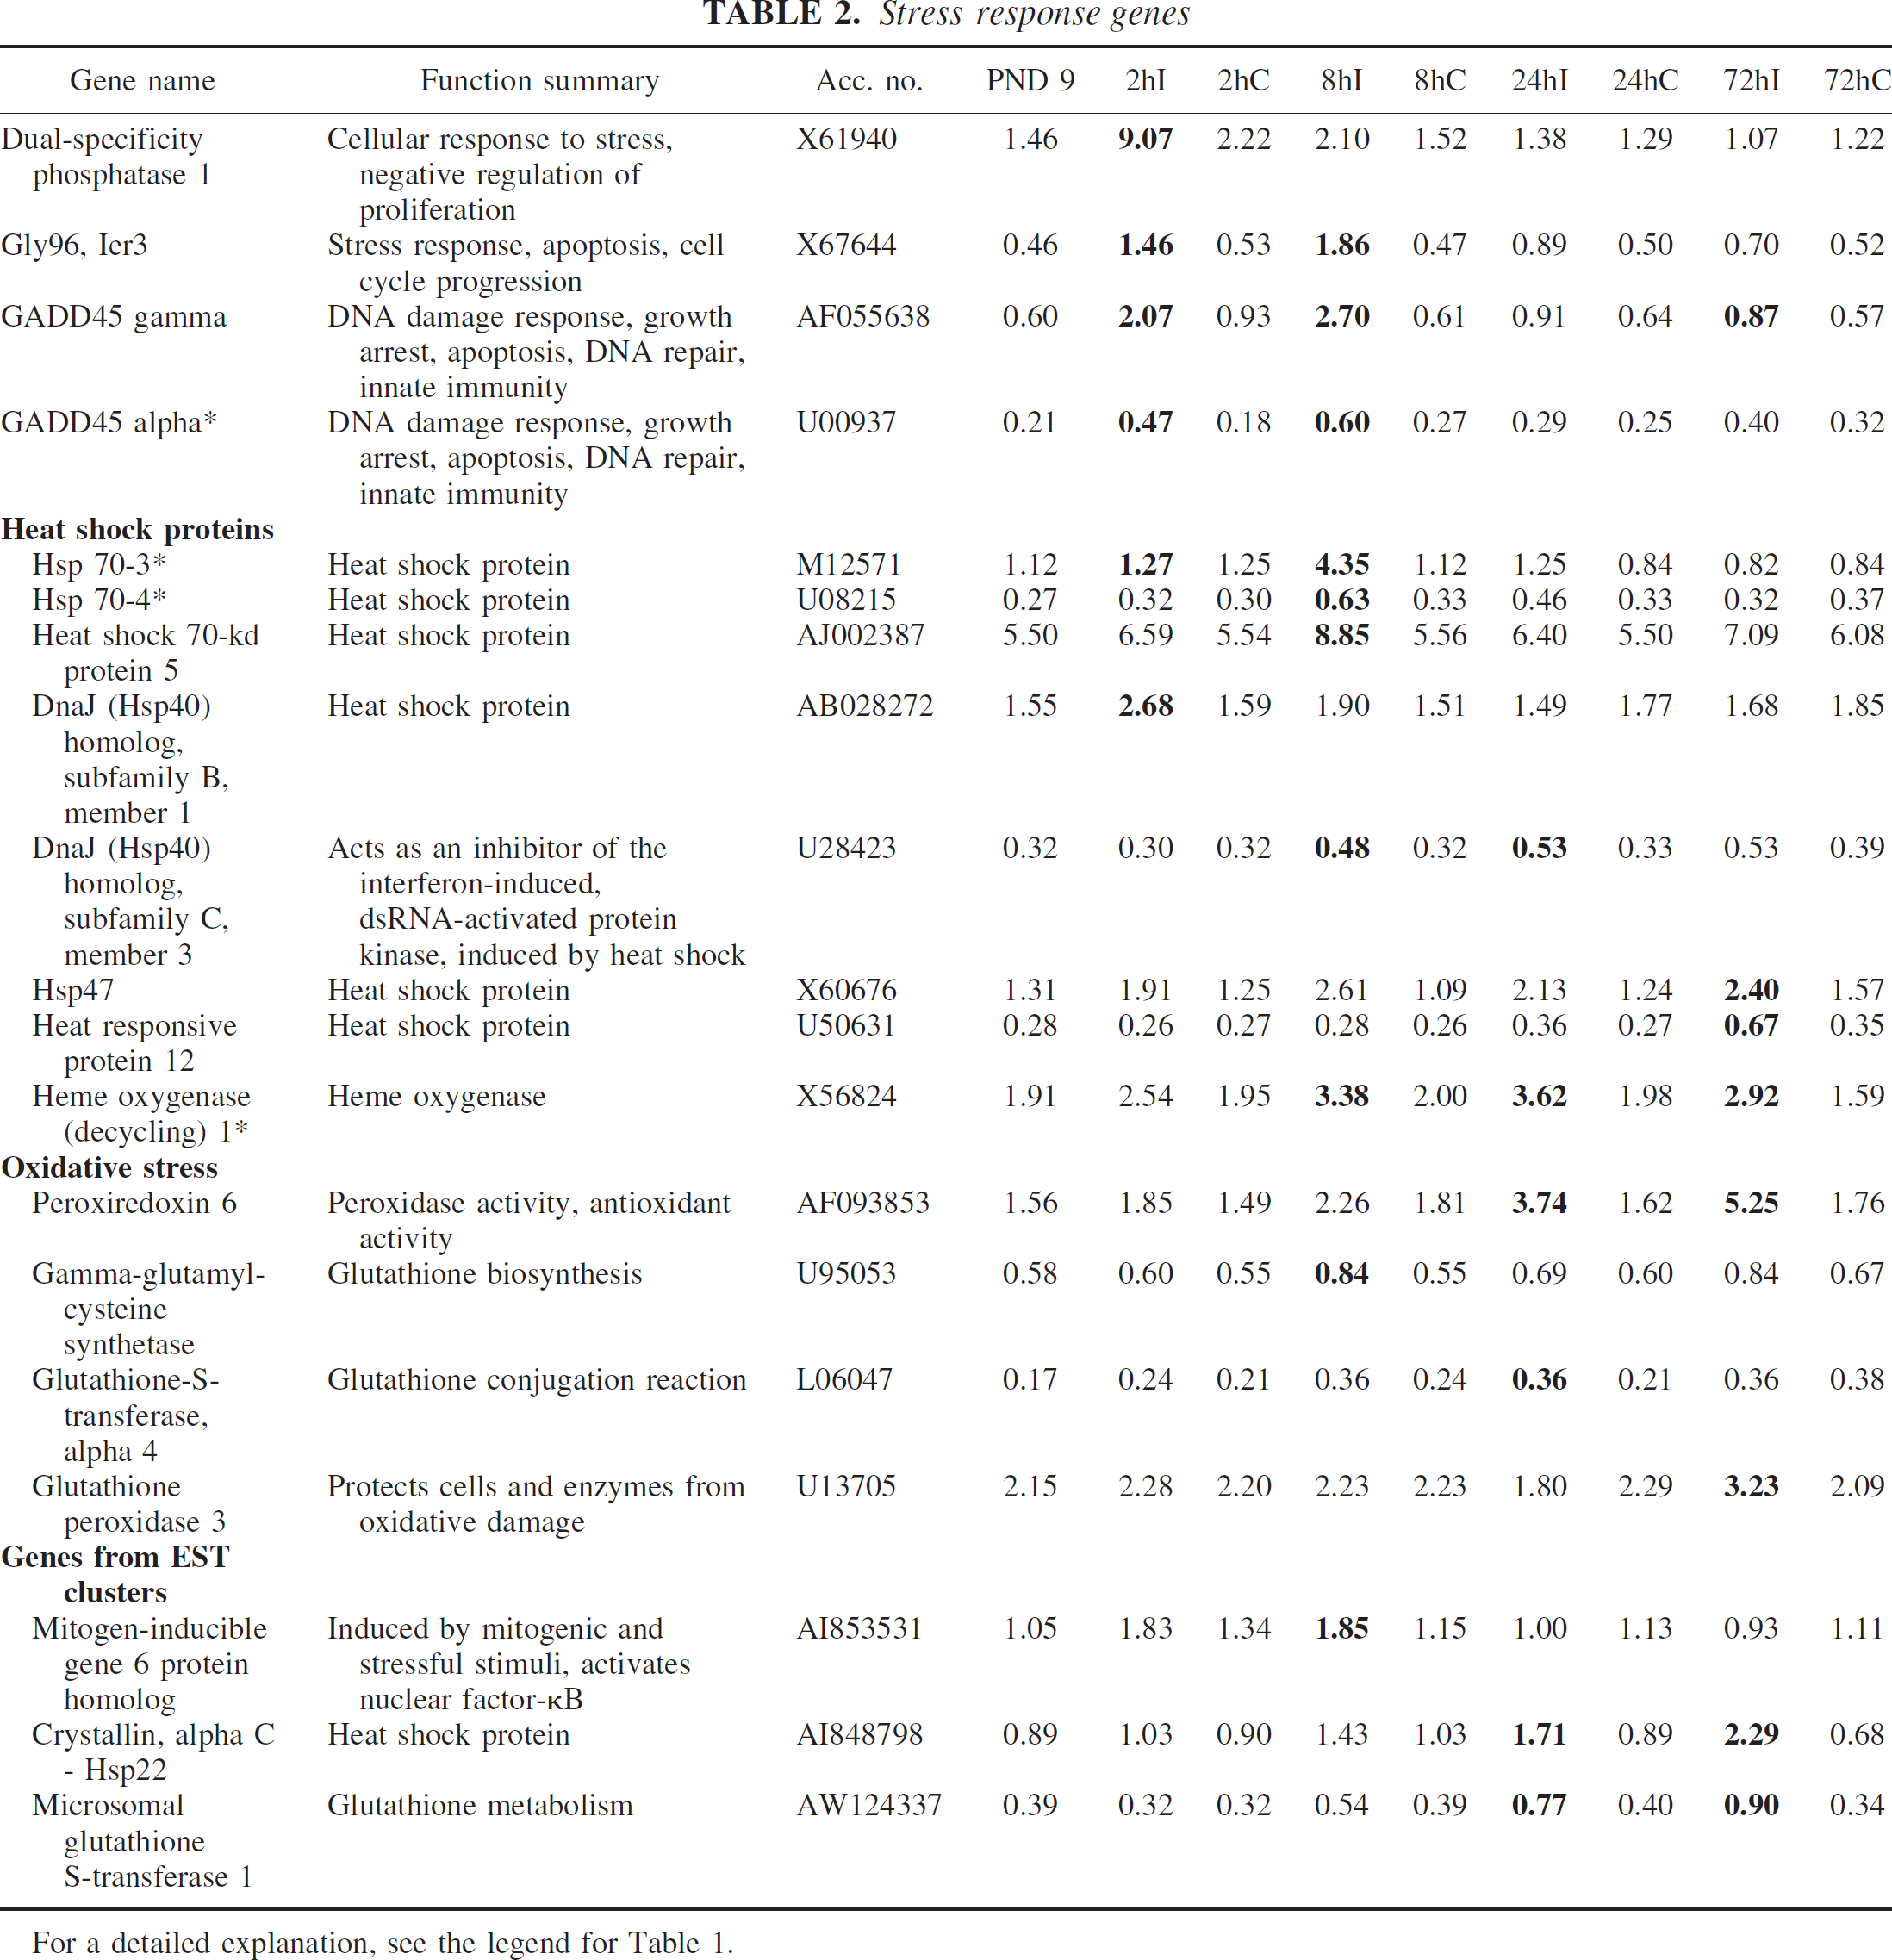
For a detailed explanation, see the legend for Table 1.
Growth factor–related genes
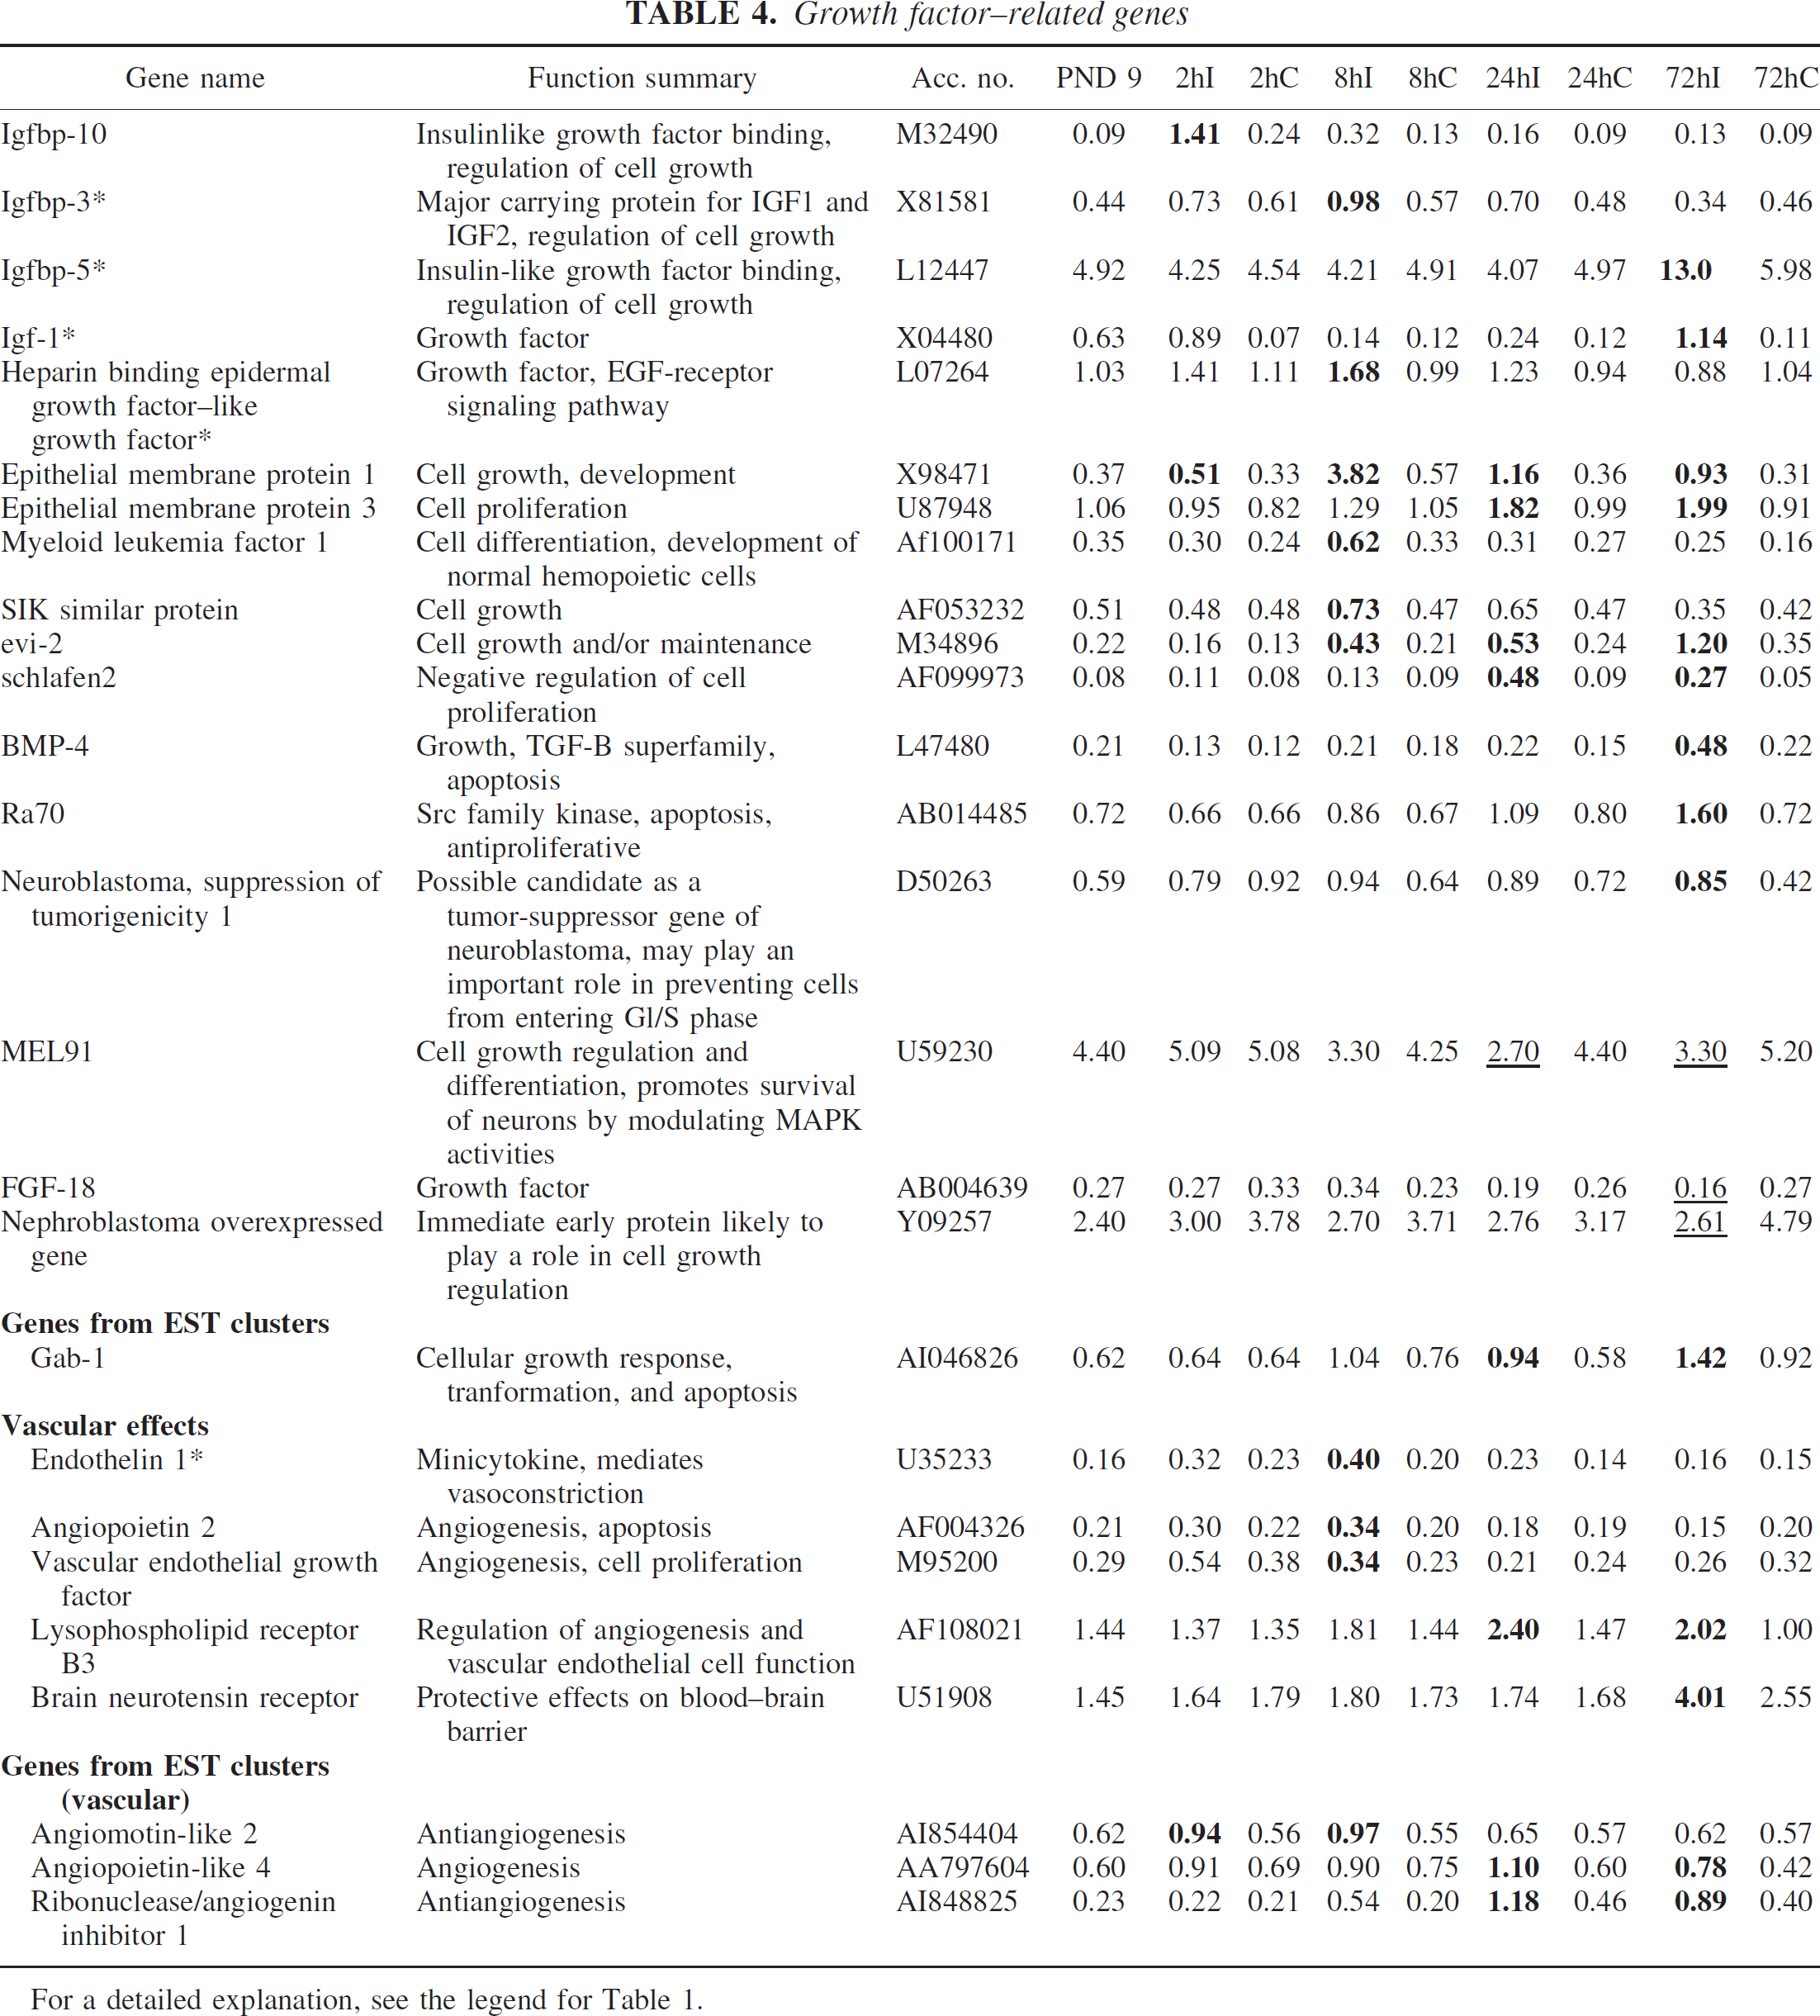
We found several previously detected ischemia-inducible genes related to growth factors, including insulin-like growth factor (Igf) 1, Igf binding proteins 3 and 5, and heparin binding epidermal growth factor–like growth factor. Genes previously shown to be upregulated after ischemia in adult brain, such as Igf binding proteins 6 and 10 and epithelial membrane protein 1, also responded to HI in the immature brain. We also discovered that several previously unreported ischemia-inducible genes related to cell growth were upregulated, such as myeloid leukemia factor 1, evi-2, schlafen2, RA70, growth factor receptor-bound protein 2–associated protein 1 (gab-1), whereas MEL91 and FGF-18 were downregulated (Table 4).
Apoptosis-related genes
For a detailed explanation, see the legend for Table 1.
Genes related to vascular effects
Endothelin-1, which is a minicytokine that mediates vasoconstriction, has previously been shown to be upregulated after ischemia in both immature and adult brain and was also upregulated on the array. In addition, several genes that are related to angiogenesis were upregulated on the array; angiopoietin 2 and vascular endothelial growth factor have previously been shown to be upregulated after ischemia in the adult brain, but lysophospholipid receptor B3, angiomotin–like 2, angiopoietin–like 4, and ribonuclease/angiogenin inhibitor 1 were previously unreported (Table 4).
Enzymes and inhibitors
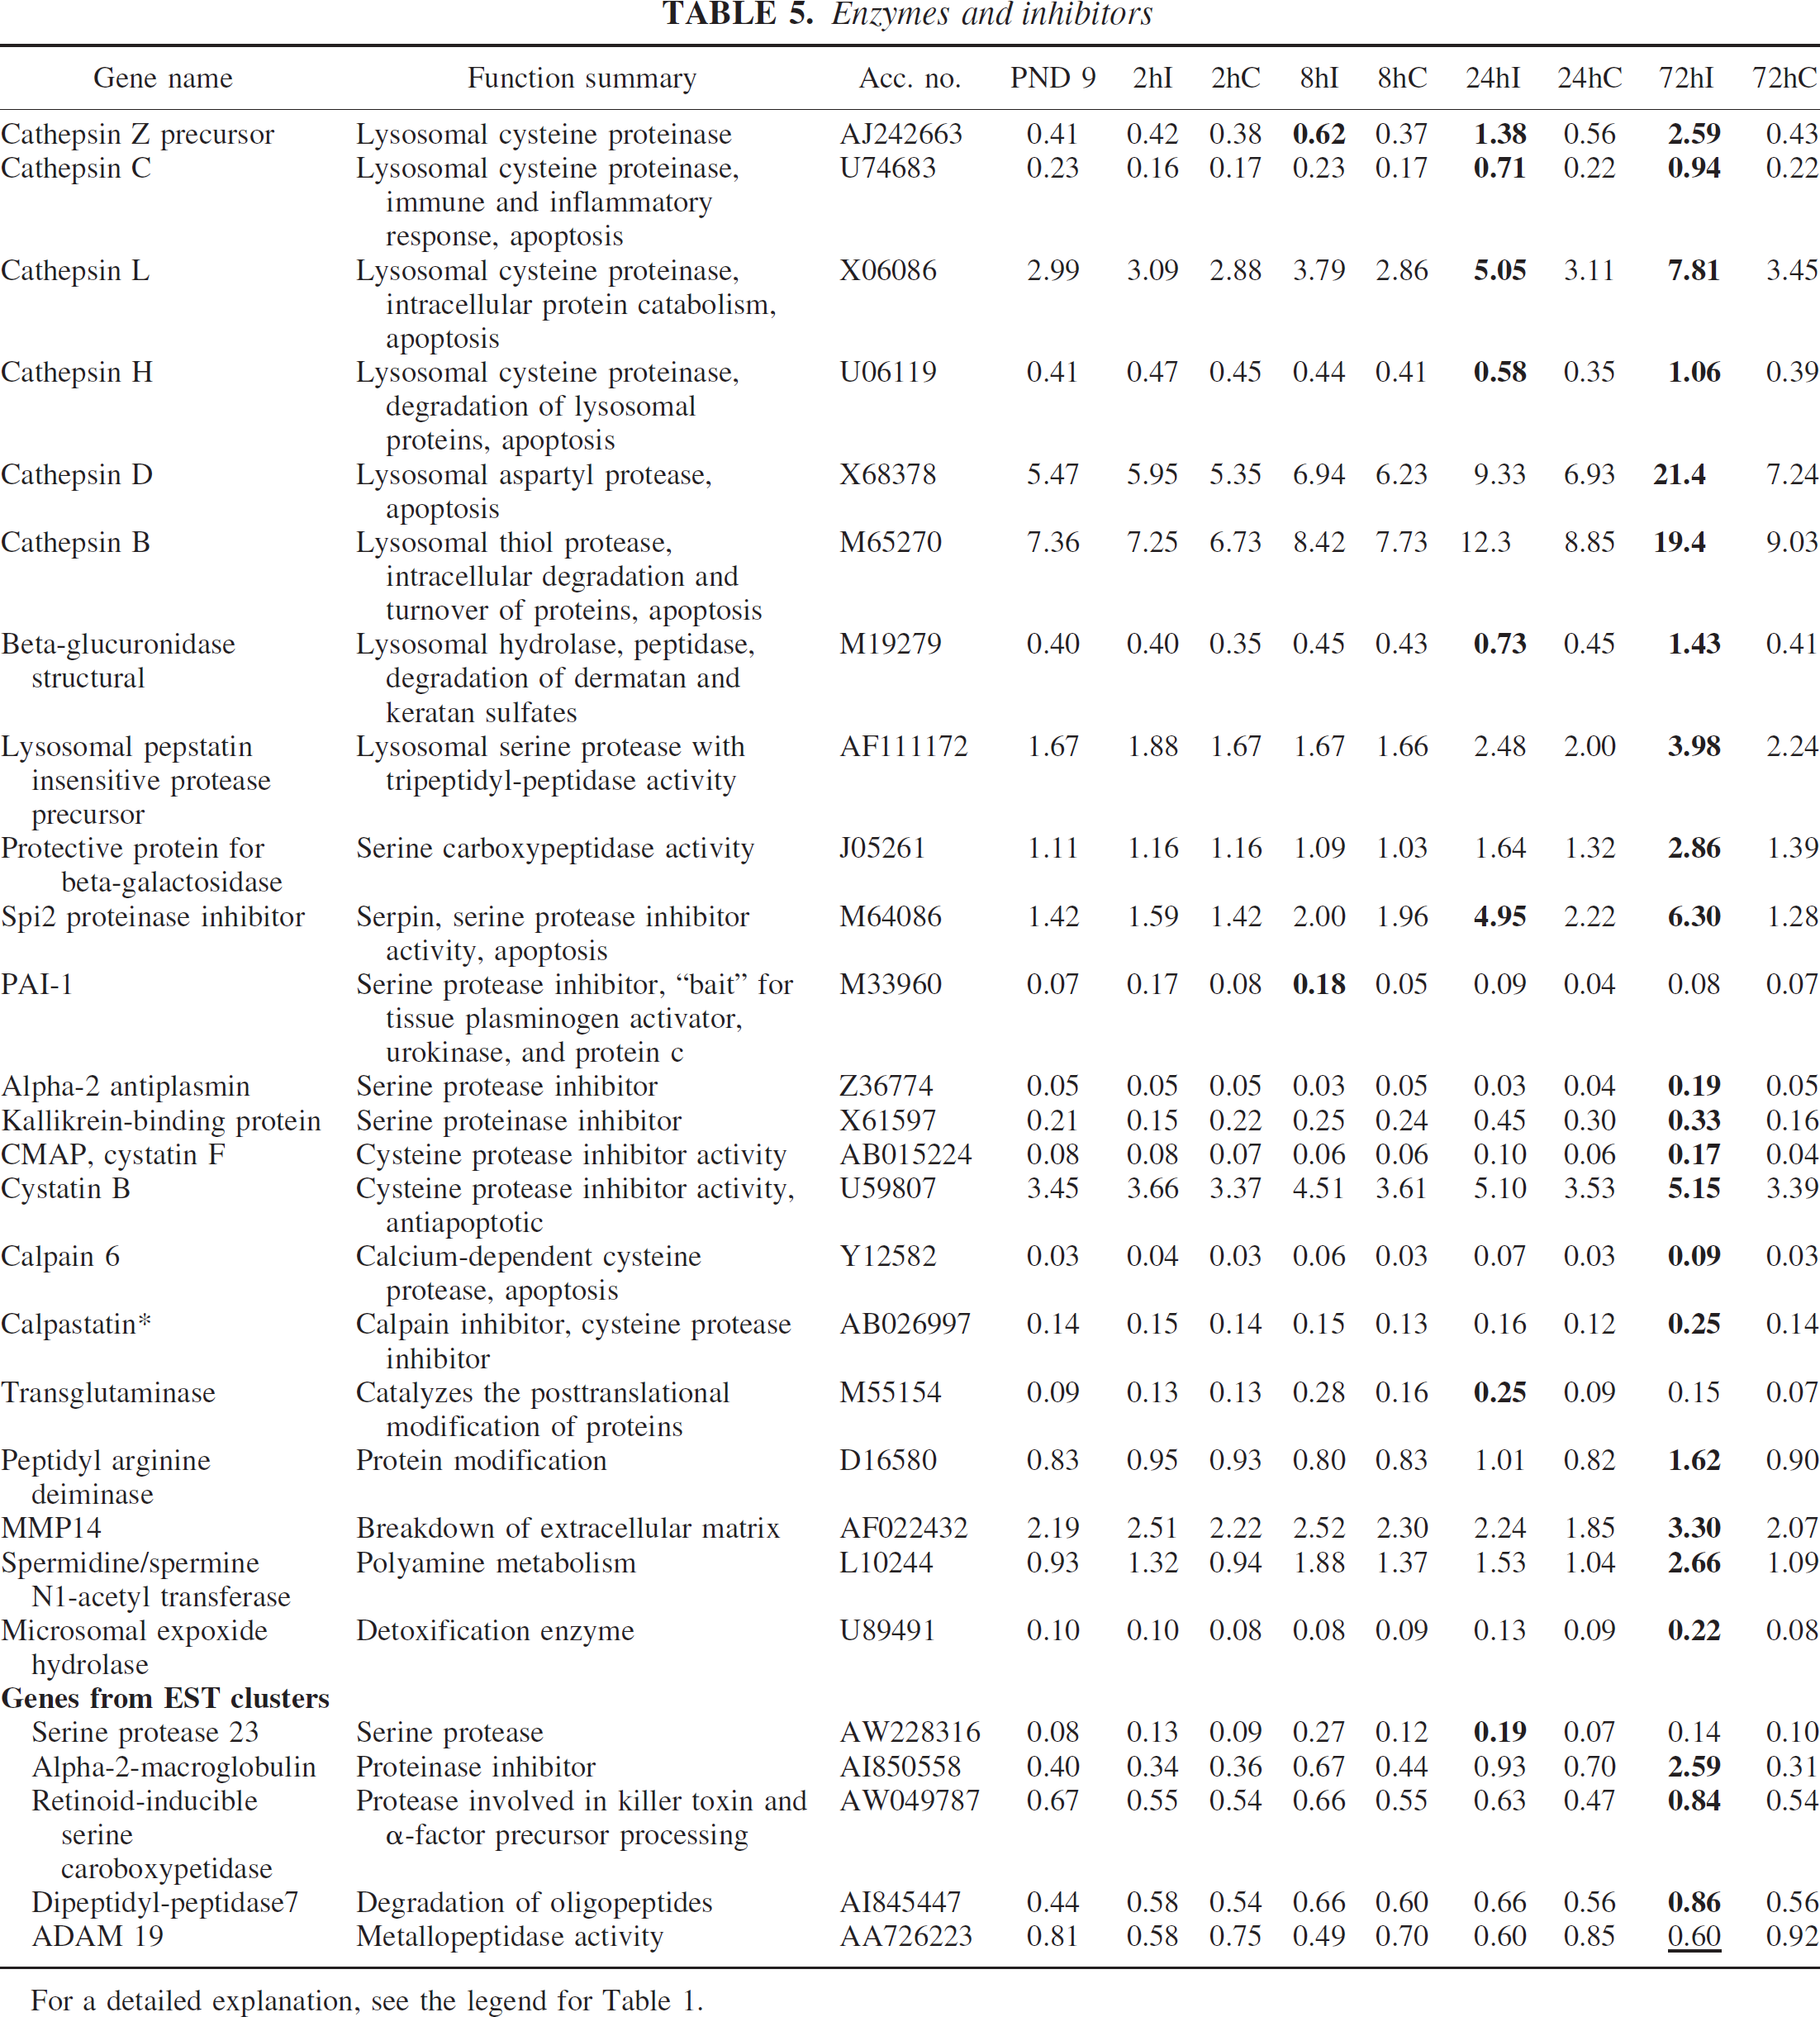
Several cathepsins were upregulated, including cathepsins B, C, D, H, and L, the serine protease inhibitors PAI-I and alpha-2 antiplasmin, and the cysteine protease inhibitor cystatin B, a finding that has previously been reported after ischemia in the adult brain. Several new genes were detected, including cathepsin Z precursor, beta-glucuronidase, spi2 proteinase inhibitor, protective protein for beta-galactosidase, peptidyl arginine deiminase, matrix metalloproteinase 14, and alpha-2-macroglobulin (Table 5).
Growth factor–related genes
For a detailed explanation, see the legend for Table 1.
Genes related to signal transduction
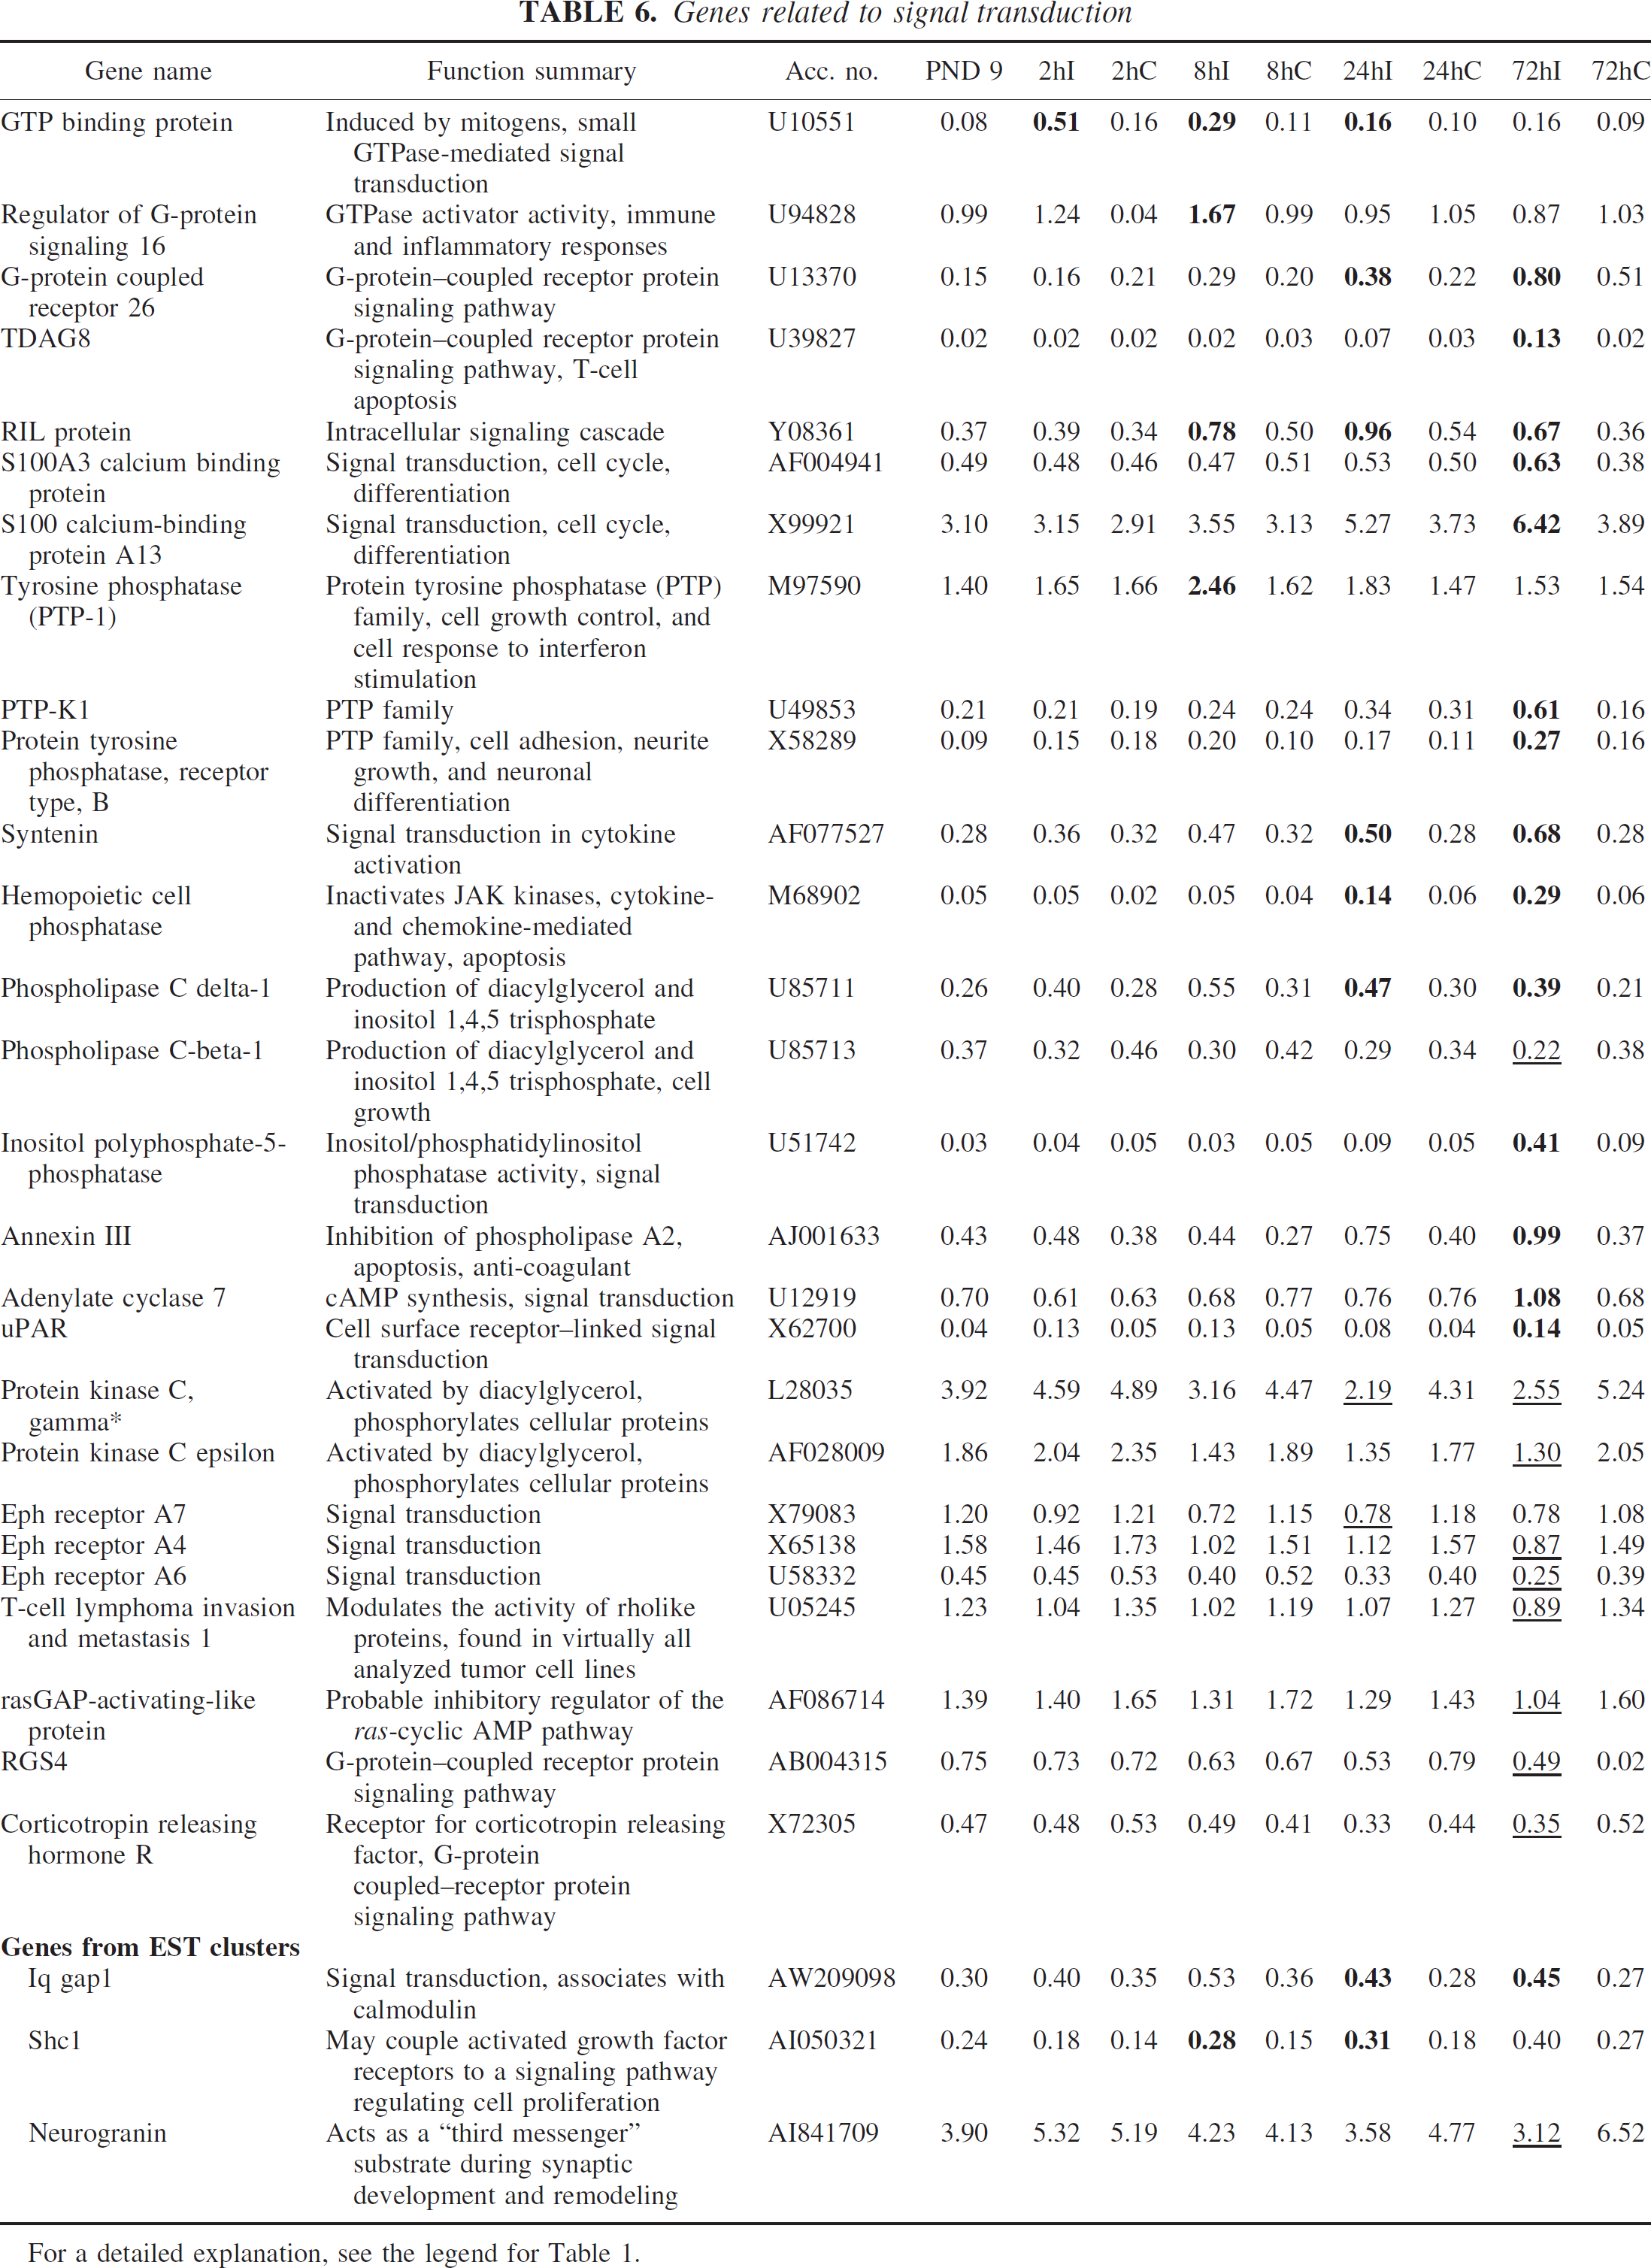
Several previously unreported genes were upregulated after HI, including regulator of G-protein signaling 16, G-protein–coupled receptor 26, and TDAG8 (G-protein related), tyrosine phosphatase (PTP-1), PTP-K1 and protein tyrosine phosphatase, receptor type B (PTP family), syntenin and hemopoietic cell phosphatase (cytokine signaling), whereas members of the ephrin family—eph receptors A4, A6, and A7 were downregulated (Table 6).
Cell cycle-related genes
Several previously unreported genes related to the cell cycle were upregulated on the array, like CDC-like kinase, calcyclin, cdc2/CDC28-like kinase 4, cyclin L2, PMP22, and retinoblastoma-like 1.
Enzymes and inhibitors
For a detailed explanation, see the legend for Table 1.
Cytoskeleton-related genes
As previously reported after ischemia in adult and immature brain, GFAP was upregulated and neurofilament was downregulated. Alterations of several new genes occurred in the immature brain after HI, including lamin A, myosin If, transgelin, calponin 3 and moesin, tubulin beta 4, myosin Vb, and keratin complex 1.
Genes involved in transport
The expression of Glut 1 was increased, which is consistent with previous observations after ischemia in both the adult and immature brain. The predominant aquaphorin in the brain, aquaphorin 4, was also upregulated, which has previously been shown after ischemia in the adult brain. In addition, several new genes involved in transport were upregulated after ischemia, including OTS-8, solute carrier family 7 and 12, ATP-binding cassette 1, fatty acid transport protein 3, transcobalamin II, and ferritin light chain.
Genes related to signal transduction
For a detailed explanation, see the legend for Table 1.
Genes related to ion and vesicular transport, synaptic transmission, hormones and neurotransmitters
Many previously unreported genes in this category were downregulated, including transient receptor protein 1 and 5, calcium channel P/Q type alpha 1A, glutamate receptor inotropic NMDA1, complexin 1, and beta-spectrin 3; however, some novel genes were also upregulated, such as OCTN1 and OCTN3, ATP receptor P2×4 subunit, proline-rich protein 48, and snap-23.
Genes related to metabolism
Several new metabolism-related genes were upregulated after ischemia, including glycoprotein galactosyltransferase alpha 1,3, lysosomal alpha-N-acetylglucose aminidase and hexosaminidase A (carbohydrate metabolism), acetyl-CoA thioesterase, glycerol-3-phosphate acyltransferase, apolipoprotein CII, apolipoprotein CI, lysosomal acid lipase, carnitine palmitoyl-transferase 1 (lipid and fatty acid metabolism), whereas several genes involved in cholesterol metabolism such as HMG-CoAR, squalene synthase, sterol-C4-methyl oxidase-like and mevalonate (diphospho) decarboxylase were downregulated.
Other genes
Smoothened homolog, SHYC, AC133 antigen, paraoxonase 3, purine nucleoside phosphorylase, GT12, and kidney cell line–derived transcript 1 are other new genes that were upregulated in response to cerebral HI.
DISCUSSION
In this study, which is the first to describe the global changes in gene expression after HI in the immature brain, more than 300 genes and ESTs, belonging to many different functional categories, were differentially expressed. More than 90% of the genes have not previously been described after HI in the immature brain, and only about 25% of the genes were previously known to be induced by ischemia. The study offers new information about changes in gene expression after cerebral ischemia, which may play an important role in the development of injury in the immature brain. In addition, the gene expression has been investigated at four different time points after the HI, which gives a good overview of both early and late changes in expression.
We chose to examine the gene expression in all parts of the gray matter that are affected by HI and where injury usually develops, including the cortex, hippocampus, striatum, and thalamus. Several previous studies that have investigated changes in gene expression after adult ischemia have focused on the cortex (Kim et al., 2002; Lu et al., 2003; Schmidt-Kastner et al., 2002) or hippocampus (Gilbert et al., 2003; Jin et al., 2001) only. Because the injury after neonatal HI develops in other regions as well, choosing only one specific region would potentially leave out important genes that are expressed locally in distinct areas. In addition, the tissue samples were taken from all parts of the different gray matter regions, which may include the core of infarction, the periinfarction area, and even noninjured tissue (especially at the early time points after HI). The reason for not only choosing the periinfarction area was that especially at early time points after HI there is no clearly defined area of infarction, making it impossible to dissect out the periinfarction area. In this study, a moderate hypoxic-ischemic insult was induced, which results in somewhat delayed development of injury over at least 1 or 2 days (Blumberg et al., 1997; Gilland et al., 1998; Nakajima et al., 2000), in contrast to the model of permanent middle cerebral artery occlusion used in other microarray studies (Kim et al., 2002; Lu et al., 2003), where maximal lesion volume is already established 3 or 4 hours after occlusion (Kaplan et al., 1991; Memezawa et al., 1992). In addition, the model of HI involves reperfusion and the studies were performed in neonatal animals. These differences between the models could explain the large number of newly identified genes in this study. In addition, more animals at each time point were studied, allowing for a statistical comparison between treatment groups, and more time points were investigated, which could further explain the number of newly identified genes in this study.
In this study, four of the upregulated genes were also upregulated when analyzing their expression with real-time PCR, and the upregulation of nine genes belonging to the immune-inflammatory system have also been confirmed with real-time PCR in (see our companion article in this issue), showing a good agreement between results from the microarray analysis and real-time PCR. In addition, several genes and proteins previously reported to be induced after HI such as c-jun, c-fos, jun-B, heat shock proteins 70 kd (70–3,70) (Gubits et al., 1993; Munell et al., 1994), glut1 (Vannucci et al., 1998), gadd45 alpha (Charriaut-Marlangue et al., 1999), heme oxygenase (Bergeron et al., 1997), and clusterin (Han et al., 2001) were also upregulated on the array. These factors indicate that microarray analysis is a good and reliable method for investigating a large number of differentially expressed genes.
Most upregulated transcripts were induced among genes belonging to the group of transcription factors and genes related to metabolism, whereas most downregulated transcripts were found among genes belonging to the category of ion and vesicular transport, synaptic transmission, hormones, and neurotransmitters, followed by the category of genes involved in signal transduction. Genes involved in transcription, stress, and apoptosis were induced early after the insult, making them especially interesting as potential targets for drug therapies. Several new genes were found in these categories, and their putative role in the pathophysiology of neonatal HI brain injury will be discussed next.
Genes related to apoptotic/cell death
Metallothionein 1 and 2, which previously have been shown to be upregulated after focal ischemia in adult animals (Trendelenburg et al., 2002), were also upregulated after HI in the immature brain. Metallothioneins have anti-inflammatory, antioxidant, zinc-chelating, and antiapoptotic effects, which may explain why metallothionein 1+2 gene deficiency confers vulnerability to ischemia (Trendelenburg et al., 2002), and they are likely to exert the same protective effects in the immature brain.
B-cell transcription (Btg) genes 1, 2, and 3 belong to a family of antiproliferative genes that were all significantly upregulated at early time points (2 and 8 hours) after HI. Both Btg1 and Btg2 can be induced by DNA damage, and the Btg proteins may be early mediators of a common signal transduction pathway involved in growth arrest and/or differentiation by modulating a general biochemical process such as protein methylation (Cortes et al., 2000). Besides its effect on neuronal differentiation, Btg2 exerts antiapoptotic effects (el-Ghissassi et al., 2002), whereas Btg1 seems to have pro-apoptotic properties (Lee et al., 2003), at least under some conditions.
Several members of the ATF/CREB family were induced by HI in the immature brain. The transcription factor Atf4, which is a transcription factor involved in the induction of the ER-stress–inducible chop-10/gadd-153 (Harding et al., 2000), was induced early (8 hours) after HI. Interestingly, chop-10/gadd-153 was also transiently upregulated at 8 hours after HI, which may be important because chop-10 is a proapoptotic protein that exerts its effects through interaction with the Bcl-2 family of proteins. Another proapoptotic member of this family, Atf3, was strongly induced already at 2 hours after HI, and remained upregulated at all time points examined. Atf3 has previously been shown to be upregulated after ischemia in the adult brain (Ohba et al., 2003; Schwarz et al., 2002). Atf3 is induced after DNA damage, and overexpression of this protein slows down progression of cells from G1 to S phase (Fan et al., 2002). It also promotes caspase activation during DNA-damaging agent–induced apoptosis (Mashima et al., 2001), and Atf3 function can negatively be modulated by chop-10 (Chen et al., 1996). Atfx, which is the only antiapoptotic member of the ATF/CREB family, was induced 24 hours after HI. It seems to promote cell survival by modulating the expression of antiapoptotic genes that encode for proteins that disrupt signal transmission from activated “death receptors” to the initiator caspases in the extrinsic pathway of apoptosis (Persengiev and Green, 2003). In contrast, the death-associated protein that was upregulated at 3 days after HI mediates interferon γ–induced and tumor necrosis factor-α–induced apoptosis, presumably through recruitment of the FADD death effector (Liou and Liou, 1999).
Several genes among the interferon regulatory factors (Irf1, Irf5, Irf7, Irf8, and Irf9) were induced in the immature brain after HI. These proteins have both antiproliferative (e.g., Irf1 represses cyclin dependent kinase-2) and proapoptotic properties (Barnes et al., 2003; Xie et al., 2003), but are also important regulators of host defense (Taniguchi et al., 2001). Their role in the immature brain is uncertain, but Irf1 deficiency confers resistance to focal ischemia in the adult (Iadecola et al., 1999). All Irf genes were induced at 24 to 72 hours after HI, suggesting that they could be involved in late-stage apoptosis or in regulation of the inflammatory response after HI. Irf1 belongs to the family of myeloid differentiation (MyD) primary-response genes that are associated with growth arrest and apoptosis, but they also play a prominent role in host defense and inflammation (Liebermann and Hoffman, 2003). Other members of this family are the alpha, beta, and gamma forms of the gene for growth arrest DNA damage–inducible protein (GADD45), which were all induced after HI. Some of them have previously been reported after ischemia in the immature (only GADD45 alpha) (Charriaut-Marlangue et al., 1999) and mature brain (Jin et al., 1996). Gadd45 alpha, beta, and gamma are induced by DNA damage and seem to serve similar, but not identical, functions along different apoptotic and growth inhibitory pathways. It appears that depending on the stress stimulus encountered, the cell type, or the interaction with other proteins, the outcome can be cell cycle arrest, DNA repair and cell survival, or apoptotic cell death (Liebermann and Hoffman, 2003). These results indicate that they could play both protective and injurious roles after HI. Gadd45 alpha and gamma were upregulated already at 2 hours after HI and gadd45 beta and gamma were still upregulated 3 days after the insult, suggesting that they may play important and perhaps different roles in the initial and later stages of HI brain injury in the neonatal brain.
Signal transducer and activator of transcription (STAT) proteins are phosphorylated by receptor-associated kinases and form heterodimers that translocate into the nucleus where they act as transcriptional activators. The STAT-1 and STAT-6 genes were induced after HI. STAT-6 has not previously been found to increase in the brain after ischemia, but the corresponding protein induces antiapoptotic proteins such as Bcl-xL and has protective effects in liver and renal ischemia (Kato et al., 2000; Masuda et al., 2001; Yokota et al., 2003). STAT-1 is, however, phosphorylated in response to focal ischemia, and STAT-1 gene disruption confers cerebroprotection. The deficiency of STAT-1 seemed to increase pAkt and decrease the activation of caspase-3 (Takagi et al., 2002). STAT-1 seems to be important for the induction of Irf1, as interferon-α– and interferon-γ–induced expression of Irf1 is abolished in STAT-1–deficient cells (Meraz et al., 1996). BCL2/adenovirus E1B 19-kd–interactive protein 1, which is a nuclear member of the “BNIP family” that interacts with Bcl-2 and activates the caspases via the intrinsic pathway (Zhang et al., 2002), was induced at 8 and 24 hours after HI and is another gene that might be involved in the extensive activation of caspase-3 after HI in the immature brain (Wang et al., 2001b).
The expression of disabled homolog 2 and TDAG51 increased after HI, which speculatively suggests that “anoikis” occurs in the immature CNS under these conditions. Disabled homolog 2 modulates integrin-linked kinase (Wang et al., 2001a) that prevents anoikis, whereas TDAG51 promotes detachment-mediated cell death (Hossain et al., 2003).
Antiapoptotic genes
The antiapoptotic genes Bcl-2-related protein A1b and d (markedly induced 8 to 72 hours after HI) are expressed in inflammatory cells (neutrophils and macrophages), and they seem to counteract inflammation-mediated apoptosis (Orlofsky et al., 2002), resulting in a sustained population of proinflammatory cells, which helps to maintain an inflammatory reaction in the brain after HI.
A persistent expression of the Bcl-2–associated athanogene 3, which is one of six members of the “BAG” family, was found after HI. This protein is predominately antiapoptotic through interaction with both bcl-2 and heat shock proteins (Doong et al., 2002; Parcellier et al., 2003). The increased expression of the gene for sphingosine phosphate lyase 1 at 24 and 72 hours after HI results in an increased production of ceramides, which are antiapoptotic in immature HI, again through interaction with bcl-2 family proteins (Hossain et al., 2003). The TIAP gene, which belongs to the IAP (inhibitor of apoptosis) family of inhibitors of caspase-3 and caspase-9, was upregulated at 72 hours after HI. We recently found that overexpression of another member of this family, XIAP, reduces injury in the immature brain (Wang et al., 2004).
The nrf2 gene was also upregulated persistently from 8 hours to 3 days after HI, which is interesting because nrf2 induces transcription of antioxidative enzymes and may thereby exert neuroprotective effects (Ohtsubo et al., 1999). Furthermore, nrf2 is part of the ERK1/2 survival pathway (Owuor and Kong, 2002) and has antiapoptotic effects through inhibition of Fas-mediated cell death (Kotlo et al., 2003). A transient upregulation of G2 S phase–expressed protein 1 (GTSE-1) mRNA was seen at 24 hours after HI. GTSE-1 inhibits p53-dependent apoptosis after DNA damage (Hossain et al., 2003), and another new antiapoptotic gene apoptosis inhibitor 6/AAC-11, which inhibits apoptosis after growth factor withdrawal (Tewari et al., 1997), was upregulated threefold at 3 days after HI. These data suggest that several endogenous antiapoptotic genes are induced after HI to protect neurons and/or glia from apoptosis, although several of the genes are induced quite late after the insult, when an extensive amount of cells have already succumbed to apoptotic mechanisms.
Heat-shock proteins
As previously shown in several insult models (Parcellier et al., 2003), heat shock proteins (HSP) were also induced in this study. These molecular “rescue” chaperones assist in the correct folding of intracellular proteins, regulate ubiquitination/protein degradation, and also counteract caspase-dependent and caspase-independent apoptosis (especially HSP 70) (Parcellier et al., 2003). We found that HSP 70-5, HSP 40, HSP 47, heat responsive protein 12 and HSP 22 were upregulated, which has not previously been shown to occur in the immature brain subjected to HI. Their individual functions remain largely unknown, but small HSPs (HSP 22, 40, and 47) are ATP-independent chaperones regulated by phosphorylation and oligomerization and act alone or as cochaperones to high molecular HSPs to protect cells from protein aggregation. Indeed, overexpression of a member of HSP 40 was recently shown to protect astrocytes in a model of oxygen glucose deprivation (Qiao et al., 2003) and targeted overexpression of HSP 70–5 reduced hippocampal injury in vitro and attenuated ischemic damage in vivo (Kelly et al., 2001). In addition, transgenic mice overexpressing Hsp70 showed protection against focal ischemia (Rajdev et al., 2000), and gene transfer therapy with viral vectors overexpressing hsp72 improved neuronal survival after focal cerebral ischemia and systemic kainic acid administration (Yenari et al., 1998). However, in a recent report, overexpression of Hsp70 failed to confer neuroprotection after global ischemia in the adult mouse (Olsson et al., 2004), leaving the conclusive role of HSPs after ischemia unresolved.
We also found a significant upregulation of the gene for the rate-limiting enzyme (gamma-glutamylcysteine synthetase) in glutathione biosynthesis after HI. It is known that glutathione is released and levels decrease after HI (Wallin et al., 2000). This would lead to an increased oxidative state and may be the trigger for induction of gamma-glutamylcysteine synthetase. Glutathione peroxidase was only slightly induced 3 days after the insult, which offers additional support for the relative deficiency of this enzyme in the immature CNS, with a subsequent inability to metabolize hydrogen peroxide as previously shown (Ferriero, 2001).
In conclusion, more than 300 differentially expressed genes were detected after HI in the immature brain, many of which had not previously been linked to cerebral ischemia and had not been reported after HI in the neonatal brain. Several new genes that may play an important role in the pathogenesis of neonatal HI have been identified, but their specific functions and cellular expression after HI will need to be further elucidated.
Footnotes
Acknowledgements
The authors thank Eva Cambert for technical assistance.