
Abstract
Laser-Doppler flowmetry (LDF) is very popular for measurements of dynamic changes of cerebral blood flow (CBF). We studied whether changes of CBF measured by LDF correlate with CBF measured by the [14C]iodoantipyrine (IAP) technique in the range relevant for most physiological experiments (—30– + 130%). LDF was recorded biparietally by two laser-Doppler probes in halothane-anesthetized rats. Absolute CBF was measured in tissue samples of both parietal cortices after [14C]iodoantipyrine was given i.v. CBF of one hemisphere was reduced by an episode of cortical spreading depression (CSD), which markedly reduces the responsiveness of the ipsilateral cortical CBF to vasoactive stimuli for up to 30 min, while CBF regulation of the contralateral cortex remains intact. CBF was measured under normoventilated, hypercapnic, and hypoxic conditions. The relative changes of CBF measured by the LDF technique were independent of the preceding baseline LDF value. Absolute CBFIAP values correlated poorly to the simultaneously recorded arbitrary LDF values (r = 0.44). In contrast, the ratio of CBFIAP values correlated with the ratio of the relative LDF changes between the two hemispheres (p < 0.001). At reduced CBF, no significant difference was found between methods. At increased CBF, however, LDF was greater than CBFIAP, as indicated by a slope of correlation of 1.45 (p < 0.005).
Keywords
Laser–Doppler flowmetry (LDF) is a powerful non-invasive technique for continuous measuring of cerebral blood flow (CBF) with instantaneous recording of dynamic changes of erythrocyte flow (Eyre et al., 1988; Kocher, 1990; Carter, 1991; Piper et al., 1991; Morita Tsuzuki et al., 1992). Changes of CBF detected by LDF compare well with measurements performed with the hydrogen, H2, clearance technique (DiResta et al., 1987; Skarphedinsson et al., 1988; Haberl et al., 1989a) and microspheres (Eyre et al., 1988; Lindsberg et al., 1989; Talman et al., 1991; Colditz et al., 1993), but LDF is of limited utility in the evaluation of absolute CBF. Only two studies have compared LDF to the [14C]iodoantipyrine (IAP) technique (Dirnagl et al., 1989; Goadsby, 1991) although the latter method is used commonly for CBF measurements in animals. Results obtained so far show that LDF changes correlate well with the IAP technique at reduced levels of CBF, but there are only scarce data at increased CBF levels. This is important, as LDF is particularly useful in the evaluation of phasic CBF increases (Iadecola and Reis, 1990; Adachi et al., 1992; Fabricius and Lauritzen, 1994; Akgoren et al., 1994). Therefore, we decided to reexamine the validity of LDF measurements as compared to CBF measured by IAP with special regard to CBF increases.
MATERIALS AND METHODS
Animal preparation
Twenty-two male Wistar rats (300–350 g) were anesthetized with halothane (Vapor; Dräger, Lübeck, Germany) (4% induction, 1.5% during surgery and 0.7% maintenance) in O2 30%/N2O 70%. Catheters were inserted into a femoral artery and a femoral vein, and the trachea was cannulated. After relaxation with 5–15 mg of suxamethonium i.p., rats were ventilated with a volume respirator and placed in a headholder. Holes of 3 × 3 mm were drilled in the parietal bones bilaterally by use of a dental drill under continuous saline superfusion, and the dura was carefully opened. Holes of 1–2 mm for elicitation of cortical spreading depression (CSD) were drilled in the frontal bones on both sides. Animals were excluded from the study if they had visible bleeding from pial vessels or the brain parenchyma during surgery. Craniotomy sites were continuously superfused with artificial cerebrospinal fluid (CSF) (composition in mM: NaCl, 120.00; KCl, 2.8; NaHCO3, 22.00; CaCl2, 1.45; Na2HPO4, 1.00; MgCl2, 0.876) at 37°C aerated with 95% O2 5% CO2 at a rate of 0.5 ml/min.
LDF
CBF was monitored continuously and simultaneously over the parietal cortex on both sides by two laser-Doppler probes at a fixed position 0.3 mm above the pial surface (PF 403, fiber separation 0.15 mm; wavelength of 780 nm, maximal intensity of 1 mW Periflux 4001 Master, Perimed AB, Sweden). Care was taken to avoid visible vessels when positioning the probes. After stable readings were obtained, the probe was left at that position for the duration of the experiment.
When laser light enters perfused tissue, photons, which interact with moving red blood cells, are Doppler (frequency) shifted, while light scattered by stationary cells remains unshifted (Riva et al., 1972; Stern, 1975). Analysis of the backscattered light gives the mean Doppler shift, which is proportional to the velocity of the red blood cells, and the amplitude of the Doppler-shifted signal, which is proportional to the volume of moving elements in the tissue. The CBF equivalent (CBFLDF) is derived from the multiplication of the mean Doppler shift by the fraction of light that is Doppler shifted (Stern et al., 1977).
IAP measurements
To validate LDF, CBF was measured by the IAP method (CBFIAP). The method has been described in detail previously (Lauritzen, 1987; Sakurada et al., 1978). While continuous LDF readings were taken, 25 μCi 4-(N-methyl-14C)-IAP in 200 μL of saline was given i.v. Simultaneously, arterial blood was sampled at 3-s intervals into heparinized glasses. At 21 s after the isotope injection, cardiac arrest was induced by an i.v. injection of 2 ml of air. LDF-probes were removed and the tissue areas below the probes were marked with a small spot of methylene blue for identification. The rat was decapitated within 15 s and cortical tissue was sampled bilaterally from an area around the LDF-probe position in the parietal cortex. Care was taken not to contaminate the sample with white matter. Within 1 min after cardiac arrest, tissue samples were transferred to preweighed vials and weighed. Tissue samples weighed 40 ± 14 mg. Samples were dissolved in 1.5 ml soluene and blanched with 0.5 ml 30% hydrogen peroxide at 50°C overnight before counting. Sample treatment was completed by the addition of 10 ml of a 9:1 mixture of Instagel (Packard) and 0.5 N HCl (vol/vol). Vials were counted in a Tri-Carb 2200 CA liquid scintillation analyzer. CBFIAP was calculated according to the method of Sakurada et al. (1978) (Sakurada et al., 1978; Lauritzen, 1987). The equation

was solved for f, representing CBFIAP, where T denotes the time at termination of the experiment, i.e., 21 s; Ci(T), the IAP content per unit weight of brain tissue at time T; Ca(t), the arterial concentration of IAP at time t; and k = f/λ, the rate constant, where λ = 0.78 is the partition coefficient of IAP between blood and brain at equilibrium.
CSD
A single-barreled glass microelectrode (tip diameter of 2.5–5.0 μm) was filled with isotonic saline, connected to an Ag/AgCl wire, and lowered 500 μm into the parietal cortex next to the laser-Doppler probe on one or two sides for recording of the direct current (DC)-potential (Hansen and Zeuthen, 1981). Animals were grounded with a reference electrode consisting of an Ag/AgCl wire resting s.c. close to the thigh. CSD was induced by a brief superficial needle stab in the frontal cortex on the left side and evidenced by the characteristic large negative change of the DC-potential recorded over the left parietal cortex. Following CSD, CBF was reduced and the responsiveness to vasoactive stimuli was markedly reduced for up to 30 min, during which time CBF regulation of the contralateral cortex remained intact (Lauritzen, 1984).
Protocol
Initially, after stable LDF readings were obtained, the vascular reactivity was measured twice to ensure that the brain was undamaged. In 16 animals, 5% CO2 was added to the inhalation mixture for 5 min. Animals with unstable baselines or reduced CO2 reactivities were excluded. In six animals, this procedure was replaced by induction of two short periods of hypoxia (16% O2 for 4–6 min).
The suppressing effect of single episodes of CSD on CBF and vascular reactivity was used to induce marked differences of CBF between the two hemispheres. It is well established that vascular reactivity to hypercapnia is reduced following CSD (Lauritzen, 1984; Piper et al., 1991; Kocher, 1990), and we examined if the reactivity to hypoxia was affected as well.
CBF was measured by the LDF and IAP methods simultaneously during the period of maximally reduced vascular reactivity at 20–25 min after the CSD. Seven rats were studied under normoventilation. In nine rats, hypercapnia was induced for 5 min before IAP, and in six rats, hypoxia was induced for 5 min before the isotope injection.
Statistics
The relative CBFLDF value was obtained for each hemisphere by expressing CBFLDF during the time of isotope circulation as a percentage of the baseline level preceding the induction of CSD. Subsequently, the RatioLDF—a fraction in which the numerator was the relative CBFLDF of the untouched hemisphere while the denominator was the relative CBFLDF of the CSD hemisphere—was calculated. For CBFIAP, a RatiOIAP was calculated by dividing CBFIAP at the probe site of the untouched hemisphere by the CBFIAP at the probe site of the CSD hemisphere. Thus, we compared LDF to IAP by simultaneous measurements of CBF in homologous brain regions.
For each experimental group, a regression analysis was performed using the model

Distribution of residuals were not normal, but became so after logarithmic transformation of the data. As normal distribution is a condition for a linear regression analysis, the model was changed to

thereby transforming the point of identical CBF in the two hemispheres (1,1) into the origin (0,0). For each group, we tested if the intercept α′ was significantly different from 0. This was not the case, and the model was changed to

thereby forcing the line through origin.
Data are given as mean ± 1 SD. Two-group comparisons were made using Student's t-test. Physiological variables (Table 1) and intercepts and slopes of the regression lines were compared by f-tests. Slope values are given ± 1 standard error of estimate.
Physiological variables of animals
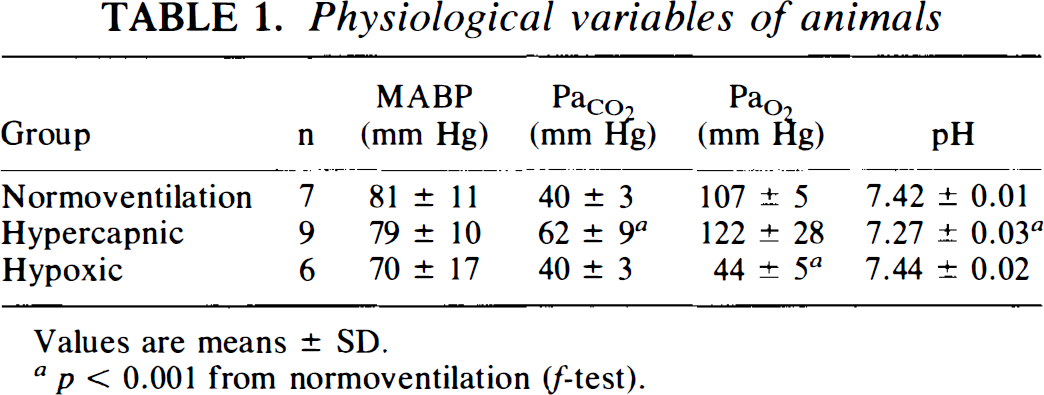
Values are means ± SD.
p < 0.001 from normoventilation (f-test).
RESULTS
Physiological variables for the groups are shown in Table 1. Mean arterial blood pressure (MABP) was significantly reduced during hypoxia (but not <60 mm Hg) when compared to MABP during normoventilation in the same animals (p < 0.001). The time course of CBFLDF during two episodes of hypoxia separated by an episode of CSD is depicted in Fig. 1. The CBFLDF increase of 36 ± 21% in response to 4–6 min of hypoxia under control conditions was reduced to 12 ± 15% (n = 6, p = 0.02) after one episode of CSD. Reactivity of CBFLDF to hypercapnia was 3.3 ± 1.4%/mm Hg before CSD and 0.5 ± 0.8%/mm Hg at 20–25 min after CSD (n = 9, p < 0.001).
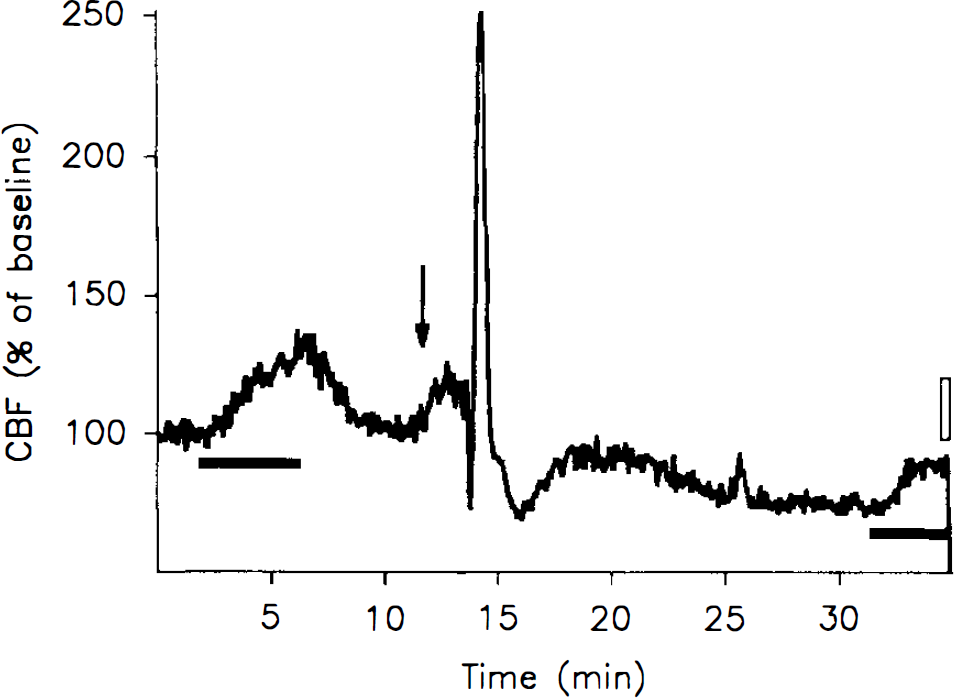
Time course of CBF as measured by LDF in the parietal cortex of the rat. Arrow indicates time of a needle stab in the frontal cortex. The marked rise of CBF accompanies a wave of CSD passing by the point of measurement. Black bars indicate periods of hypoxia, when inspired oxygen was lowered from 30 to 16%. Before CSD, a marked CBF increase was seen, but this response to hypoxia was reduced after the CSD. The open bar indicates the 21-s circulation time of iodoantipyrine.
LDF values are expressed in arbitrary units. Small changes of the position of the probe usually caused large changes of the baseline value. We examined the influence of the prevalent baseline CBFLDF for the maximal rise of CBF during CSD: the difference of CBF (CBFLDF during CSD – baseline CBFLDF) correlated positively to the baseline (p = 0.006, r = 0.56) (Fig. 2), while the relative increase of CBF (CBFLDF during CSD/baseline CBFLDF × 100%) did not correlate to baseline CBFLDF, since the slope of the regression line was close to zero (–0.06 ± 0.13) (p = 0.67, r = −0.10). This supports the validity of expressing CBFLDF changes as percent of the preceding baseline, and suggests that the baseline value is unimportant for the % change of CBFLDF.
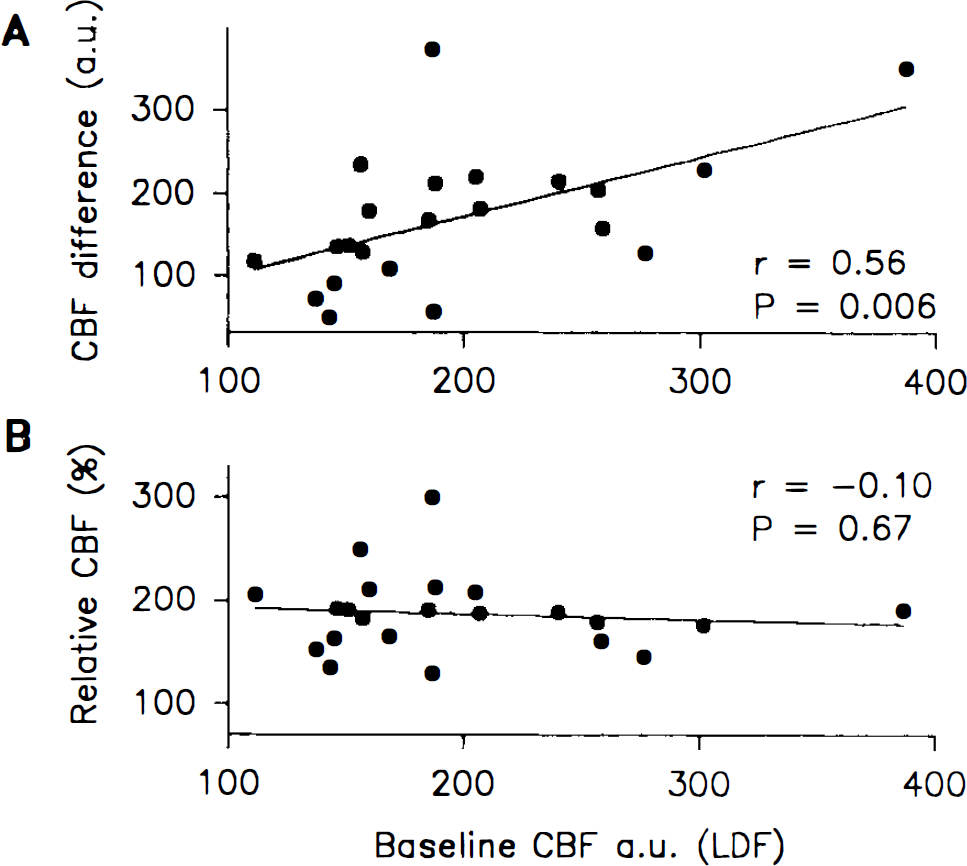
Maximal CBF attained during CSD plotted against preceding baseline CBF as measured by LDF in arbitrary units (a.u.). Linear regressions with correlation coefficients (r) and p-values (from slope = 0) are indicated. Ordinates designate (
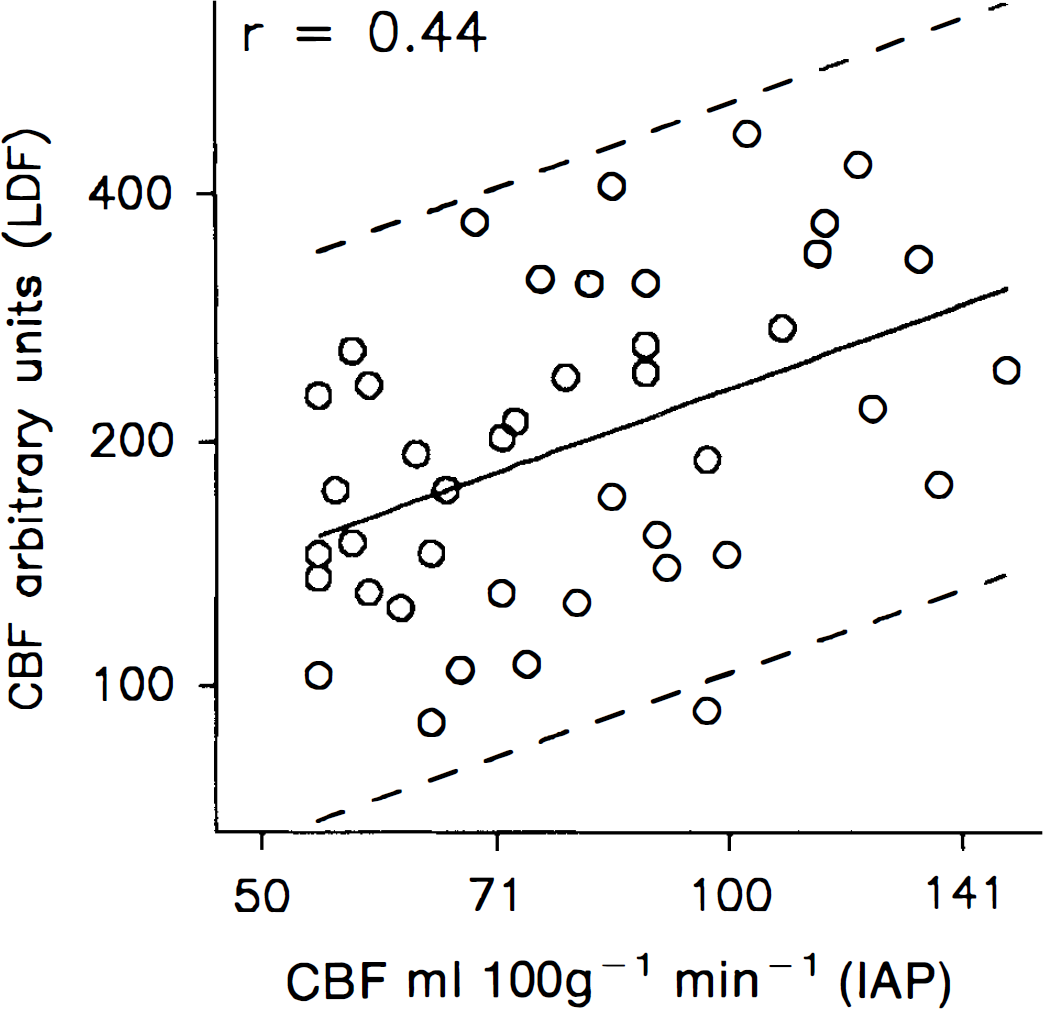
The level of CBFIAP in the cortex in the normoventilated group ranged between 68–136 ml × 100 g−1 × min−1 on the untouched side and 54–96 ml × 100 g−1 × min−1 on the CSD side. The highest CBFIAP value attained was 150 ml × 100 g−1 × min−1 in a hypercapnic animal. Absolute CBFIAP values were compared to simultaneously recorded numerical LDF values (Fig. 3). Values obtained by the two methods were positively correlated (p = 0.003), but the correlation coefficient was only r = 0.44. The predictive interval (95% level) of CBFIAP for numerical CBFLDF was 45–224% of the predicted value (Fig. 3).
CBF measurements by
The marked transient increase of flow during CSD was followed by a prolonged period of CBF decrease on the CSD side as evidenced by a RatioLDF of 1.29 ± 0.20 and a RatioIAP of 1.36 ± 0.15 for normoventilated animals (n = 7, p < 0.005 from 1.0 for both methods) (Table 2). Ratios for the hypercapnic and hypoxic groups reflect the reduced reactivity of the CSD side (Table 2). For the hypercapnic group, the RatioLDF was 1.70 ± 45, while the RatioIAP was 1.43 ± 27 (p < 0.005, LDF versus IAP). This suggests an important difference between the two techniques under conditions of increased CBF.
Ratio of CBF between the hemispheres as measured by the IAP method and by LDF ∼20 min after CSD has been elicited in one hemisphere
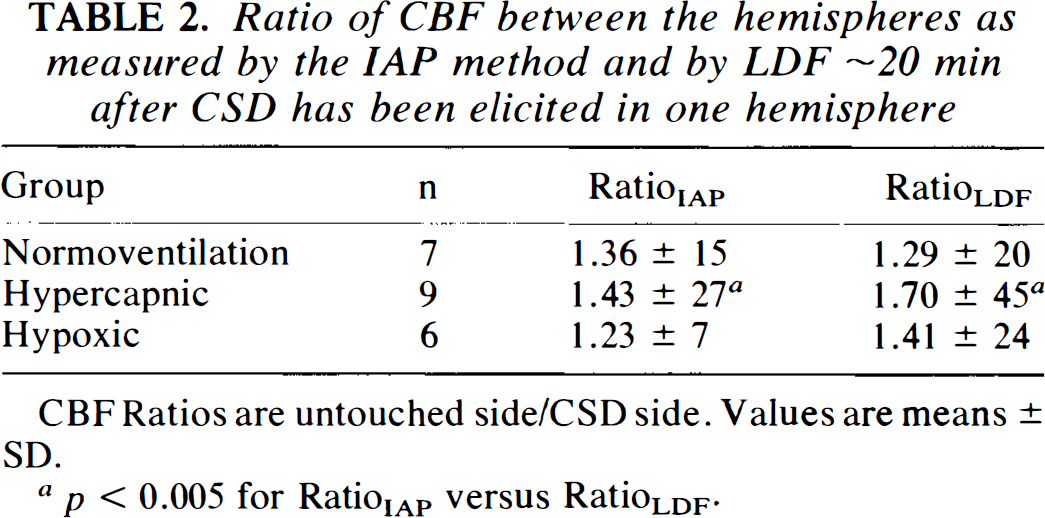
CBF Ratios are untouched side/CSD side. Values are means ± SD.
p < 0.005 for RatioIAP versus RatioLDF.
Linear regression analyses (eq. 2) for the log(RatioLDF) versus the log(RatioIAP) were performed for each experimental group. The intercept α′ of the regression lines were not significantly different from 0 (p = 0.19, f-test), whereupon linear regressions through the origin (eq. 3) could be performed. The slope β″ for the three groups differed significantly (p = 0.007, f-test). Therefore, the three groups could not be analyzed by one single regression analysis. However, it was allowable to perform one linear regression analysis through origin for normoventilated animals and one for hypercapnic/hypoxic animals (R2 = 0.90 for the joint regression analyses) (Fig. 4). The slope of the regression line for normoventilated animals was 0.70 ± 0.17, not significantly different from 1, representing the line of unity (p = 0.09). Thus, for this group no significant difference was found between the two methods. Still, the p-value is low and we cannot exclude that significance would have been reached with a greater number of animals. For hypercapnic/hypoxic animals, the slope of the regression line was 1.45 ± 0.11, significantly different from 1 (p < 0.001). The data suggest that CBFLDF is greater than CBFIAP when CBF increases.
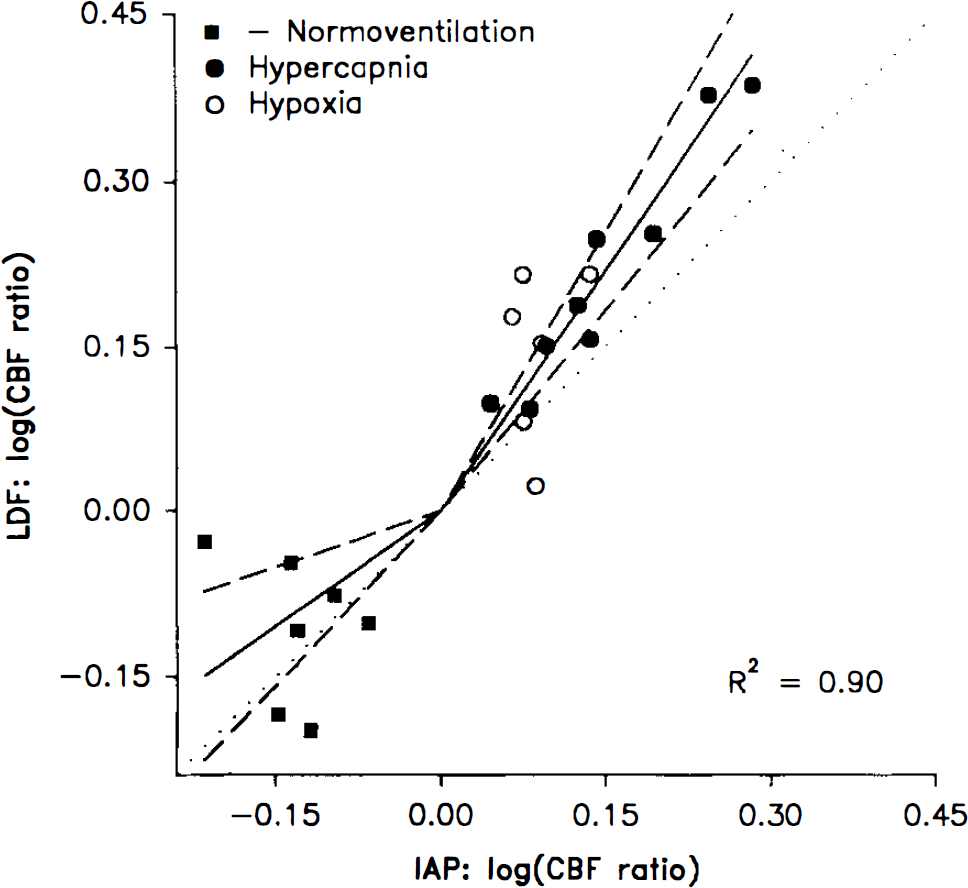
Ratios between the hemispheres of relative CBF changes obtained by LDF correlated to ratios of CBF values obtained by the IAP method. CBF was measured 20 min after an episode of CSD in one hemisphere. Scales of axes are logarithmic. The sign of the log (ratio) of normoventilated animals is shifted for clarity. A linear regression through the origin for the normoventilated animals was not different from the dotted line of identical ratios, while the regression line for hypercapnic or hypoxic animals deviates from the line of unity (p < 0.001). The 95% confidence limits for regression lines are indicated as straight stippled lines going through the origin. R2 applies to the joint linear regression analyses.
DISCUSSION
The validity of LDF for studies of brain microcirculation has been examined in a number of previous studies using four different reference methods: H2 clearance (DiResta et al., 1987; Skarphedinsson et al., 1988; Haberl et al., 1989a), microspheres (Eyre et al., 1988; Lindsberg et al., 1989; Talman et al., 1991; Colditz et al., 1993), pial artery diameter (Haberl et al., 1989a, b ), and IAP (Dirnagl et al., 1989; Goadsby, 1991). Studies indicate that LDF estimates changes of CBF reliably, although the studies comparing LDF to changes of pial artery diameter show differences in magnitude and time sequence of CBF changes (Haberl et al., 1989a, b ). Three studies suggest that the method can be calibrated for measurement of absolute CBF as well (DiResta et al., 1987; Eyre et al., 1988; Lindsberg et al., 1989). This may be possible if the “true” CBF is the same in every animal and if brain or spinal cord regions can be found with the same baseline LDF values in every animal. In that case, the numerical and relative LDF changes will have the same distribution. However, if the probe site is chosen irrespectively of the baseline LDF value in that tissue area, numerical LDF increases attained under experimental conditions will vary accordingly, as indicated by the linear correlation of the numerical CBFLDF increases to the corresponding baseline LDF values (Fig. 2A). In contrast, relative changes of CBFLDF are independent of baseline LDF values (Fig. 2B). Therefore, the baseline LDF value is unimportant for the assessment of percentage changes of CBFLDF. This has not been shown before, but is anticipated from the theoretical justification of LDF (Nilsson et al., 1980). Provided that the recording site is selected distant from visible vessels and stability of the preparation and laser probes is ensured, any site of the cerebral cortex may be selected for LDF measurements.
Numerical LDF values correlated poorly to the simultaneously recorded IAP values (Fig. 3). Thus, it is not possible to convert LDF values to absolute CBF except under the special conditions described above. The ratio of CBFLDF changes correlated better with the ratio of CBFIAP values between the two hemispheres (Fig. 4). No difference was found between the two methods for the normoventilated group, for which the increased ratio reflected a decrease of CBF by up to 30% on the CSD side. This is consistent with the idea that relative changes of LDF are useful for studies of dynamic changes of CBF. For the hypercapnic/hypoxic groups, for which the increased ratio mainly reflected a CBF increase on the untouched side, LDF overestimated CBF as compared to the IAP technique. The same result has appeared in the two other studies using IAP as the reference method. Dirnagl (Dirnagl et al., 1989) showed five pairs of values representing increased CBF of —30%. For four of these points, LDF gave ∼7% higher values than IAP. However, no separate linear regression was carried out for CBF increases. Goadsby (Goadsby, 1991) gave figures showing increases of CBFLDF by ∼60% compared to 30% by IAP, but the results were not commented on in the text. Nevertheless, results from these two studies are consistent with the results presented here.
In contrast, two of the three studies comparing the H2 clearance method to LDF reported agreement for CBF increases up to 75 and 130%, respectively (Skarphedinsson et al., 1988; Haberl et al., 1989a). Skarphedinsson observed a bi-exponential clearance curve of H2 with a fast and a slow component, possibly representing heterogenous grey matter flow, although white matter blood flow might contribute as well. LDF compared well to the slow clearance component, but not to the fast component. This may be understood in the light of recent studies in which confocal laser scanning microscopy showed oscillations of brain capillaries between plasma-erythrocyte flow and plasma flow alone (Villringer et al., 1994). It is possible that the fast H2 clearance component represents plasma flow and the second component represents plasma and blood cell flow combined. If so, this may explain why LDF, which measures red blood cell flow only, had a better correlation to the slow than to the fast component. The overestimation of CBF by LDF found in this and the two previous studies (Dirnagl et al., 1989; Goadsby, 1991) may be explained along the same line: IAP distributes in erythrocytes and plasma; thus, CBFIAP represents total blood flow. In conditions associated with increased CBF, such as hypercapnia or hypoxia, both volume and velocity of erythrocytes increase (Bereczki et al., 1993; Barfod et al., 1995), capillaries dilate, and more capillaries are erythrocyte-per-fused (Villringer et al., 1994). If the flow of erythrocytes increase more than plasma flow, LDF overestimates CBF. This notion is consistent with the observation that CBF measured by radiolabeled microspheres correlates excellently with LDF at increased CBF (Eyre et al., 1988; Lindsberg et al., 1989; Talman et al., 1991; Colditz et al., 1993). The close match is anticipated as microspheres are expected to distribute in the circulation in a fashion similar to the formed elements of the blood, i.e., erythrocytes. A factor of theoretical importance for the interpretation of our data is the restricted diffusion of IAP into the brain at high flow rates. However, CBFIAP remained well <180 ml/100 g/min, i.e., below the level at which diffusion limitation is of importance (Van Uitert et al., 1981). Therefore, we consider it unlikely that methodological difficulties with the IAP technique explain our results.
In conclusion, the results advocate caution when high increases of CBFLDF are compared to CBF measurements using IAP, since the relative overestimation by LDF increases as a function of increasing CBF. Furthermore, reduced reactivity to hypoxia can be added to the list of vascular changes accompanying CSD.
Footnotes
Acknowledgment:
We thank Ms. Lillian Grøndahl for expert technical assistance and Peter Dalgaard, M.Sc, PH.D., Biostatistical Department, University of Copenhagen, for valuable discussions. This study was supported by the Friis Foundation, the Danish Health Research Council, the NOVO-Nordisk Foundation, Lykfeldts legat, the Foundation of 1870, and the Cool Sorption Foundation.